Deep-Learning-Based Motion Correction For Quantitative Cardiac MRI
Alfredo De Goyeneche1, Shuyu Tang1, Nii Okai Addy1, Bob Hu1, William Overall1, and Juan Santos1 1HeartVista, Inc., Los Altos, CA, United States
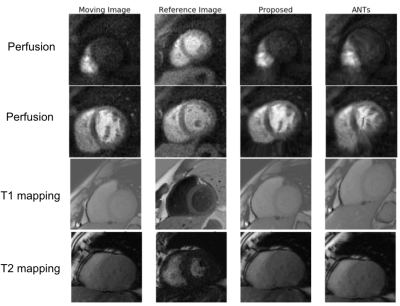
We developed a deep-learning-based approach for motion correction in quantitative cardiac MRI, including perfusion, T1 mapping, and T2 mapping. The proposed approach was faster and more accurate than a popular traditional registration method.
Representative image registration results of our proposed method. Our proposed methods are robust to the inconsistent contrast between the moving image and the reference image, whereas such inconsistency tends to cause distortions in ANTs results.
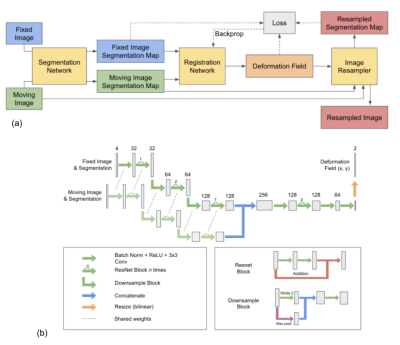
(a) Proposed framework for motion correction in cardiac MRI. The image registration neural network inputs are segmentation network outputs of the reference image and the moving image. The output of the registration network is the deformation field that is applied to the moving image to yield the registered image. (b) Registration neural network architecture.
Self-supervised Cardiac MRI Denoising with Deep Learning
Junshen Xu1 and Elfar Adalsteinsson1 1Massachusetts Institute of Technology, Cambridge, MA, United States
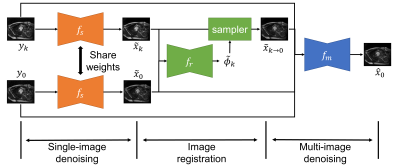
We propose a self-supervised deep learning framework for cardiac MRI denoising, where we explore
similarity of image content at different time frames and utilize the fact that noises of different observations are
independent and following similar noise model.
Figure 2. Overview of the proposed
self-supervised denoising framework.
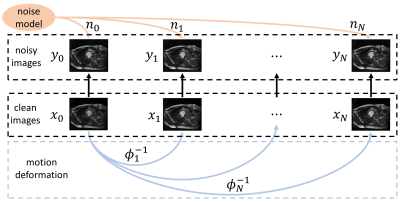
Figure 1. Visualization
of data model for cardiac MRI denoising.
Multi-task Deep Learning for Late-activation Detection of Left Ventricular Myocardium
Jiarui Xing1, Sona Ghadimi2, Mohammad Abdi2, Kenneth C Bilchick3, Frederick H Epstein2, and Miaomiao Zhang1 1Electrical and Computer Engineering, University of Virginia, Charlottesville, VA, United States, 2Department of Biomedical Engineering, University of VIrginia, Charlottesville, VA, United States, 3School of Medicine, University of Virginia, Charlottesville, VA, United States
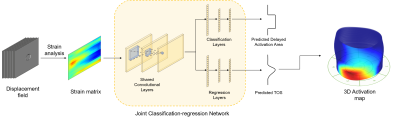
This work introduces an end-to-end multi-task deep learning network for fully automatic cardiac activation time detection, which offers: (i) prediction of late-activated regions and activation time (ii) fast & accurate 3D activation map (iii) no labor-intensive hand tuning process
Fig 2. Illustration of the proposed method, including the multi-task network aiming joint regression and classification.
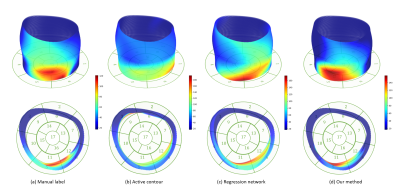
Fig 4. A comparison of 3D activation map reconstructed by (a) manual label; (b) active contour; (c) regression network; and (d) our method.
HDnGAN: High-fidelity ultrafast volumetric brain MRI using a hybrid denoising generative adversarial network
Ziyu Li1, Qiyuan Tian2, Chanon Ngamsombat2,3, Samuel Cartmell4, John Conklin2,4, Augusto Lio M. Gonçalves Filho2,4, Wei-Ching Lo5, Guangzhi Wang1, Kui Ying6, Kawin Setsompop7,8, Qiuyun Fan2, Berkin Bilgic2, Stephen Cauley2, and Susie Y Huang2,4 1Department of Biomedical Engineering, Tsinghua University, Beijing, China, 2Athinoula A. Martinos Center for Biomedical Imaging, Massachusetts General Hospital, Boston, MA, United States, 3Department of Radiology, Siriraj Hospital, Mahidol University, Bangkok, Thailand, 4Department of Radiology, Massachusetts General Hospital, Boston, MA, United States, 5Siemens Medical Solutions, Boston, MA, United States, 6Department of Engineering Physics, Tsinghua University, Beijing, China, 7Department of Radiology, Stanford University, Stanford, CA, United States, 8Department of Electrical Engineering, Stanford University, Stanford, CA, United States
Novel
generative adversarial network with a 3D generator and 2D discriminator
entitled HDnGAN.
Control over image sharpness by adjusting adversarial loss contributions.
Results similar to standard images
with longer scan time and superior to those from state-of-the-art denoising
methods.
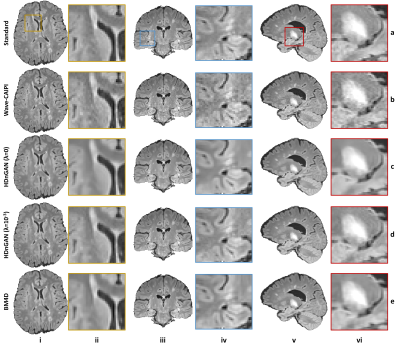
Figure 4. Results
along different directions. Representative axial (column i),
coronal (column iii), and sagittal (column v) image slices and enlarged regions
(columns ii, iv and vi) from different methods including standard (row a),
Wave-CAIPI (row b), HDnGAN (λ=0) (row c), HDnGAN (λ=10-3) (row d) of
3 evaluation subjects.
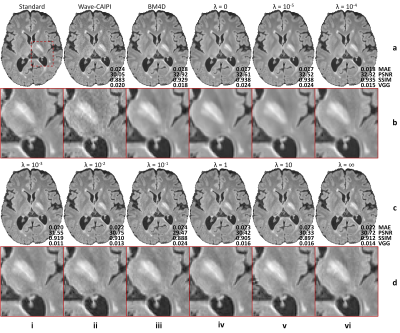
Figure 2. Effects
of the adversarial loss on image quality. Representative axial image slices
(rows a and c) and enlarged regions (rows b and d) from different methods and
weights (λ) of the adversarial loss of a multiple sclerosis patient. Metrics
including the mean absolute error (MAE), peak signal-to-noise ratio (PSNR),
structural similarity index (SSIM), and VGG perceptual loss are listed to
quantify the similarity between images from different methods and the standard
FLAIR image.
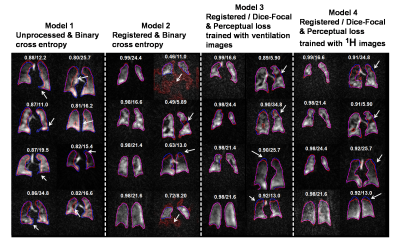
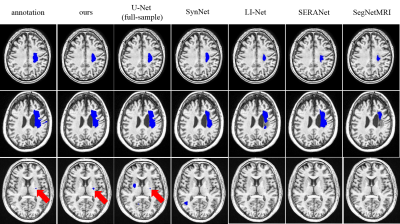
Deep learning-based thoracic cavity segmentation for hyperpolarized 129Xe MRI
Suphachart Leewiwatwong1, Junlan Lu2, David Mummy3, Isabelle Dummer3,4, Kevin Yarnall5, Ziyi Wang1, and Bastiaan Driehuys1,2,3 1Biomedical Engineering, Duke University, Durham, NC, United States, 2Medical Physics, Duke University, Durham, NC, United States, 3Radiology, Duke University, Durham, NC, United States, 4Bioengineering, McGill University, Montréal, QC, Canada, 5Mechanical Engineering and Materials Science, Duke University, Durham, NC, United States
We demonstrate
a 3D convolutional neural network that
facilitates quantitative image analysis by providing a thoracic cavity
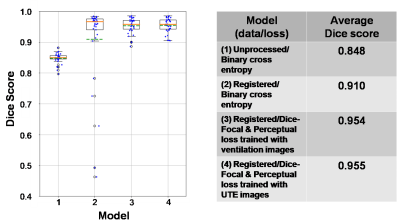
segmentation using only the 129Xe MRI. The CNN achieves a Dice score of 0.955 vs. the gold standard
expert reader segmentation.
Figure 4. Segmentations from different models.
For each model, the 4 best (left) and worst (right) segmentations are shown
with Dice score/SNR (these were calculated from the whole 3D volume). The models’
segmentations are shown in red, those from the expert readers in blue, and
their overlaps in purple. White arrows indicate areas where models deviated
from ground truth. From this comparison, the model trained with registered data
performs better than unprocessed data but struggles with low-SNR and poor
ventilation images. Our proposed method (model 3 & 4) helps solve this
problem.
Figure 5. Box plot and table of Dice score for each model tested with the “pristine”
test dataset. The orange lines indicate the median of the score while the dash
green lines indicate the mean. By comparing model 1 and 2, the plot shows the
improvement in using the registered dataset for training 3D-CNN but with a
drawback shown by low-score outliers due to poor ventilation and low-SNR images. Our
proposed method (model 3 & 4) solves the problem and eliminates these
outliers.
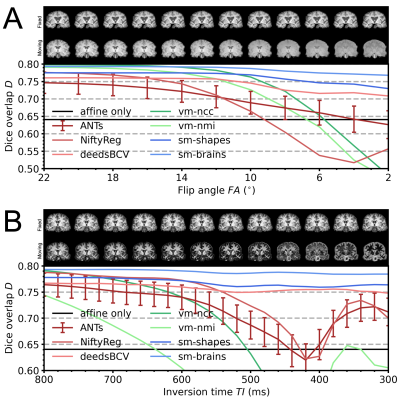
Learning-based non-linear registration robust to MRI-sequence contrast
Malte Hoffmann1,2, Benjamin Billot3, Juan Eugenio Iglesias1,2,3,4, Bruce Fischl1,2,4, and Adrian V Dalca1,2,4 1Department of Radiology, Harvard Medical School, Boston, MA, United States, 2Department of Radiology, Massachusetts General Hospital, Boston, MA, United States, 3Centre for Medical Image Computing, University College London, London, United Kingdom, 4Computer Science and Artificial Intelligence Laboratory, MIT, Cambridge, MA, United States
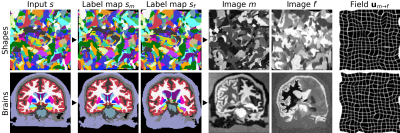
We leverage a generative strategy for diverse synthetic label maps and images to learn deformable registration without acquired images. Training on these data results in powerful neural networks that generalize to a landscape of unseen MRI contrasts, eliminating the need for retraining.
Figure 4. Robustness to moving-image MRI contrast across 10 realistic A spoiled gradient-echo and B MPRAGE image pairs. In each cross-subject registration, the fixed image has consistent T1w contrast. Towards the right, the T1-contrast weighting of the moving image increases. Our method (sm) remains robust while most others break down, including VoxelMorph (vm). As errors are comparable across methods, we show error bars for ANTs only and indicate the standard error of the mean over subjects.
Figure 3. Image synthesis from random shapes (top) or, if available, from brain segmentations (bottom). We generate a pair of label maps {sm,sf} and from them images {m,f} with arbitrary contrast. The registration network then predicts the displacement u. In practice, we generate {sm,sf} from separate subjects if anatomical labels maps are used. We emphasize that no acquired images are involved.
Image domain Deep-SLR for Joint Reconstruction-Segmentation of Parallel MRI
Aniket Pramanik1 and Mathews Jacob1 1Electrical and Computer Engineering, The University of Iowa, Iowa City, IA, United States
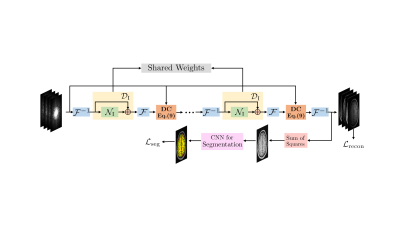
We propose a joint reconstruction-segmentation framework for calibration-free Parallel MRI. It consists of a novel image domain deep structured low-rank network for calibration-less PMRI cascaded with a segmentation network to reduce segmentation errors due to undersampling artifacts.
Proposed I-DSLR-SEG-E2E network architecture. A K-iteration I-DSLR network is cascaded with a CNN for segmentation. It is trained end-to-end.
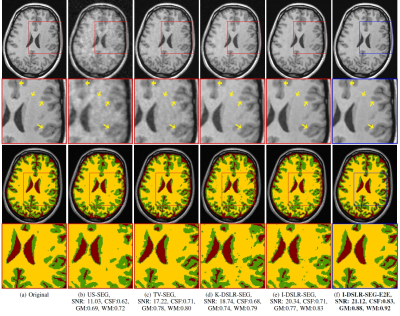
Comparison of reconstruction and segmentation quality of various methods on 6-fold undersampled k-space measurements. Reconstruction SNR in dB along with dice coefficients for CSF, GM and WM are reported for the particular slice. The
methods in red box typically cascade separately trained tasks and the blue one is the proposed end-to-end training approach.
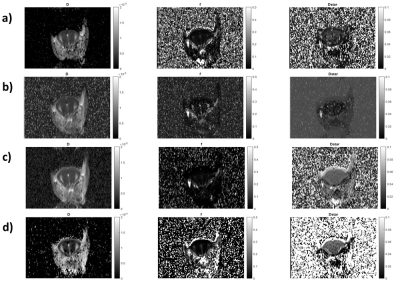
MRI-Based Response Prediction to Immunotherapy of Late-Stage Melanoma Patients Using Deep Learning
Annika Liebgott1,2, Louisa Fay1, Viet Chau Vu2, Bin Yang1, and Sergios Gatidis2 1Institute of Signal Processing and System Theory, University of Stuttgart, Stuttgart, Germany, 2Department of Radiology, University Hospital of Tuebingen, Tuebingen, Germany
Immunotherapy is a promising approach to treat advanced malignant melanoma. However, not every patient responds to it, i.e. in the worst case crucial time is wasted. Our research hence focuses on methods to early assess individual therapy response from PET/MR images using deep learning models.
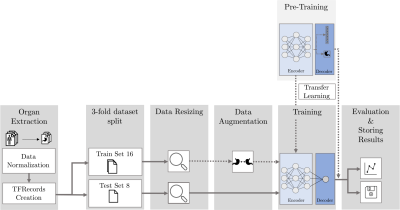
Figure 3:
Pipeline
of our deep
learning
framework. Preprocessing
of the data consists of organ segmentation, followed by data
normalization and creation of TFRecords for efficient data
processing, which are then split into training and test data and
resized such that all images have the same size. The
modular design allows to choose arbitrary deep learning models
to investigate different network architectures. Dashed
lines mark optional modules (data
augmentation, transfer learning). As data
augmentation, we implemented random rotation,
random shift and elastic
deformation9.
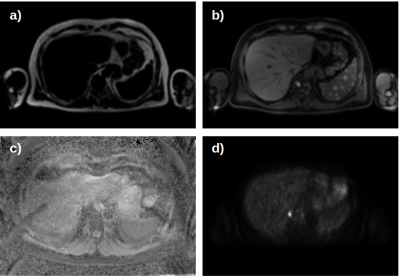
Figure 1: Exemplary abdominal slices
of one examination: images with fat (a) and water weighted (b) Dixon
sequences, ADC map (c) and PET image (d) were
acquired.
For
each patient, examinations
have been conducted
prior
to, two weeks and two months after starting immunotherapy.
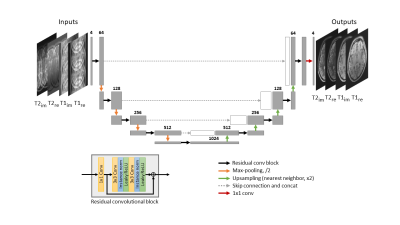
Jonas Denck1,2,3, Jens Guehring3, Andreas Maier1, and Eva Rothgang2 1Pattern Recognition Lab, Department of Computer Science, Friedrich-Alexander University Erlangen-Nürnberg, Erlangen, Germany, 2Department of Industrial Engineering and Health, Technical University of Applied Sciences Amberg-Weiden, Weiden, Germany, 3Siemens Healthcare, Erlangen, Germany
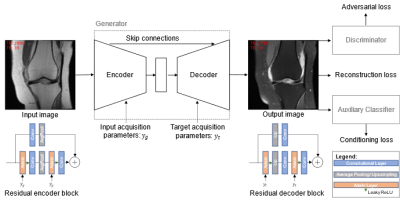
We trained an image-to-image generative adversarial network, conditioned on the important acquisition parameters echo time and repetition time, to synthesize fat-saturated MR knee images from non-fat-saturated images, enabling us to synthesize MR images with varying image contrast.
Figure 1:
Training procedure of the GAN. The generator consists of a U-Net architecture
of residual blocks with adaptive instance normalization layers that inject the
input acquisition parameters (yg) in the
encoder part of the generator and the output target labels (yt) in the
decoder part of the generator.
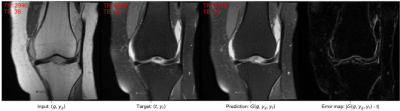
Figure 2: Example pair of ground truth input image g with its labels yg and the corresponding fat-saturated target
image t with its labels
yt. The
generator is trained to predict the target contrast from the input image and
the corresponding input and target acquisition parameters: G(g, yg, yt). The last
image shows the absolute error map of target and prediction. The images are
annotated with the real acquisition parameters TR and TE and the acquisition
parameters as predicted by the AC for G(g, yg, yt)
.
Image Registration of Perfusion MRI Using Deep Learning Networks
Zongpai Zhang1, Huiyuan Yang1, Yanchen Guo1, Lijun Yin1, David C. Alsop2, and Weiying Dai1 1State University of New York at Binghamton, Binghamton, NY, United States, 2Beth Israel Deaconess Medical Center & Harvard Medical School, Boston, MA, United States
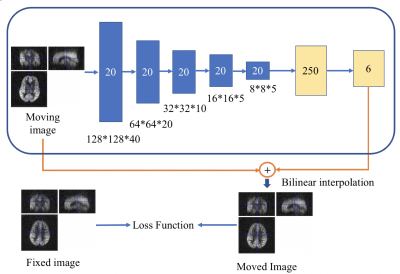
We designed an affine registration network (ARN) to explore its feasibility on image registration of perfusion fMRI. The results demonstrated that our ARN markedly outperforms the iteration-based SPM algorithm both in simulated and real data.
Figure 1. The ARN (CNN + FCN) architecture for image registration. The input layer took the moving image (128x128x40 matrix) as an input, 20 channels were used for the 5 CNN layers. Six parameters that contain x, y, z shifts, and x, y, z rotations were generated after the 2 FCN layers. Bilinear interpolation was used to obtain the moved image by applying 6 parameters to the moving image. The ARN was trained to minimize the loss function, which included the MSE loss, pixel-wise L1 loss, and SSIM loss between the fixed and moved images.
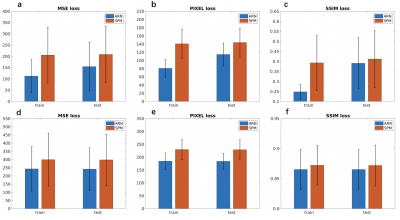
Figure 2. Comparison of loss between ARN and SPM registration. (a) MSE loss, (b) Pixel-wise L1 loss, (c) SSIM loss using simulated perfusion data, and (d)MSE loss, (e) Pixel-wise L1 loss, (f) SSIM loss using real perfusion data were compared between ARN and SPM registration.
Multidimensional analysis and detection of informative features in diffusion MRI measurements of human white matter
Adam C Richie-Halford1, Jason Yeatman2, Noah Simon3, and Ariel Rokem4 1eScienceInstitute, University of Washington, Seattle, WA, United States, 2Graduate School of Education and Division of Developmental and Behavioral Pediatrics, Stanford University, Stanford, CA, United States, 3Department of Biostatistics, University of Washington, Seattle, WA, United States, 4Department of Psychology, University of Washington, Seattle, WA, United States
We introduce a novel method for analysis of diffusion MRI (dMRI) tractometry data, based on grouped penalized regression, that provides both accurate prediction of phenotypic information and results that are readily interpretable.
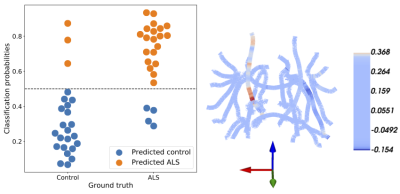
Figure 2: SGL accurately predicts ALS. Left: classification probabilities for each
subject’s ALS diagnosis. Controls are on the left, patients are on the right, predicted controls are in blue, and predicted patients are in orange. The SGL algorithm achieves 86% accuracy. Right: SGL coefficients are presented on a skeleton of the major white matter fiber tracts. The
brain is oriented with the right hemisphere to our left and anterior out of the page. As
expected large coefficients are in the fractional anisotropy of the corticospinal tract.
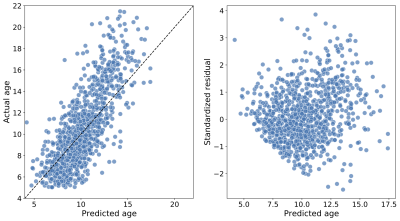
Figure 4: Predicting age in the Healthy Brain Network, a large pediatric neuroimaging study. Left: The predicted age of each individual (on the abscissa) and true age (on the ordinate), from the test splits (i.e., when each subject’s data was held out in fitting the model); an accurate prediction falls close to the $$$y = x$$$ line (dashed). The mean absolute error in this case is 1.5 years and R2 = 0.56. Right: Standardized residuals (on the abscissa) as a function of the true age (on the ordinate). Predictions are generally more accurate for younger individuals.
A Deep k-means Based Tissue Extraction from Reconstructed Human Brain MR Image
Madiha Arshad1, Mahmood Qureshi1, Omair Inam1, and Hammad Omer1 1Medical Image Processing Research Group (MIPRG), Department of Electrical and Computer Engineering, COMSATS University, Islamabad, Pakistan
The
proposed Deep k-means can accurately extract tissues from the human brain
images reconstructed from the acquired highly under-sampled data. Moreover, the
proposed method reduces the computational burden by avoiding the tedious job of
creating accurate segmentation masks.
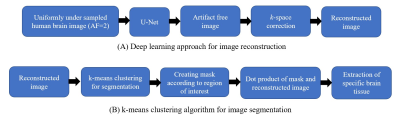
Figure 1: Block diagram of the proposed method: A Deep k-means Based Tissue Extraction from the reconstructed Human Brain MR Image. (A) shows the deep learning approach for image reconstruction and (B) shows the k-means clustering algorithm used for the brain tissue extraction.
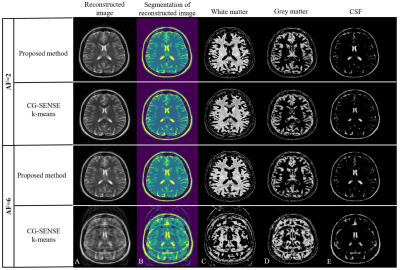
Figure
3: Results obtained from the proposed Deep k-means and CG-SENSE
k-means: (A) shows the reconstruction results obtained from U-Net and CG-SENSE,
(B) shows the segmentation results obtained from k-means clustering algorithm. (C-E)
show the extracted white matter, gray matter and CSF from the proposed method and
CG-SENSE k-means.
Unsupervised reconstruction based anomaly detection using a Variational Auto Encoder
Soumick Chatterjee1,2,3, Alessandro Sciarra1,4, Max Dünnwald3,4, Shubham Kumar Agrawal3, Pavan Tummala3, Disha Setlur3, Aman Kalra3, Aishwarya Jauhari3, Steffen Oeltze-Jafra4,5,6, Oliver Speck1,5,6,7, and Andreas Nürnberger2,3,6 1Department of Biomedical Magnetic Resonance, Otto von Guericke University, Magdeburg, Germany, 2Data and Knowledge Engineering Group, Otto von Guericke University, Magdeburg, Germany, 3Faculty of Computer Science, Otto von Guericke University, Magdeburg, Germany, 4MedDigit, Department of Neurology, Medical Faculty, University Hopspital, Magdeburg, Germany, 5German Centre for Neurodegenerative Diseases, Magdeburg, Germany, 6Center for Behavioral Brain Sciences, Magdeburg, Germany, 7Leibniz Institute for Neurobiology, Magdeburg, Germany
The preliminary results
indicate that the approach was able to segment candidate anomalous regions while
it tends to generate false positives. However, it might be a beneficial tool
which can be used to support interactive decision making.
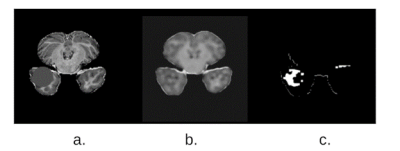
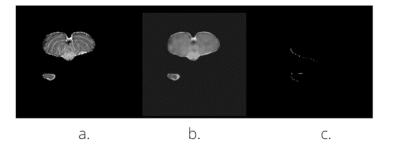
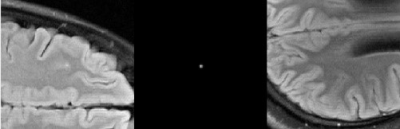
Fig 3. (a) Anomalous MOOD validation data (b) Model does not reconstruct the anomaly in
the output (c) Mask representing the difference between the input
image and the reconstructed image, indicating
the presence of an anomaly or out of distribution
sample in the input image. By morphological
closing along with binary thresholding,
the edges of the anomaly are detected and hence localized
Fig 2. (a) Non-anomalous MOOD data which is
the input to our model (b) Reconstructed image
obtained as the output of our model (c) Mask
representing the difference between the input
image and the reconstructed image, with 0
value indicating no anomaly or out of distribution
sample in the input image.
Interpretability Techniques for Deep Learning based Segmentation Models
Soumick Chatterjee1,2,3, Arnab Das3, Chirag Mandal3, Budhaditya Mukhopadhyay3, Manish Vipinraj3, Aniruddh Shukla3, Oliver Speck1,4,5,6, and Andreas Nürnberger2,3,6 1Department of Biomedical Magnetic Resonance, Otto von Guericke University, Magdeburg, Germany, 2Data and Knowledge Engineering Group, Otto von Guericke University, Magdeburg, Germany, 3Faculty of Computer Science, Otto von Guericke University, Magdeburg, Germany, 4German Centre for Neurodegenerative Diseases, Magdeburg, Germany, 5Leibniz Institute for Neurobiology, Magdeburg, Germany, 6Center for Behavioral Brain Sciences, Magdeburg, Germany
Preliminary studies based on DS6 model indicate
that our approaches are able to showcase the focus areas of the network. Furthermore,
the method helps to identify the individual focus areas of each network layer separately.
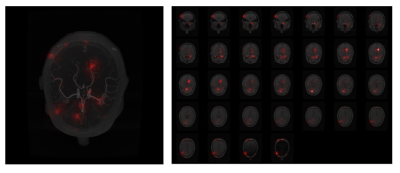
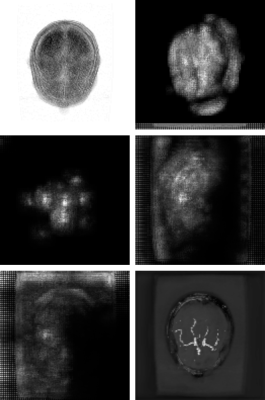
Fig.4: Maximum intensity projection and a montage of slices for the Interpretability result using Integrated Gradients, overlaid on the input volume. White pixels were converted to red for overlaying
Fig.5: Maximum intensity projection of layer-wise activations, generated using Guided Backpropogation. From left to right, top to bottom: initial layer of the network to the final layer, and finally the output from the model
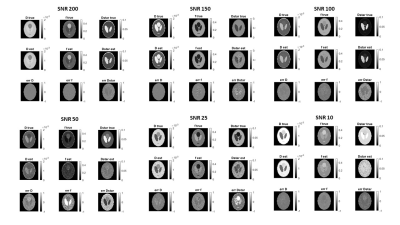
A Supervised Artificial Neural Network Approach with Standardized Targets for IVIM Maps Computation
Alfonso Mastropietro1, Daniele Procissi2, Elisa Scalco1, Giovanna Rizzo1, and Nicola Bertolino2 1Istituto di Tecnologie Biomediche, Consiglio Nazionale delle Ricerche, Segrate, Italy, 2Radiology, Northwestern University, Chicago, IL, United States
Fitting the IVIM bi-exponential
model is challenging especially at low SNRs and time consuming. In this work we
propose a supervised artificial neural network approach to obtain reliable
parameters estimation as demonstrated in both simulated data and real
acquisition.
Fig.1: The image shows a representative examples of D, f and D* maps for each SNRs, in simulations, generated with our neural network model and their
respective ground-truth images.
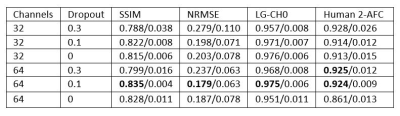
Task Performance or Artifact Reduction? Evaluating the Number of Channels and Dropout based on Signal Detection on a U-Net with SSIM Loss
Rachel E Roca1, Joshua D Herman1, Alexandra G O'Neill1, Sajan G Lingala2, and Angel R Pineda1 1Mathematics Department, Manhattan College, Riverdale, NY, United States, 2Roy J. Carver Department of Biomedical Engineering, University of Iowa, Iowa City, IA, United States
Choosing
the parameters of a neural network for image reconstruction based on the
detection of signals may lead to artifacts which are not acceptable. Task-based optimization may not align with
artifact minimization.
Figure 4. Sample
2AFC trial for network with 64 channels and 0.3 dropout including artifacts
which do not affect the detection task.
The artifacts may be hyper-enhanced features of the true image.
Table 1. Results for the combinations of initial number
of channels and amount of dropout. The
choice that did consistently well across all metrics we considered was 64
channels with 0.1 dropout but the network with 64 channels and 0.3 dropout has very
similar human observer performance. All networks perform similarly for human
detection except for the network with 64 channels and 0 dropout. We also see that the approximation to the
ideal observer (LG-CHO) performs similarly except for the networks with 32
channels and 0.3 dropout and 64 channels and 0 dropout.
Deep Learning for Automated Segmentation of Brain Nuclei on Quantitative Susceptibility Mapping
Yida Wang1, Naying He2, Yan Li2, Yi Duan1, Ewart Mark Haacke2,3, Fuhua Yan2, and Guang Yang1 1East China Normal University, Shanghai Key Laboratory of Magnetic Resonance, Shanghai, China, 2Department of Radiology, Ruijin Hospital, Shanghai Jiao Tong University School of Medicine, Shanghai, China, 3Department of Biomedical Engineering, Wayne State University, Detroit, MI, United States
A
deep learning method was proposed to automatically segment brain nuclei including
caudate nucleus, globus pallidus, putamen, red nucleus, and substantia nigra on
QSM data. The trained network could accurately segment brain nuclei regions.
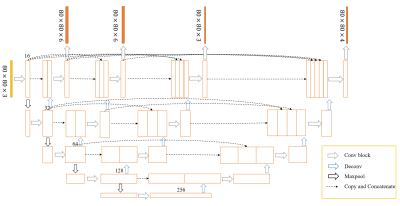
Figure
1. The architecture of deep supervision
U-net++. U-net++ consists of an encoder and decoder path that are connected
with nested and dense skip connections.
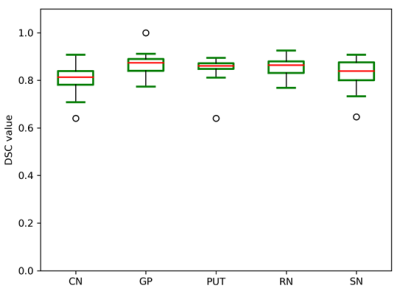
Figure 2. The distribution of the Dice coefficient (DSC)
values for the automatic segmentation results of CN, GP, PUT, RN, and SN regions.
Task-Based Assessment for Neural Networks: Evaluating Undersampled MRI Reconstructions based on Signal Detection
Joshua D Herman1, Rachel E Roca1, Alexandra G O'Neill1, Sajan G Lingala2, and Angel R Pineda1 1Mathematics Department, Manhattan College, Riverdale, NY, United States, 2Roy J. Carver Department of Biomedical Engineering, University of Iowa, Iowa City, IA, United States
Task-based
assessment of image quality for signal detection by humans for neural network
reconstructions leads to a different choice of undersampling than SSIM, NRMSE
or ideal observers.
Figure 3. Sample
2AFC trial where a subject chooses which of the two images contains the signal
in the middle. Each of the 4 observers conducted 200 trials for each amount of undersampling.
Figure 2.
U-Net Diagram. For this study x = 64
channels and a 0.1 dropout was used.
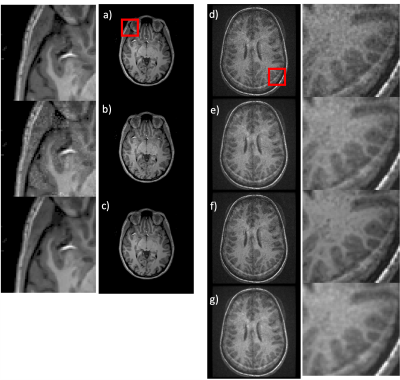
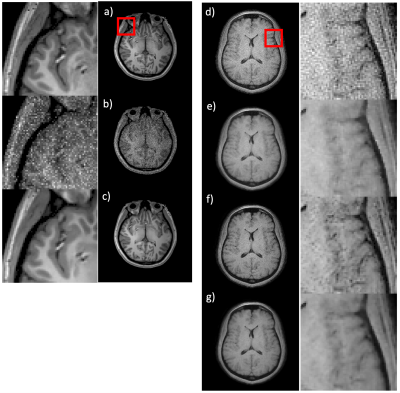
Sairam Geethanath1, Pavan Poojar1, Keerthi Sravan Ravi1, and Godwin Ogbole2 1Columbia University, New York, NY, United States, 2Department of Radiology, University College Hospital(UCH) Ibadan, Ibadan, Nigeria
We used native noise structure and level to denoise three different MR data types (T1w and T2w at 3T, T1w at 0.36T) with a peak signal-to-noise ratio greater than 38 dB for training and an image entropy greater than 4.25 for testing with no reference images.
Fig. 4 Denoising low field T1-weighted images: Training (a-c) - a) a representative image used as the gold standard for training; b) noise added image used for the training; c) the output of the native noise denoising network (NNDnet). The corresponding magnified images are shown on the left for the red square shown in a). Testing (d-g) - d) a representative 0.36T noisy image e) gradient anisotropy diffusion denoised (AD) result that is blurry; f) NNDnet denoised image; g) NNDnet + AD denoised image. The right column contains corresponding magnified images
Fig. 2 Denoising tailored MR Fingerprinting (TMRF): Training (a-c) - a) a T1-weighted image from the human connectome database; b) extracted noise from the TMRF data added for training; c) corresponding native noise denoising network (NNDnet) result. The left column shows the corresponding magnified images for the red square shown in a). Testing (d-g) - d) a test TMRF T1 image that suffers from noise e) corresponding gradient anisotropy diffusion denoised (GADD) result; f) NNDnet denoised image; g) NNDnet + GADD denoised image; corresponding magnified images on the right.
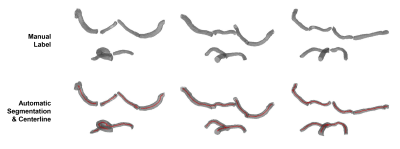
A fully automated framework for intracranial vessel wall segmentation based on 3D black-blood MRI
Jiaqi Dou1, Hao Liu1, Qiang Zhang1, Dongye Li2, Yuze Li1, Dongxiang Xu3, and Huijun Chen1 1Center for Biomedical Imaging Research, School of Medicine, Tsinghua University, Beijing, China, 2Department of Radiology, Sun Yat-Sen Memorial Hospital, Sun Yat-Sen University, Guangzhou, China, 3Department of Radiology, University of Washington, Seattle, WA, United States
This study proposed a fully automated vessel wall
segmentation framework for intracranial arteries using only 3D black-blood MRI,
and it achieved high segmentation performance
for both normal (DICE=0.941) and stenotic (DICE=0.922) arteries.
Figure 2
Three
examples
of the 3D lumen segmentation results with the manual labels as reference. An automatic skeletonization algorithm was used on the predicted
binary segmentation to extract the centerline (Red lines) of the intracranial
arteries.
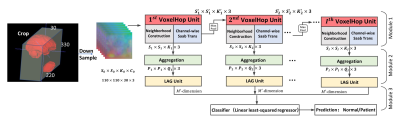
Successive Subspace Learning for ALS Disease Classification Using T2-weighted MRI
Xiaofeng Liu1, Fangxu Xing1, Chao Yang2, C.-C. Jay Kuo3, Suma Babu4, Georges El Fakhri1, Thomas Jenkins5, and Jonghye Woo1 1Gordon Center for Medical Imaging, Department of Radiology, Massachusetts General Hospital, Harvard Medical School, Boston, MA, United States, 2Facebook AI, Boston, MA, United States, 3Department of Electrical and Computer Engineering, University of Southern California, Los Angeles, CA, United States, 4Sean M Healey & AMG Center for ALS, Department of Neurology, Massachusetts General Hospital, Harvard Medical School, BOSTON, MA, United States, 5Sheffield Institute for Translational Neuroscience, University of Sheffield, Sheffield, United Kingdom
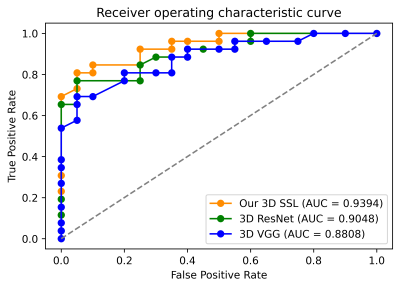
Our successive subspace learning approach,
using a total of 20 controls and 28 patients, achieved an accuracy of 93.48% in
differentiating ALS patients from controls, showing its robustness and
accuracy, compared with the state-of-the-art 3D CNN classification methods.
Illustration of the proposed VoxelHop framework. Deformation fields
within the whole brain and tongue derived from registration between all
subjects and the atlas are input into our framework.
Comparison of the receiver operating characteristic curve between our SSL-based VoxelHop framework and the comparison methods including 3D VGG and 3D ResNet.
PU-NET: A robust phase unwrapping method for magnetic resonance imaging based on deep learning
Hongyu Zhou1, Chuanli Cheng1, Xin Liu1, Hairong Zheng1, and Chao Zou1 1Shenzhen Institutes of Advanced Technology, Chinese Academy of Sciences, Shenzhen, China
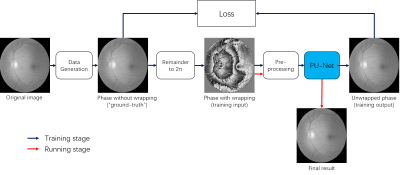
This work proposed a robust MR phase
unwrapping method based on a deep-learning method. Through comparisons of MR
phase-factor images over the entire body, the model showed promising
performances in both unwrapping errors and computation times. Therefore, it has
promise in applications that use MR phase information.
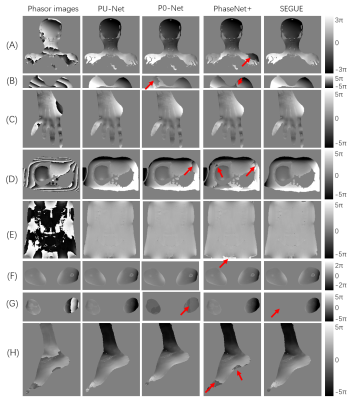
Fig. 5. Comparison of the four methods using the
phase factor (phasor) images (First column) of (A) brain & neck (coronal);
(B) breast (transverse); (C) hand (coronal); (D) upper abdomen (transverse);
(E) lower abdomen and pelvis (coronal); (F) thighs (transverse); (G) calves
(transverse); (H) ankle (sagittal). Red arrows indicate the unsolved regions.
Color bars of the unwrapped phase images are shown on the right side.
Figure 1: the
unsupervised network architecture of the proposed method
Using uncertainty estimation to increase the robustness of bone marrow segmentation in T1-weighted Dixon MRI for multiple myeloma
Renyang Gu1, Michela Antonelli1, Pritesh Mehta 2, Ashik Amlani 3, Adrian Green3, Radhouene Neji 4, Sebastien Ourselin1, Isabel Dregely1, and Vicky Goh1 1School of Biomedical Engineering & Imaging Sciences, King's College London, London, United Kingdom, 2Biomedical Engineering and Medical Physics, University College London, London, United Kingdom, 3Radiology, Guy’s and St Thomas’ Hospitals, London, United Kingdom, 4Siemens Healthcare Limited, Frimley, United Kingdom
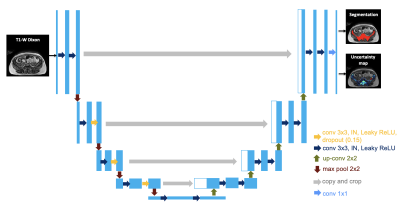
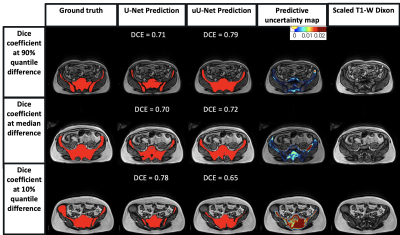
An uncertainty-aware 2D U-Net for skeletal marrow segmentation compensated for noisy ground-truth labels and improved network performance, particularly for vertebral and pelvic segmentation.
Figure 1. uU-Net architecture. Conv: convolution. IN: instance normalization. ReLU: rectified Linear Unit.
Figure 3. Representative pelvic MR images of three patients with generated overlays.
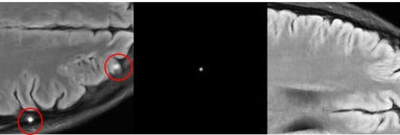
Deep Learning Pathology Detection from Extremely Sparse K-Space Data
Linfang Xiao1,2, Yilong Liu1,2, Zheyuan Yi1,2,3, Yujiao Zhao1,2, Peiheng Zeng1,2, Alex T.L. Leong1,2, and Ed X. Wu1,2 1Laboratory of Biomedical Imaging and Signal Processing, The University of Hong Kong, Hong Kong, China, 2Department of Electrical and Electronic Engineering, The University of Hong Kong, Hong Kong, China, 3Department of Electrical and Electronic Engineering, Southern University of Science and Technology, Shenzhen, China
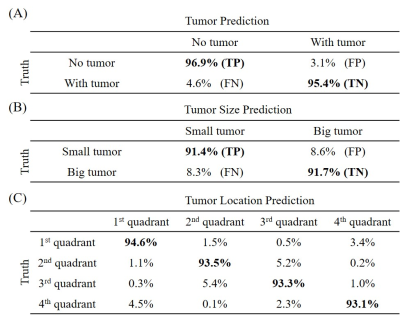
This study presents a new MR
diagnostic paradigm where pathology detection is performed directly from
extremely sparse k-space data and provides an extremely rapid and potentially
powerful tool for automatic pathology screening.
Figure 3. ANN prediction results from a single-shot spiral trajectory with 251 points for (A) tumor
detection, (B) tumor size
classification, and (C) tumor
location classification.
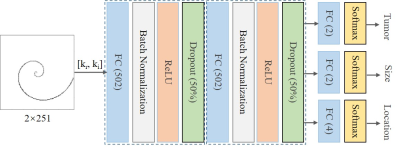
Figure 2. The
proposed ANN model structure for tumor detection, and size/location
classification. The model input is a vector concatenated by the real and
imaginary part of the complex k-space data, outputting three categories of
probabilities. Three tasks share the first two fully connected layers (FC), and
each FC is followed by a batch normalization layer, a rectified linear unit
(ReLU) layer and a dropout layer (50%). Each task has its own fully connected
layer and softmax layer for classification. Noted that tumor size/location is
only classified in presence of tumors.
Development of a Deep Learning MRI Phase Unwrapping Technique Using an Exact Unwrap-Rewrap Training Model
Rita Kharboush1, Anita Karsa1, Barbara Dymerska1, and Karin Shmueli1 1Medical Physics and Biomedical Engineering, University College London, London, United Kingdom
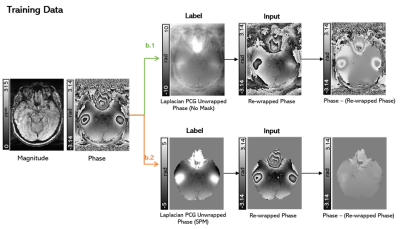
This novel, exact
model of phase unwrapping can be used to train any neural network. Networks
trained using masked (and unmasked) images showed unwrapping performance
similar to state-of-the-art SEGUE phase unwrapping on test brain images and
showed some generalisation to pelvic images.
Training strategy. An
axial slice of a representative image is shown unmasked (b.1) and masked (b.2).
In all cases the label (or ground truth image) was the Laplacian PCG unwrapped
phase, and the input was the rewrapped phase of the label such that the label
was the exact unwrapping solution of the label. Differences can be seen between
the raw and the rewrapped phase images.
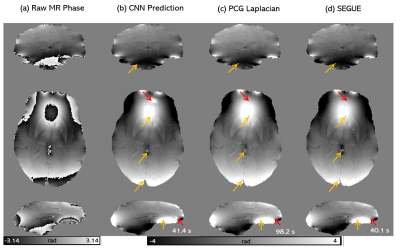
The
CNN unwrapping performance on raw phase images. A coronal, axial and sagittal
slice of the raw phase (a) and phase unwrapping solutions using the masked CNN
(b), Iterative Laplacian PCG (c) and SEGUE (d) for a representative healthy volunteer
in vivo. The computation times are shown below. Red arrows indicate where the Laplacian
or SEGUE solutions appear more accurate than the CNN. The yellow arrows
indicate where the CNN was more accurate.
Improving ASL MRI Sensitivity for Clinical Applications Using Transfer Learning-based Deep Learning
Danfeng Xie1, Yiran Li1, and Ze Wang1 1Department of Diagnostic Radiology and Nuclear Medicine, University of Maryland School of Medicine, Baltimore, MD, United States
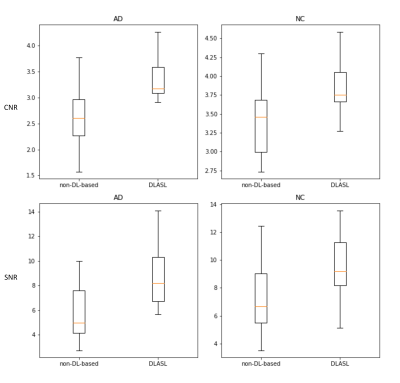
This study represents the first effort to apply transfer learning of Deep learning-based ASL denoising (DLASL) method on clinical ASL data. Experimental results demonstrated the high transfer capability of DLASL for clinical studies.
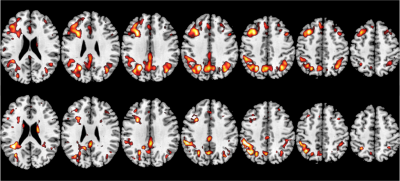
Figure 4: The resulting T map of two-sample T-test (AD vs NC). The top row shows the results obtained by DLASL. The bottom row shows the results obtained by the non-DL-based conventional processing method[5]. From left to right: slices 95, 100, 105, 110, 115, 120 and 125. Display window: 4-6. P-value threshold is 0.001
Figure 3: The box plot of the CNR (top row) and SNR (bottom row) from 21 AD subjects' CBF maps and 24 NC subjects' CBF maps with different processing methods.
Fully-Automated Deep Learning-Based Background Phase Error Correction for Abdominopelvic 4D Flow MRI
Sophie You1, Evan M. Masutani1, Joy Liau2, Marcus T. Alley3, Shreyas S. Vasanawala3, and Albert Hsiao2 1School of Medicine, University of California, San Diego, La Jolla, CA, United States, 2Department of Radiology, University of California, San Diego, La Jolla, CA, United States, 3Department of Radiology, Stanford University School of Medicine, Stanford, CA, United States
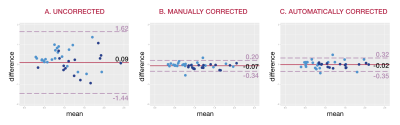
Using a multichannel 3D convolutional neural network, we demonstrate the feasibility of automating background phase error correction in abdominopelvic 4D Flow MRI. Quantitative improvements in flow consistency are comparable to manual correction.
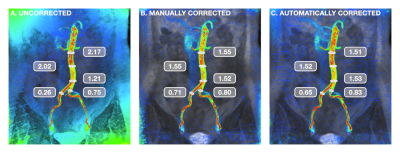
FIGURE 4: Visual example of background phase-error correction. Coronal view of the aorta and common iliac arteries during peak systole, with flow velocity represented by a colormap ranging from red (80 cm/s) to blue (0 cm/s). For assessment of flow continuity, measurements (in L/min) were taken at multiple locations. Corrected velocity measurements demonstrated improved consistency along the length of the infrarenal aorta as well as conservation of mass post-bifurcation.
FIGURE 5: Bland-Altman analysis. Consistency of flow measurements are shown for (a) uncorrected velocity data, (b) velocity data corrected manually, and (c) velocity data corrected automatically. Light blue points represent comparisons of arterial and venous flow, while dark blue points represent comparisons of flow before and after vessel bifurcation. Corrected measurements in (b) and (c) demonstrate greater consistency with narrower limits of agreement than seen in (a).
Deblurring of spiral fMRI images using deep learning
Marina Manso Jimeno1,2, John Thomas Vaughan Jr.1,2, and Sairam Geethanath2 1Columbia University, New York, NY, United States, 2Columbia Magnetic Resonance Research Center (CMRRC), New York, NY, United States
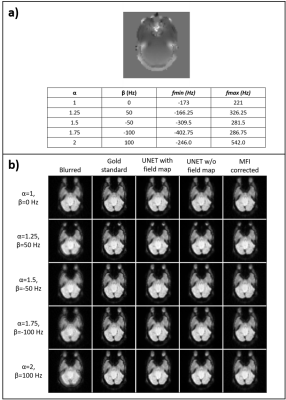
The proposed method for spiral deblurring of fMRI images outperforms MFI at various field inhomogeneity ranges with minimum SSIM of 0.97, pSNR greater than 35 dB, and HFEN smaller than 0.17 and does not require field map calibration.
Figure 2. Validation results. Field map augmentation modified the frequency range of each slice depending on the parameters 𝛼 and β. a) shows the different combinations for an example slice and the achieved frequency ranges. b) Image panel displaying the blurred image, gold standard, U-net correction with field map, U-net correction without field map, and MFI correction images.
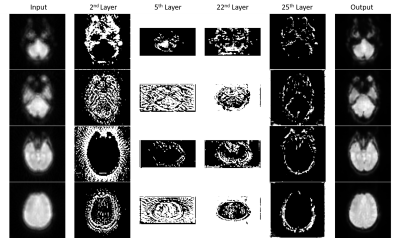
Figure 4. Filter visualization. Visualization of representative filters from the 2nd, 5th, 22nd, and 25th convolutional layers for four different brain slices from the testing dataset for model explainability.
Kehan Qi1, Yu Gong1,2, Haoyun Liang1, Xin Liu1, Hairong Zheng1, and Shanshan Wang1 1Paul C Lauterbur Research Center, Shenzhen Inst. of Advanced Technology, shenzhen, China, 2Northeastern University, Shenyang, China
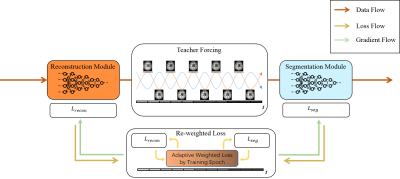
This study investigates task-driven MR imaging, which integrates the reconstruction with
segmentation and produces both promising reconstructed images and high-quality
segmented results.
Figure 1. The overall
workflow of the proposed task-driven MR imaging method, which consists of two key components (teacher forcing and re-weighted loss training schemes) and two
modules (reconstruction and segmentation modules).
Figure 3. Visualization of the
segmentation results of the proposed method compared with existing methods.
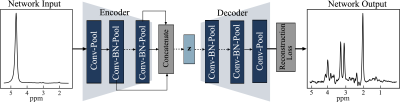
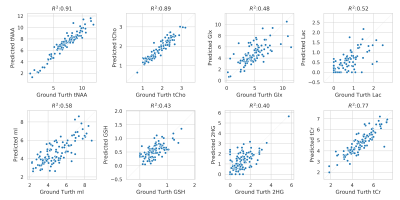
Quantification of Unsuppressed Water Spectrum using Autoencoder with Feature Fusion
Marcia Sahaya Louis1,2, Eduardo Coello2, Huijun Liao2, Ajay Joshi1, and Alexander P Lin2 1Boston University, Boston, MA, United States, 2Brigham and Women's hospital, Boston, MA, United States
We propose a deep convolutional autoencoder model with feature fusion for removal of water resonance from unsuppressed 97 ms water spectrum and reconstructs an intact metabolite spectrum.
Architecture of Autoencoder with Feature Fusion. The encoder and decoder each have eight convolutional (conv) layers with pooling and batch normalization (BN). Each conv layer had a kernel size of 9 and 16 filters and one fully connected layer with 1000 hidden units. The feature maps of all the layers in the encoder are concatenated using maximum pooling and passed to the latent vector (Z). Z is a fully connected layer with 128 hidden units with a linear activation function. All the layers in the model have a ReLU activation function, except the last layer has a tanh activation function.
Correlation of metabolite concentration obtained using LCModel, for AE predicted and water suppressed spectra for the in-vivo test dataset. The x-axis shows the absolute concentration values estimated from water suppressed spectra and y-axis shows the corresponding AE predicted spectra. Overall, there is a strong correlation between metabolite for tNAA, tCho, tCr and Glx, Lac, GSH, mI and 2HG has a decent correlation. The clustering pattern seen in other metabolites can be caused by reconstruction error and change in the degree of freedom of LCModel fit between the spectra.
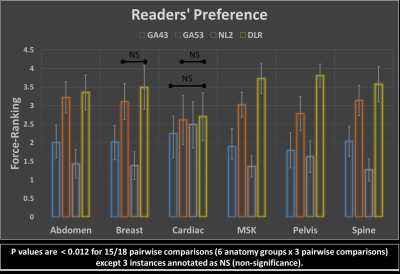
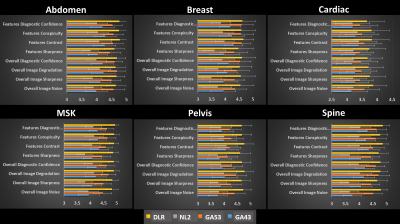
Prospective Performance Evaluation of the Deep Learning Reconstruction Method at 1.5T: A Multi-Anatomy and Multi-Reader Study
Hung Do1, Mo Kadbi1, Dawn Berkeley1, Brian Tymkiw1, and Erin Kelly1 1Canon Medical Systems USA, Inc., Tustin, CA, United States
In this randomized blinded multi-reader study, Deep Learning Reconstruction (DLR) was
shown to be well generalized to data prospectively acquired from 16 anatomies. Specifically, DLR was scored similar or statistically higher than the 3
conventional reconstruction methods compared.
Figure 5: Force-ranking summary. DLR’s average force-ranking score is
consistently higher than the other methods in all pairwise comparisons and in
all anatomy groups. DLR was rated statistically higher than the 3 counterparts
in 15/18 pairwise comparisons (p < 0.012) except the three instances annotated
by as NS (non-significance).
Figure 4: Average readers’ scores for 6 anatomy groups. DLR’s average
scores are consistently higher than those of the 3 other methods in 143/144 pairwise
comparisons (6 anatomy group x 8 criteria x 3 pairwise comparisons) except 1
instance, where DLR’s average score is smaller than that of GA53 by a margin less
than 1% (i.e. 4.63 for DLR vs. 4.67 for GA53). DLR is rated statistically
higher all other three methods (p < 0.017) in 134/144 pairwise
comparisons.
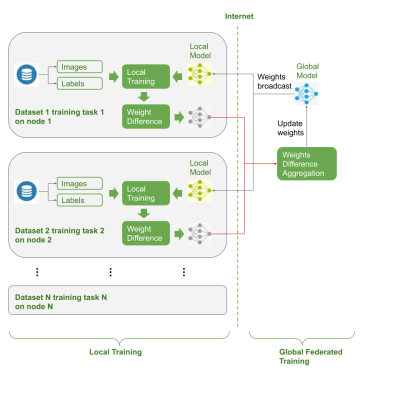
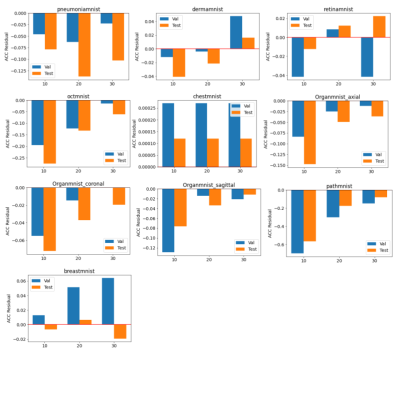
Federated Multi-task Image Classification on Heterogeneous Medical data with Privacy Perversing
Shenjun Zhong1, Adam Morris2, Zhaolin Chen1, and Gary Egan1 1Monash Biomedical Imaging, Monash University, Australia, Melbourne, Australia, 2Monash eResearch Center, Monash University, Australia, Melbourne, Australia
This work applied the multi-task learning process in federated learning settings, and validated the performance of the co-trained models that could be used for downstream medical image analysis tasks.
Figure 1. Federate Learning Workflow
Figure 3. ACC Comparison of Federated Trained Models with Baseline Models
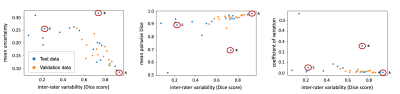
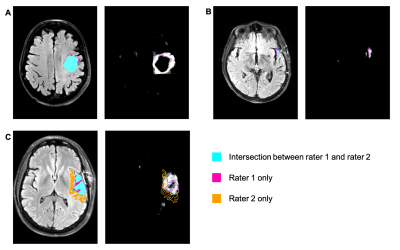
Do you Agree? An Exploration of Inter-rater Variability and Deep Learning Segmentation Uncertainty
Katharina Viktoria Hoebel1,2, Christopher P Bridge1,3, Jay Biren Patel1,2, Ken Chang1,2, Marco C Pinho1, Xiaoyue Ma4, Bruce R Rosen1, Tracy T Batchelor5, Elizabeth R Gerstner1,5, and Jayashree Kalpathy-Cramer1 1Athinoula A. Martinos Center for Biomedical Imaging, Boston, MA, United States, 2Harvard-MIT Division of Health Sciences and Technology, Cambridge, MA, United States, 3MGH and BWH Center for Clinical Data Science, Boston, MA, United States, 4Department of Magnetic Resonance, The First Affiliated Hospital of Zhengzhou University, Zhengzhou, China, 5Stephen E. and Catherine Pappas Center for Neuro-Oncology, Massachusetts General Hospital, Boston, MA, United States
We show that uncertainty metrics that are extracted from an MC
dropout segmentation model, trained on labels from only one rater, correlate
with the inter-rater variability. This enables the identification of cases that
are likely to exhibit a high disagreement between human raters in advance.
Figure 1: Correlation between the inter-rater Dice
score and uncertainty measures (pooled data from the validation and test
datasets). The marked test cases are shown in Figure 2.
Figure 2: Selected axial slices from three cases
(marked A, B, C in Figure 1). For each of the three cases, the left panel shows
an axial slice of the T2W-FLAIR image with the segmentation labels. The right
panel shows the corresponding uncertainty maps (brighter areas correspond to
higher uncertainty) illustrating areas of high and low uncertainty of the
segmentation model. Segmentation labels: turquoise: overlap between the labels
of rater 1 and 2; magenta: rater 1 only; orange: rater 2 only.
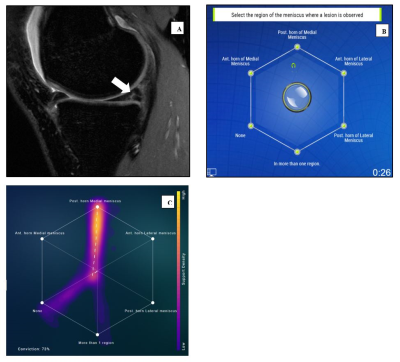
Swarm intelligence: a novel clinical strategy for improving imaging annotation accuracy, using wisdom of the crowds.
Rutwik Shah1, Bruno Astuto Arouche Nunes1, Tyler Gleason1, Justin Banaga1, Kevin Sweetwood1, Allen Ye1, Will Fletcher1, Rina Patel1, Kevin McGill1, Thomas Link1, Valentina Pedoia1, Sharmila Majumdar1, and Jason Crane1 1Department of Radiology and Biomedical Imaging, University of California San Francisco, San Francisco, CA, United States
Swarm predictions for both cohorts (radiologists and residents) were
closer to clinical ground truth, outperformed their own individually graded
labels and the AI predictions. Accuracy of resident performance also
improved with increase in swarm size (three versus five participants).
Figure 1: A) Sagittal cube sequences evaluated for meniscal lesions (arrow
pointing to post. horn tear in medial meniscus). B) Swarm platform interface
used to derive consensus grades for location of lesion. C) Visualization of the
trajectory of decision made by the swarm. While there were individually
divergent opinions, the eventual consensus of the group in this example was for
posterior horn of the medial meniscus.
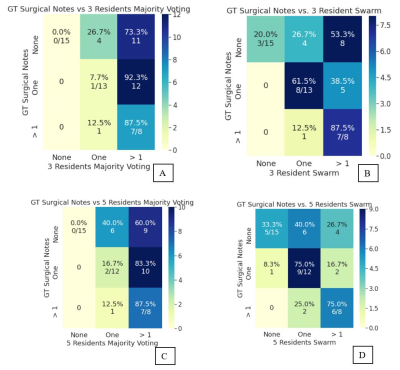
Figure 2: Resident
versus Ground truth (GT). A) Confusion matrix (CM) for 3 resident majority vote
vs GT (kappa: 0.01) B) CM for 3 resident swarm vs GT. Accuracy improves
compared to majority vote (kappa: 0.24) C) CM for 5 resident majority vote vs
GT (kappa: 0.05) D) CM for 5 resident swarm vs GT. Accuracy improves compared to
majority vote (kappa: 0.37).
Note: 5 resident swarm was unable to obtain a consensus on 1
exam, which was excluded during CM tabulation.
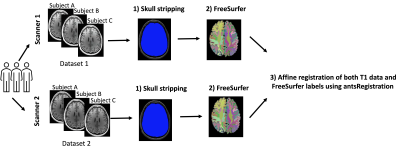
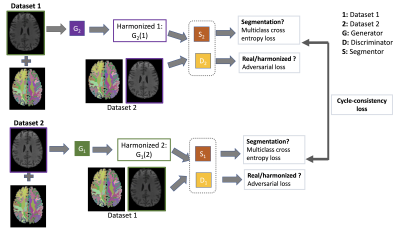
Harmonization of multi-site T1 data using CycleGAN with segmentation loss (CycleGANs)
Suheyla Cetin-Karayumak1, Evdokiya Knyazhanskaya2, Brynn Vessey2, Sylvain Bouix1, Benjamin Wade3, David Tate4, Paul Sherman5, and Yogesh Rathi1 1Brigham and Women's Hospital and Harvard Medical School, Boston, MA, United States, 2Brigham and Women's Hospital, Boston, MA, United States, 3Ahmanson-Lovelace Brain Mapping Center, UCLA, Los Angeles, CA, United States, 4University of Utah, Salt Lake City, UT, United States, 5U.S. Air Force School of Aerospace Medicine, San Antonio, TX, United States
While the Dice overlap score was
91% between datasets from two scanners prior to harmonization, the Dice score
increased to 98% after harmonization in subcortical regions. This result proves
the efficacy of our multi-site T1 data harmonization approach.
Figure 1. T1 data of 25 subjects were scanned using two
scanners. We refer to the T1 data from scanner 1 as dataset 1 and from scanner
2 as dataset 2. The data preprocessing steps included: 1) N4 bias field
correction and skull-stripping using our in-house software (https://github.com/pnlbwh/luigi-pnlpipe); 2) Creating label maps using FreeSurfer
v. 7.1.0; 3) Affine registration using antsRegistration.
Figure 2. The summary of our multi-site T1 data harmonization network:
CycleGAN with segmentation loss
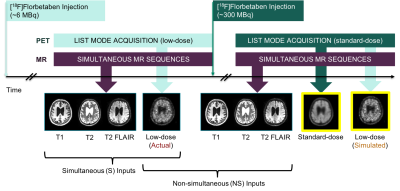
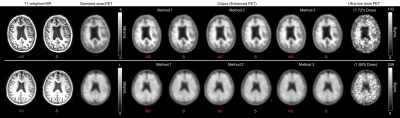
Does Simultaneous Morphological Inputs Matter for Deep Learning Enhancement of Ultra-low Amyloid PET/MRI?
Kevin T. Chen1, Olalekan Adeyeri2, Tyler N Toueg3, Elizabeth Mormino3, Mehdi Khalighi1, and Greg Zaharchuk1 1Radiology, Stanford University, Stanford, CA, United States, 2Salem State University, Salem, MA, United States, 3Neurology and Neurological Sciences, Stanford University, Stanford, CA, United States
In this study, we aim to investigate whether simultaneity is a requirement for using structural MRI inputs to enhance ultra-low-dose amyloid PET images in a deep neural network. This will increase the utility of ultra-low-dose PET by including data acquired on separate PET and MRI machines.
Figure 1. Sample ultra-low-dose protocol. The participants were scanned in two sessions and the two sets of MR images obtained from the sessions were used in separate neural network trainings to test the effect of simultaneous (S) vs. non-simultaneous (NS) inputs.
Figure 3. Representative amyloid PET images (top: amyloid negative, bottom: amyloid positive) with the corresponding T1 MR images. Both sets of CNN-enhanced ultra-low-dose PET images show greatly reduced noise compared to the ultra-low-dose PET image and resemble the standard-dose PET image. NS: non-simultaneous, S: simultaneous
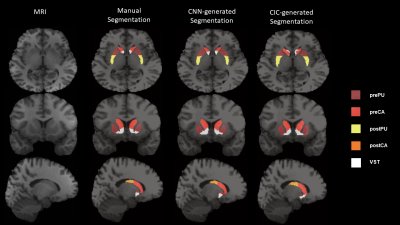
Multi-Task Learning based 3-Dimensional Striatal Segmentation of MRI – PET and fMRI Objective Assessment
Mario Serrano-Sosa1, Jared Van Snellenberg2, Jiayan Meng2, Jacob Luceno2, Karl Spuhler3, Jodi Weinstein2, Anissa Abi-Dargham2, Mark Slifstein2, and Chuan Huang2,4 1Biomedical Engineering, Stony Brook University, Stony Brook, NY, United States, 2Psychiatry, Renaissance School of Medicine at Stony Brook University, Stony Brook, NY, United States, 3Radiation Oncology, NYU Langone, New York, NY, United States, 4Radiology, Renaissance School of Medicine at Stony Brook University, Stony Brook, NY, United States
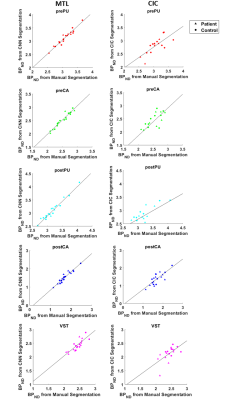
Multi-Task Learning provides reliable striatal subregion
segmentations with more comparable PET and fMRI results that closely match those obtained with manually drawn ROIs than atlas-based
segmentations
Figure 2.
Transverse (top), coronal (middle) and sagittal (bottom) views of T1-weighted
MR Image, overlaid with ROIs by manual segmentation, MTL-generated
segmentation, and CIC-generated segmentation. Transverse slices of manual
segmentation show postPU to have slightly irregular shape compared to a
smoother postPU in MTL-generated segmentation. Coronal and sagittal slices of
the MRI and manual segmentation also show VST to have irregular shape compared
to a smoothed and more circular VST in MTL-generated.
Figure 3. Scatter plots between BPND of the 5
subregions calculated using manual ROIs and both MTL- (left) and CIC-generated
(right) ROIs across 19 independent test subjects. Regression line for all
subregions is overlaid scatter plots, with regression coefficients found in
Table 2.
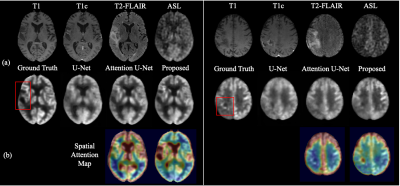
Jiahong Ouyang1, kevin Chen2, and Greg Zaharchuk2 1Electrical Engineering, Stanford University, Stanford, CA, United States, 2Department of Radiology, Stanford University, Stanford, CA, United States
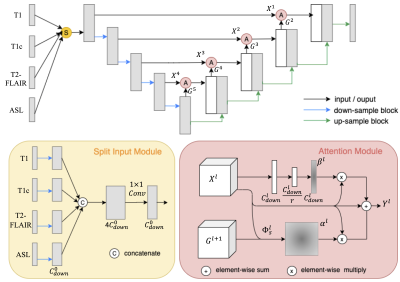
We synthesized high-quality FDG-PET brain images from multi-contrast MR images by a U-Net based network with attention modules. We demonstrated better performance to create FDG PET, broadening the potential value of MR to provide molecular imaging information without the use of radiation.
Figure 2. Qualitative Results of two representative slices. (a) Input MR images, ground truth PET images, and the
synthesized PET images by three methods. (b) Spatial attention map from Attention U-Net and the proposed method.
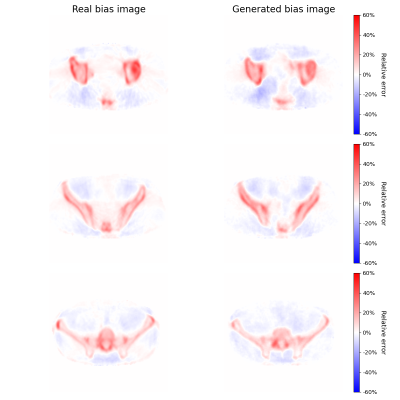
Bias correction for PET/MR attenuation correction using generative adversarial networks
Bendik Skarre Abrahamsen1, Tone Frost Bathen1,2, Live Eikenes1, and Mattijs Elschot1,2 1Department of Circulation and Medical Imaging, NTNU, Trondheim, Norway, 2Department of Radiology and Nuclear Medicine, St. Olavs Hospital, Trondheim University Hospital, Trondheim, Norway
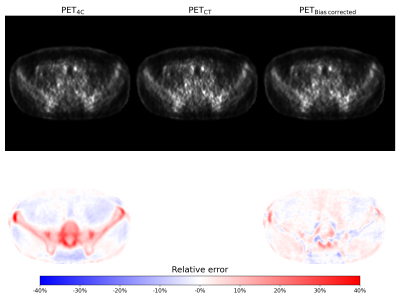
In PET/MR attenuation correction, direct estimation and correction for the bias between PET reconstructed with and without bone is a viable alternative to creating pseudo-CTs containing bone information.
Figure 4 Top row: PET image reconstructed using the 4-class
umap, 4-class umap with bone information from CT and 4-class umap and corrected
using the generated bias image from left to right. All images are scaled the same.
Below are the relative error of each PET image compared to the PET
image reconstructed using the CT enhanced umap.
Figure 3: Real bias images and bias images generated by the pix2pix network. The bias image values correspond to the real and generated relative error between the PET image reconstructed using the 4-class attenuation correction map and the PET image reconstructed using the 4-class attenuation correction map with added bone information from a co-registered CT image. The images are from
the hold-out test set.
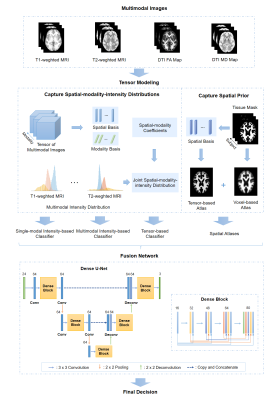
Multimodal Image Fusion Integrating Tensor Modeling and Deep Learning
Wenli Li1, Ziyu Meng1, Ruihao Liu1, Zhi-Pei Liang2,3, and Yao Li1 1School of Biomedical Engineering, Shanghai Jiao Tong University, Shanghai, China, 2Beckman Institute for Advanced Science and Technology, University of Illinois at Urbana-Champaign, Urbana, IL, United States, 3Department of Electrical and Computer Engineering, University of Illinois at Urbana-Champaign, Urbana, IL, United States
This paper presents a new method for multimodal
image fusion by integrating tensor modeling and deep learning. The proposed
method may prove useful for solving a range of multimodal brain image
processing problems.
Figure 1: Illustration of the proposed multimodal
fusion framework. The middle panel shows the tensor model-based joint
spatial-modality-intensity distribution and spatial prior representations. The bottom
panel shows the structure of the fusion network integrating the outputs from
different classifiers and spatial atlases.
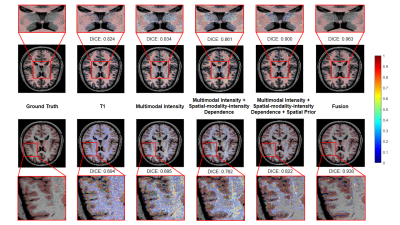
Figure 2: The performance comparison by
adding in each component in the proposed fusion framework. The segmentation
accuracy was improved with more features being added, which confirms the
advantage of capturing intensity-modality-spatial dependence information
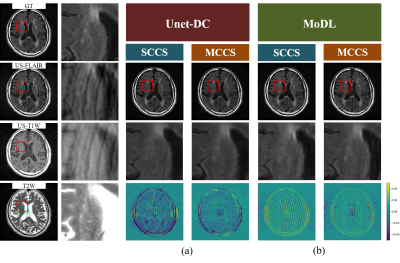
Multi-contrast CS reconstruction using data-driven and model-based deep neural networks
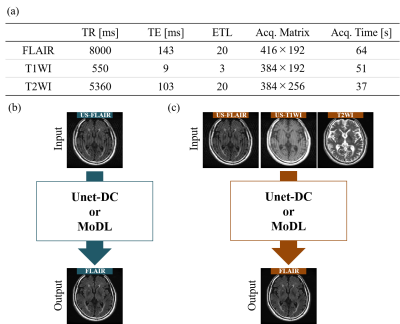
Tomoki Miyasaka1, Satoshi Funayama2, Daiki Tamada2, Utaroh Motosugi3, Hiroyuki Morisaka2, Hiroshi Onishi2, and Yasuhiko Terada1 1Institute of Applied Physics, University of Tsukuba, Tsukuba, Japan, 2Department of Radiology, University of Yamanashi, Chuo, Japan, 3Department of Radiology, Kofu-Kyoritsu Hospital, Kofu, Japan
We validated the usefulness of deep learning
based multi-contrast compressed sensing (MCCS) reconstruction, in which
multiple contrast images are used for compressed sensing (CS) reconstruction. Applied
to data-driven and model-based networks, MCCS outperformed single-contrast CS.
Fig. 2 Examples
of SCCS and MCCS results for AF = 2.
(a)
Unet-DC. (b) MoDL. The number of epochs in the training were 1 for SCCS and 5 for MCCS.
Fig.
1 Experimental
condition. (a) Acquisition
parameters. (b, c) Input/output images for (b) SCCS and (c) MCCS. US-FLAIR:
undersampled FLAIR, US-T1WI: undersampled T1-weighted image.
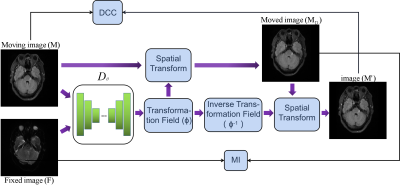
Unsupervised deep learning for multi-modal MR image registration with topology-preserving dual consistency constraint
Yu Zhang1, Weijian Huang1, Fei Li1, Qiang He2, Haoyun Liang1, Xin Liu1, Hairong Zheng1, and Shanshan Wang1 1Paul C Lauterbur Research Center, Shenzhen Inst. of Advanced Technology, shenzhen, China, 2United Imaging Research Institute of Innovative Medical Equipment, Shenzhen, China
Multi-modal magnetic resonance (MR) image registration is essential in the clinic.In this study, we propose a multi-modal MR image registration with topology-preserving dual consistency constraint, which achieves the best registration performance.
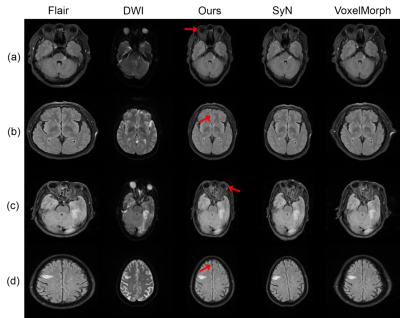
Fig.1. Overview of the method. Two images, including the moving FLAIR image(M) and the fixed DWI image(F), are input into Dθ to generate the transformation filed(φ). Dθ represent the registration network.
Fig.2.Qualitative registration results of different methods. The first two columns present the moving FLAIR images and the fixed DWI images with the annotated stroke lesions. The third columns show the registration results of our proposed method, and the rest columns are the results generated by the comparison algorithms.
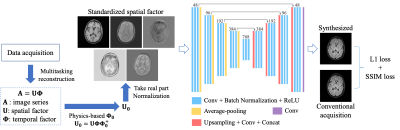
Direct Synthesis of Multi-Contrast Images from MR Multitasking Spatial Factors Using Deep Learning
Shihan Qiu1,2, Yuhua Chen1,2, Sen Ma1, Zhaoyang Fan1,2, Anthony G. Christodoulou1,2, Yibin Xie1, and Debiao Li1,2 1Biomedical Imaging Research Institute, Cedars-Sinai Medical Center, Los Angeles, CA, United States, 2Department of Bioengineering, UCLA, Los Angeles, CA, United States
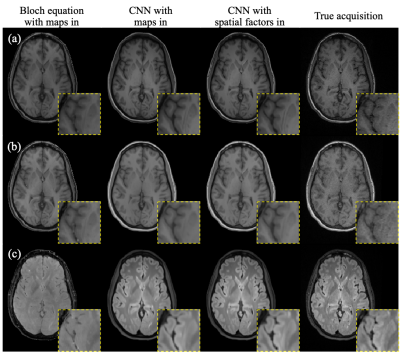
We developed a deep learning-based method to synthesize conventional weighted images from MR Multitasking spatial factors. It generates higher-fidelity weighted images than a Bloch equation-based approach and a deep learning method using quantitative maps as input.
Figure 1. Preprocessing of spatial factors and the proposed network architecture
Figure 2. An example case of synthetic images using different methods. (a) T1 MPRAGE, (b) T1 GRE, (c) T2 FLAIR.
Multi-sequence and multi-regional background segmentation on multi-centric DSC and DCE MRI using deep learning
Henitsoa RASOANANDRIANINA1, Anais BERNARD1, Guillaume GAUTIER1, Julien ROUYER1, Yves HAXAIRE2, Christophe AVARE3, and Lucile BRUN1 1Department of Research & Innovation, Olea Medical, La Ciotat, France, 2Clinical Program Department, Olea Medical, La Ciotat, France, 3Avicenna.ai, La Ciotat, France
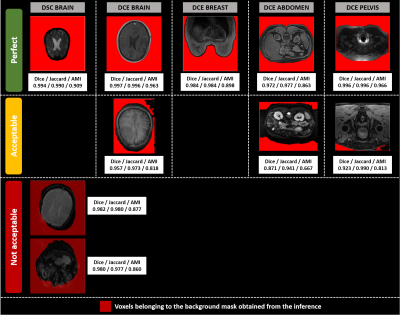
A
2D U-net model exhibits very good performances (median Dice: 0.979, median
inference duration: 0.15s per 3D volume) in background segmentation and removal on both DSC MRI data from the brain and DCE MRI data from brain, breast, abdomen, and pelvis regions.
Figure 2:Illustrations of background
segmentation results for the development database.
The columns display segmented slices per
modality and anatomical region, whereas the rows correspond to the 3 different
visual quality ratings (Perfect, Acceptable, Not acceptable). Dice, Jaccard and
AMI values for the 3D volume are reported under each slice. Only two DSC brain volumes
segmentations were found not acceptable.Their segmentations are displayed with transparency to show the underlying tissue.
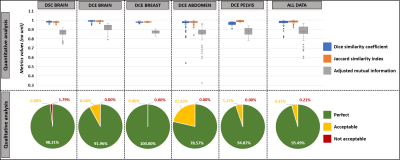
Figure 1:Background segmentation performances
in the development database.
Top: Quantitative results with values of Dice
coefficient (Dice), Jaccard similarity index (Jaccard), and adjusted
mutual information (AMI). Dice and Jaccard values range between [0-1], 1 means the two segmentations are identical. AMI values are <=1, 1 means the two clusters are identical.
Bottom: Qualitative (visual) evaluation of obtained segmentations with 3-stage rating: perfect, acceptable
(i.e. without tissue voxels removed) and not
acceptable (i.e. with tissue voxels removed) results.
Multi-Contrast MRI Reconstruction from Single-Channel Uniformly Undersampled Data via Deep Learning
Christopher Man1,2, Linfang Xiao1,2, Yilong Liu1,2, Vick Lau1,2, Zheyuan Yi1,2,3, Alex T. L. Leong1,2, and Ed X. Wu1,2 1Laboratory of Biomedical Imaging and Signal Processing, The University of Hong Kong, Hong Kong SAR, China, 2Department of Electrical and Electronic Engineering, The University of Hong Kong, Hong Kong SAR, China, 3Department of Electrical and Electronic Engineering, Southern University of Science and Technology, Shenzhen, China
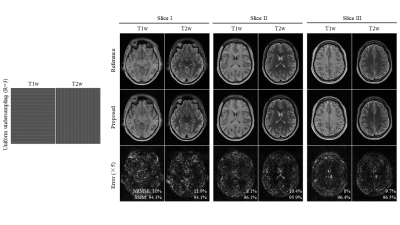
A deep
learning based multi-contrast MRI reconstruction was proposed for single-channel
multi-contrast MR data undersampled uniformly and orthogonally across different
contrasts, which can effectively remove the aliasing artifacts and preserve
structure details at R=4.
Figure 2 Multi-contrast reconstruction for multi-contrast MR data at R=3, clearly demonstrating the proposed model could reconstruct
high-fidelity images without obvious
artifacts.
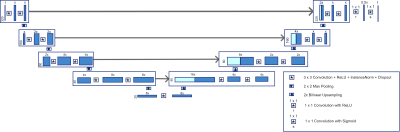
Figure 1 The proposed method uses a
Res-UNet architecture, which consists of 4 pooling layers. Real and imaginary
parts of complex T1- and T2-weighted images are treated as separate channels
for the model inputs.
Automated assessment of longitudinal White Matter Hyperintensities changes using a novel convolutional neural network in CADASIL
Valentin Demeusy1, Florent Roche1, Fabrice Vincent1, Jean-Pierre Guichard2, Jessica Lebenberg3,4, Eric Jouvent3,5, and Hugues Chabriat3,5 1Imaging Core Lab, Medpace, Lyon, France, 2Department of Neuroradiology, Hôpital Lariboisière, APHP, Paris, France, 3FHU NeuroVasc, INSERM U1141, Paris, France, 4Université de Paris, Paris, France, 5Departement of Neurology, Hôpital Lariboisière, APHP, Paris, France
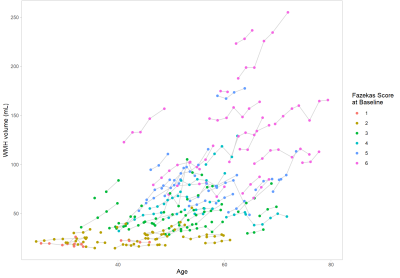
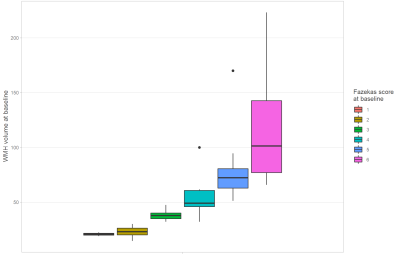
In 101 CADASIL patients, an automatic WMH segmentation method using a convolutional neural network showed consistent measures at baseline correlated with the Fazekas score and variable longitudinal volumetric changes at individual level also correlated to the amount of lesions at baseline.
Figure 2: WMH volume evolution for each subject according to age. Each subject was attributed a Fazekas score at baseline. This demonstrates the variable growth of the WMH for each subject even for those with an older age.
Figure 1: WMH volume per Fazekas score; both evaluated at baseline. WMH volume is highly correlated to the Fazekas score as shown by the clear separation of the different classes in the boxplot and the Spearman correlation of 0.921 (p-value < 0.001).
Automatic extraction of reproducible semi-quantitative histological metrics for MRI-histology correlations
Daniel ZL Kor1, Saad Jbabdi1, Jeroen Mollink1, Istvan N Huszar1, Menuka Pallebage- Gamarallage2, Adele Smart2, Connor Scott2, Olaf Ansorge2, Amy FD Howard1, and Karla L Miller1 1Wellcome Centre for Integrative Neuroimaging, University of Oxford, Oxford, United Kingdom, 2Neuropathology, Nuffield Department of Clinical Neurosciences, University of Oxford, Oxford, United Kingdom
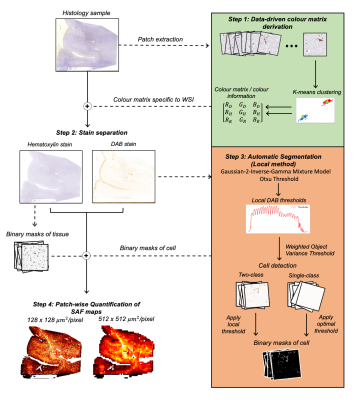
Here, we describe an end-to-end pipeline for the extraction of a histological metric from IHC stains to quantify a microstructural feature. We compare the pipeline's reproducibility and robustness to histology artefacts, relative to manual MRI-histology analyses.
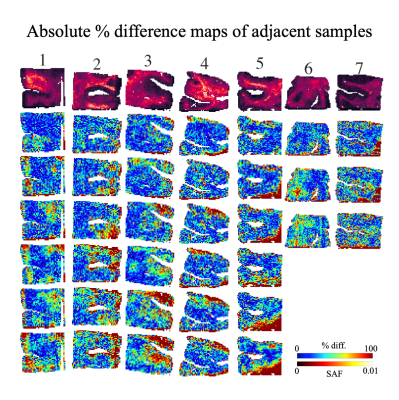
Fig. 1: A robust, automatic pipeline to quantify the stained area fraction (SAF) from histology slides as highlighted in the 4 steps. Input RGB slides are processed to produce SAF maps at variable resolution. We aim to correlate SAF maps at MRI-scale resolution (512x512 µm2/pixel) to MRI measures.
Fig. 3: An example SAF map (top row) and the absolute percent difference maps for all within-subject pairwise comparisons between adjacent slides with local thresholding (i.e. proposed pipeline). Each column shows a different subject. 3 adjacent slides produce 3 pairwise comparisons (subjects 6,7), while 4 adjacent slides produce 6 pairwise comparisons (other subjects). For almost all subjects, the highest percentage difference is found on the edges of the tissue, implying possible misalignment after co-registration or reduced robustness to tissue edge artefacts.
MRI-based deep learning model in differentiating benign from malignant renal tumors: a comparison study with radiomics analysis
Qing Xu1, Weiqiang Dou2, and Jing Ye1 1Northern Jiangsu People's Hospital, Yangzhou, China, 2GE Healthcare, MR Research China, Beijing, China
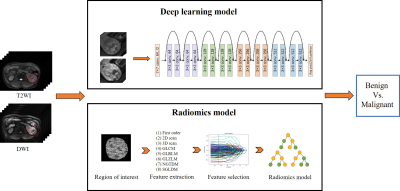
MRI-based deep learning model can be used to
distinguish benign from renal malignant tumors.
Figure 1: Schematic diagram of deep learning model and radiomics
model applied.
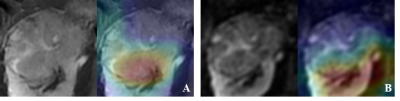
Figure 2: Feature heatmaps of a representative patient generated
from the ResNet50. (A) T2WI image (left) and the corresponding feature heatmap
(right). (B) DWI image (left) and the corresponding feature heatmap (right).
Evaluation of Automated Brain Tumor Localization by Explainable Deep Learning Methods
Morteza Esmaeili1, Vegard Antun2, Riyas Vettukattil3, Hassan Banitalebi1, Nina Krogh1, and Jonn Terje Geitung1,3 1Akershus University Hospital, Lørenskog, Norway, 2Department of Mathematics, University of Oslo, Oslo, Norway, 3Faculty of Medicine, Institute of Clinical Medicine, University of Oslo, Oslo, Norway
The
explainable method visualized the high-level features of
convolutional neural networks. The method evaluated the performance of deep
learning algorithms on localizing lesions. The proposed training evaluation may
improve human-machine interactions and assist in the training.
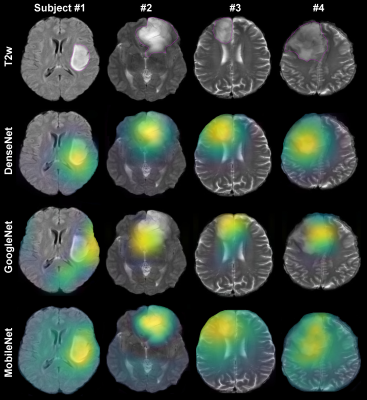
Figure 1. Grad-CAM visualizations on tumor detection for different training
networks. The top row depicts the original MR image
examples from four subjects. The magenta counters indicate the tumor lesion
boundaries. The bottom rows show the Grad-CAM
visualizations for three different training algorithm on the selected axial
slices.
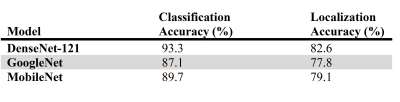
Table 1. Mean classification and localization error (%) on the testing
database for DenseNet, GoogleNet, and MobileNet.
A Comparative Study of Deep Learning Based Deformable Image Registration Techniques
Soumick Chatterjee1,2,3, Himanshi Bajaj3, Suraj Bangalore Shashidhar3, Sanjeeth Busnur Indushekar3, Steve Simon3, Istiyak Hossain Siddiquee3, Nandish Bandi Subbarayappa3, Oliver Speck1,4,5,6, and Andreas Nürnberger2,3,6 1Department of Biomedical Magnetic Resonance, Otto von Guericke University, Magdeburg, Germany, 2Data and Knowledge Engineering Group, Otto von Guericke University, Magdeburg, Germany, 3Faculty of Computer Science, Otto von Guericke University, Magdeburg, Germany, 4German Centre for Neurodegenerative Diseases, Magdeburg, Germany, 5Leibniz Institute for Neurobiology, Magdeburg, Germany, 6Center for Behavioral Brain Sciences, Magdeburg, Germany
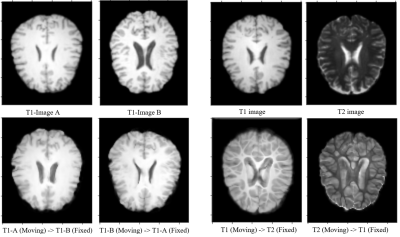
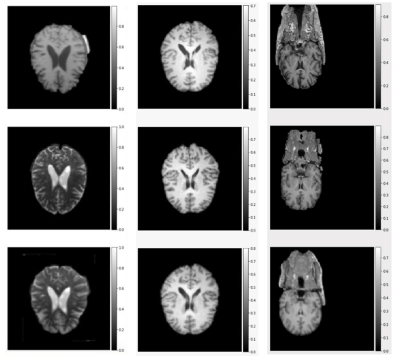
All three surveyed method performed well on the intermodality registration, though for intermodality they faced challenges. The best method achieved 0.960 SSIM for intramodality and for 0.915 for intermodality registration when compared against ANTs.
Fig.3: Result from experiments with ICNet.
(a) Intramodal deformable registration of affinely registered pre-processed images, after 100 epochs.
(b) Intermodal deformable registration of affinely registered pre-processed images, after 200 epochs.
Fig.1: Result from experiments with VoxelMorph, after 1000 epochs.
Rows (top to bottom): fixed image, moving image, and warped image
Columns (left to right): Intermodal deformable registration of affinely registered pre-processed images, Intramodal deformable registration of affinely registered pre-processed images, and Intramodal registration performed directly on raw images without using any pre-processing.