Machine Learning for Quantitative Imaging
Acq/Recon/Analysis Tuesday, 18 May 2021

Oral Session - Machine Learning for Quantitative Imaging
Acq/Recon/Analysis
Tuesday, 18 May 2021 16:00 - 18:00
  • BUDA-STEAM: A rapid parameter estimation method for T1, T2, M0, B0 and B1 using three-90° pulse sequence
    Seohee So1, Byungjai Kim1, HyunWook Park1, and Berkin Bilgic2
    1Korea Advanced Institute of Science and Technology, Daejeon, Korea, Republic of, 2Martinos Center for Biomedical Imaging, Charlestown, MA, United States
    A pulse sequence with three 90° RF pulse and blip-up/down acquisition is introduced to simultaneously acquire spin- and stimulated-echoes for distortion-free, fast T1, T2, M0, B0 and B1 mapping. For parameter estimation, analytic fitting and a novel unsupervised neural network are utilized.
    Figure 1 (A) Pulse sequence diagram and phase diagram of the proposed method. (B) Sequence diagrams of blip-up/down acquisition and schematic diagram of reconstructing distortion-free image from the blip-up/down images. (C) Schematic diagram of echo-shifting with echo-shifting factor of six.
    Figure 2 (A) Spin echo and stimulated echo signal evolutions of four different tissues with five [TE, TM] combinations. (B) Schematic diagram of analytic fitting process. (C) Schematic diagram of unsupervised parameter estimation with neural network (a) and detailed structure of the quantification network (b). As input of Bloch generator, outputs of quantification network, B1 from analytic fitting and brain mask are used.
  • DeepTSE-T2: Deep learning-powered T2 mapping with B1+ estimation using a product double-echo Turbo Spin Echo sequence
    Hwihun Jeong1, Hyeong-Geol Shin1, Sooyeon Ji1, Jinhee Jang2, Hyun-Soo Lee3, Yoonho Nam4, and Jongho Lee1
    1Department of Electrical and Computer Engineering, Seoul National University, Seoul, Korea, Republic of, 2Department of Radiology, Seoul St Mary’s Hospital, College of Medicine, The Catholic University of Korea, Seoul, Korea, Republic of, 3Siemens healthineers Ltd, Seoul, Korea, Republic of, 4Division of Biomedical Engineering, Hankuk University of Foreign Studies, Yongin, Korea, Republic of
    We developed a deep learning-based T2 mapping method with retrospective B1+ estimation for a double-echo TSE sequence and applied it to χ-separation and an MS patient.
    Figure 2. (a) Results of DeepTSE-T2 and conventional EPGSLR fitting with extra B1+ information. B1+ maps in the fourth and fifth columns are used for the EPGSLR fitting. In the acquired B1+ map, values above 1 were flipped with respect to 1, assuming symmetry. (b) NRMSE, PSNR, SSIM of the T2 maps with respect to the labels. DeepTSE-T2 provides a high-quality T2 map, comparable to those of the EPGSLR fitting with B1+ map from MESE.
    Figure 5. Results of χ-separation using DeepTSE-T2 map: ALIC - anterior limb of internal capsule, CN - caudate nucleus, GP - globus pallidus, ND - nucleus dorsomedialis, PLIC - Posterior limb of internal capsule, Pul - pulvinar, Put - putamen, RN - red nucleus, and SN - substantia nigra. In the case of 2 mm slice thickness, the positive and negative susceptibilities using DeepTSE-T2 show similar results with those using MESE. 1 mm slice χ-separation using DeepTSE-T2 is also illustrated, demonstrating feasibility of high resolution χ -separation.
  • Fast and Accurate Modeling of Transient-state Sequences by Recurrent Neural Networks
    Hongyan Liu1, Oscar van der Heide1, Cornelis A.T. van den Berg1, and Alessandro Sbrizzi1
    1Computational Imaging Group for MR diagnostics & therapy, Center for Image Sciences, UMC Utrecht, Utrecht, Netherlands
    We propose a Recurrent Neural Network (RNN) model for quickly computing large-scale MR signals and derivatives. The proposed RNN model can be used for accelerating different qMRI applications within seconds, in particular MRF dictionary generation and optimal experimental design.
    Fig.4. MRF reconstructions of in-vivo data using EPG and RNN generated dictionaries. [First, second and third rows] ,$$$T_1, T_2$$$, and $$$abs(PD)$$$ maps for the in-vivo brain data, respectively. NRMSEs are reported on the top-right corner of the difference maps.
    Fig.1. RNN structure for learning the EPG model. (a) RNN architecture with 3 stacked Gated Recurrent Units (GRU) for the n-th time step. At each time step, GRU1 receives inputs x(n) including tissue parameter θ and time-varying sequence parameter β(n). The hidden states h1(n), h2(n), h3(n), all with size of 32x1, are computed and used for the next time step. A Linear layer is added after GRU3 to compute the magnetization and derivatives using h3(n). (b) An initial linear layer, LinearInit, is used for computing the initial hidden state h1(0), h2(0), h3(0) from initial magnetization M0.
  • Unsupervised physics-informed deep learning (N=1) for solving inverse qMRI problems – Relaxometry and field mapping from multi-echo data
    Ilyes Benslimane1, Thomas Jochmann2, Robert Zivadinov1,3, and Ferdinand Schweser1,3
    1Buffalo Neuroimaging Analysis Center, Department of Neurology, Jacobs School of Medicine and Biomedical Sciences, University at Buffalo, The State University of New York, Buffalo, NY, United States, Buffalo, NY, United States, 2Department of Computer Science and Automation, Technische Universität Ilmenau, Ilmenau, Germany, Jena, Thuringia, Germany, 3Center for Biomedical Imaging, Clinical and Translational Science Institute at the University at Buffalo, Buffalo, NY, USA, Buffalo, NY, United States
    The physics-informed network successful demonstrated the capacity to quickly produce accurate B0 and R2* field maps without phase wrapping artifacts and with typical contrast variations compared to those produced with conventional methods.
    Figure 3: Shown from top left to bottom right: (a) Conventionally obtained amplitude image of a multi-echo GRE scan, (b) Network predicted amplitude parameter map, (c) Ratio of predicted to conventionally obtained amplitude images, (d) Conventionally obtained R2* image of a multi-echo GRE scan, (e) Network predicted R2* parameter map, (f) Difference in R2* maps between conventionally obtained and network trained methods, (g) the frequency prediction map, (h) the phase offset prediction, (i) the gradient offset prediction
    Figure 2: Shown from top left to bottom right: (a) predicted magnitude image of the 10th echo of the multi-echo GRE scan (at network output layer), (b) expected magnitude image of the input multi-echo GRE scan, (c) magnitude image discrepancy, (d) predicted phase image, (e) expected input phase image, (f) phase image discrepancy.
  • MoG-QSM: A Model-based Generative Adversarial Deep Learning Network for Quantitative Susceptibility Mapping
    Ruimin Feng1, Yuting Shi1, Jie Feng1, Yuyao Zhang2, and Hongjiang Wei1
    1School of Biomedical Engineering, Shanghai Jiao Tong University, Shanghai, China, 2School of Information Science and Technology, ShanghaiTech University, Shanghai, China
    We proposed a model-based generative adversarial network for quantitative susceptibility mapping. It provided superior image quality and accuracy quantification compared to recently developed QSM reconstruction methods.
    Figure 1. The schematic diagram of MoG-QSM. Blue blocks play the role of the proximal operator. They are shared weights and replace with convolutional neural network. The output of each generator performs a physical model operation (green block). The final output and label are feed into the discriminator to distinguish if the image is true or not.
    Figure 2. Comparison of different QSM reconstruction methods on a healthy subject. The red arrow pointed to the blur cortex susceptibility contrast reconstructed by the LPCNN.
  • Self-supervised Deep Learning for Rapid Quantitative Imaging
    Fang Liu1 and Li Feng2
    1Radiology, Harvard Medical School, Boston, MA, United States, 2Radiology, Icahn School of Medicine at Mount Sinai, New York, NY, United States
    This work developed a model-guided self-supervised deep learning MRI reconstruction framework called REference-free LAtent map eXtraction (RELAX) to allow accelerated quantitative imaging without training with reference data.
    Figure 1: The schematic demonstration of the CNN framework implementing RELAX. A cyclic workflow was constructed to enforce self-supervised learning. The physics models and additional constraints can be incorporated into the framework to guide the learning of CNN mapping function to extract the latent image parameter maps from undersampled images.
    Figure 3: Representative T1 maps estimated using RELAX in one simulated brain dataset at three different experiment conditions, respectively. RELAX successfully suppressed the noises at 5% noise level (NL) and removed the undersampling artifacts at R=5 through self-supervised deep learning reconstruction, providing image quality that is comparable to the noise/artifact-free ground truth (G.T.) T1 map. The NLLS was applied to zero-filling reconstructed images at R=5.
  • MRzero with dAUTOMAP reconstruction– automated invention of MR acquisition and neural network reconstruction
    Hoai Nam Dang1, Simon Weinmüller1, Alexander Loktyushin2,3, Felix Glang2, Arnd Dörfler1, Andreas Maier4, Bernhard Schölkopf3, Klaus Scheffler2,5, and Moritz Zaiss1,2
    1Neuroradiology, University Clinic Erlangen, Friedrich-Alexander Universität Erlangen-Nürnberg (FAU), Erlangen, Germany, 2Magnetic Resonance Center, Max-Planck Institute for Biological Cybernetics, Tübingen, Germany, 3Empirical Inference, Max-Planck Institute for Intelligent Systems, Tübingen, Germany, 4Pattern Recognition Lab, Friedrich-Alexander Universität Erlangen-Nürnberg (FAU), Erlangen, Germany, 5Department of Biomedical Magnetic Resonance, Eberhard Karls University Tübingen, Tübingen, Germany
    We propose a CNN based end-to-end optimized T1 mapping by using a joint optimization of sequence parameters and neural network parameters for optimal signal acquistion, image reconstruction and T1 mapping. 
    Figure 1: MR signal is simulated for given sequence and spin system, reconstruction and T1 mapping is performed with a NN. The output is compared to the target and gradient descent is performed to update TI/Trec and NN. Architecture: NN takes as input the complex k-space of all measurements and outputs a T1 map. The first two convolutional layers act as decomposed transform (DT) layers for image reconstruction, as described in 2. Magnitude of the output of the reconstruction part is calculated and feed into a three-hidden-layer multilayer perceptron for T1 quantification.
    Figure 3: Optimized TI and Trec times (a,b) starting from a standard inversion recovery and resulting T1 maps (e,f) are compared to optimization from minimal TI and Trec times (c,d,g,h). The CNN provides T1 values in good agreement with literature values at 3T for both approaches (I,j & k,l).
  • Bidirectional Translation Between Multi-Contrast Images and Multi-Parametric Maps Using Deep Learning
    Shihan Qiu1,2, Yuhua Chen1,2, Sen Ma1, Zhaoyang Fan1,2, Anthony G. Christodoulou1,2, Yibin Xie1, and Debiao Li1,2
    1Biomedical Imaging Research Institute, Cedars-Sinai Medical Center, Los Angeles, CA, United States, 2Department of Bioengineering, UCLA, Los Angeles, CA, United States
    Combined training of two neural networks with additional cycle consistency loss allows bidirectional translation between contrast-weighted images and quantitative maps. It generates high-quality weighted images and quantitative maps simultaneously.
    Figure 1. Network design. (a) The proposed combined training of two synthetic networks using cycle consistency loss. (b) Separate training of the networks without cycle consistency loss.
    Figure 3. A sample case of synthetic quantitative maps from a patient with multiple sclerosis using CNN with or without cycle loss. (a) T1 map, (b) T2 map, (c) proton density map. The black arrows show a lesion.
  • Accelerating perfusion quantification using ASL-MRI with a neural network based forward model
    Yechuan Zhang1 and Michael A Chappell1,2,3
    1Institute of Biomedical Engineering, Department of Engineering Science, University of Oxford, Oxford, United Kingdom, 2Sir Peter Mansfield Imaging Centre, School of Medicine, University of Nottingham, Nottingham, United Kingdom, 3Wellcome Centre for Integrative Neuroimaging, FMRIB, Nuffield Department of Clinical Neurosciences, University of Oxford, Oxford, United Kingdom
    Both neural networks performed well in simulation and in-vivo experiments. The dispersion neural network is shown to achieve a 5-fold improvement in computational cost compared with the gamma dispersion kinetic model.
    Comparisons on perfusion error between the kinetic model with gamma dispersion effect and NNdispersion in simulation experiments. The top row shows the perfusion error for the dispersion KM at Low ATT (0-0.5s), Mid ATT (0.5-1.8s) and High ATT (1.8-2.0s) respectively for various SNR levels. The second row shows the errors estimated by NNdispersion. Both models performed well, with little overall bias, for short and mid ATT, but exhibited some bias at longer ATT and lower SNR. The bias was comparable between NNdispersion and dispersion KM and variance in estimates was consistent.
    Comparisons on ATT error between the kinetic model with gamma dispersion effects and NNdispersion in simulation experiments. The plot on the left shows the ATT error for the gamma dispersion KM for various SNR levels. The plot on the right shows the errors estimated by NNdispersion. Both models performed well, with little overall bias for all cases. The bias was comparable between gamma dispersion KM and NNdispersion and variance in ATT estimates was consistent.
  • Track-To-Learn: A general framework for tractography with deep reinforcement learning
    Antoine Théberge1, Christian Desrosiers2, Maxime Descoteaux1, and Pierre-Marc Jodoin1
    1Faculté des Sciences, Université de Sherbrooke, Sherbrooke, QC, Canada, 2Département de génie logiciel et des TI, École de technologie supérieure, Montréal, QC, Canada
    By learning tractography algorithms via deep reinforcement learning, we are able to obtain competitive results compared to supervised learning approaches, while demonstrating far superior generalization capabilities to new datasets than prior work. 
    Representation of the framework. Top: The RL loop, where states, rewards and actions are exchanged between the learning agent and the environment. Top-left: the environment keeps track of the reconstructed streamlines and computes states and rewards accordingly. Top-right: The agent uses states and rewards received to improve itself and output actions. Bottom: Reconstructed tractograms are iteratively more plausible as training goes on.
    Results for experiment 2. A, B, C refer to the same methods as in Figure 3. D refers to Neher et al.15,16, E refers to Benou et al.17, F refers to Wegmayr et al. (2020)18. ISMRM2015 refers to the mean results of the original challenge11. (GT) indicates that the method was trained on the ground-truth bundles. X indicates measures that were not reported by the original authors. Reported metrics are the same as in Figure 3.
Back to Top
Digital Poster Session - Machine Learning for Quantitative Imaging
Acq/Recon/Analysis
Tuesday, 18 May 2021 17:00 - 18:00
  • qMTNet+: artificial neural network with residual connection for accelerated quantitative magnetization transfer imaging
    Huan Minh Luu1, Dong-Hyun Kim1, Seung-Hong Choi2, and Sung-Hong Park1
    1Magnetic Resonance Imaging Laboratory, Department of Bio and Brain Engineering, Korea Advanced Institute of Science and Technology, Daejeon, Korea, Republic of, 2Department of Radiology, Seoul National University Hospital, Seoul, Korea, Republic of
    In this study, we propose qMTNet+, an improved version of qMTNet that accomplishes acceleration for data acquisition and fitting , as well as generation of missing data with a single residual network. Results showed that qMTNet+ improves the quality of generated MT images and qMT parameters.
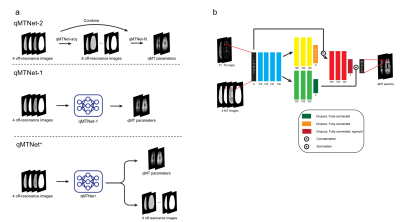
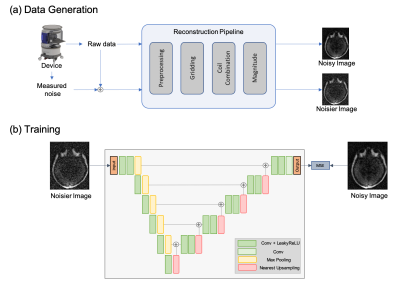
    Figure 1: a) Overview of qMTNet-2, qMTNet-1 and qMTNet+ approach: qMTNet-2 comprises of 2 separate sub-networks. qMTNet-1 is a single integrated network to directly predict qMT parameters from undersampled MT images. qMTNet+ consists of a single network that can produce both values of interest. b) Structure of qMTNet+. Unless stated in the caption, the layer includes 100 hidden neurons with rectified linear unit (ReLU) activation and batch normalization. Different color signifies different computation path in the network.
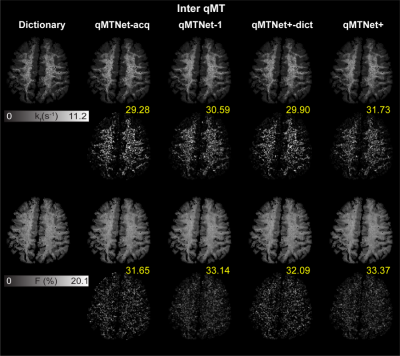
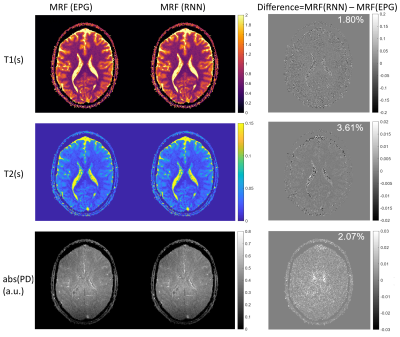
    Figure 3: Qualitative comparison between qMTNet+ and qMTNet output against dictionary fitted qMT parameters on inter-slice MT data. Dictionary specifies qMT parameters obtained from dictionary fitting of acquired MT data and is considered as the label. The numbers at the bottom of the images are the peak signal-to-noise ratio. The top two rows show result for k­f and the bottom two rows show result for F. The first row shows qMT parameters from the different fitting methods and the second row shows the 5 times magnified absolute differences. Details of the networks are explained in text.
  • Global and Local Deep Dictionary Learning Network for Accelerating the Quantification of Myelin Water Content
    Quan Chen1, Huajun She1, Zhijun Wang1, and Yiping P. Du1
    1School of Biomedical Engineering, Shanghai Jiao Tong University, Shanghai, China
    A Global and Local Deep Dictionary Learning Network (GLDDL) is proposed to accelerate the MWF mapping. The GLDDL network explores both global and local spatiotemporal correlations. The merits of traditional DL and that of the deep learning are combined in the propose network.
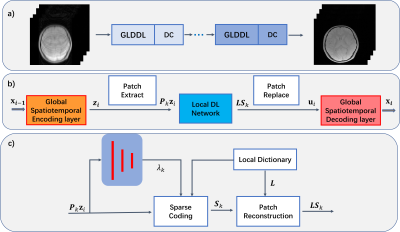
    Figure 1. a) The overview of the propose GLDDL network. b) The GLDDL block. The global spatiotemporal encoder and decoder layers are used before and after the local DL network, respectively. c) The details of the local DL network.
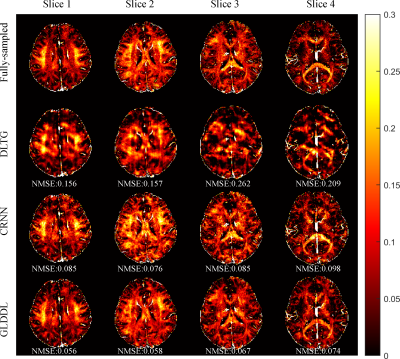
    Figure 3. The comparative MWF maps of the DLTG, CRNN, and GLDDL reconstructions at R = 6 from one subject. The NMSE are showed at the bottom of the corresponding images.
  • Rapid MR Parametric Mapping using Deep Learning
    Jing Cheng1, Yuanyuan Liu1, Xin Liu1, Hairong Zheng1, Yanjie Zhu1, and Dong Liang1
    1Shenzhen Institutes of Advanced Technology, Chinese Academy of Sciences, Shenzhen, China
     In this work, we proposed to incorporate the quantitative physical model into the deep learning framework to simultaneously reconstruct the parameter-weighted images and generate the parametric map without the reference parametric maps.
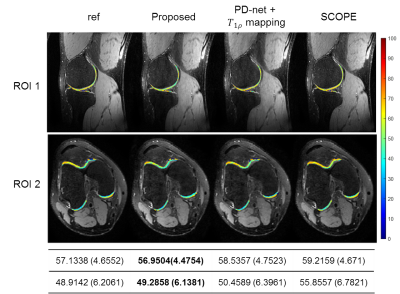
    Figure 4. The estimated parametric maps for selected cartilage ROIs overlaid on the reconstructed T-weighted images at TSL = 5 ms for R = 9.2 from Data 2. The mean values and the standard deviations of the ROI maps are also provided.
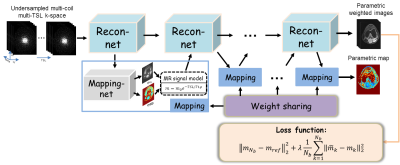
    Figure 1. Overview of the proposed framework.
  • Synthesizing large scale datasets for training deep neural networks in quantitative mapping of myelin water fraction
    Serge Vasylechko1,2, Simon K. Warfield1,2, Sila Kurugol1,2, and Onur Afacan1,2
    1Boston Children's Hospital, Boston, MA, United States, 2Harvard Medical School, Boston, MA, United States
    We generated substantial amount of 3D synthetic T2 relaxometry data with a realistic forward model, and demonstrate its application to myelin water fraction. Our network has resulted in an excellent accuracy in the synthetic test dataset, and generated similar MWF maps as the NNLS algorithm.  
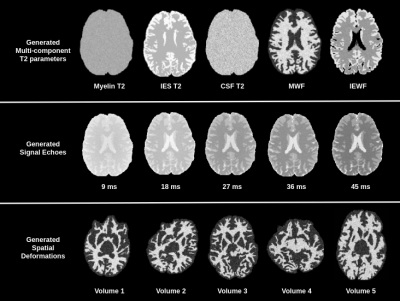
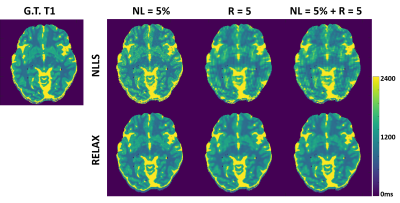
    Figure 2: An example of the generated synthetic data. Top row shows the model parameters, second row shows the generated signals and third row shows generated spatial transformations.
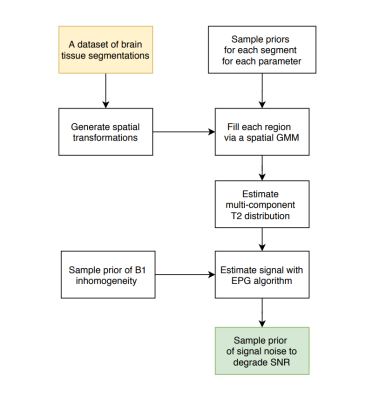
    Figure 1: A flowchart detailing the proposed pipeline for generation of large scale 3D synthetic datasets for multi-component T2 distributions within the naturally occuring bounds, with a spatially varying sampling model.
  • Deep unrolled network with optimal sampling pattern to accelerate multi-echo GRE acquisition for quantitative susceptibility mapping
    Jinwei Zhang1, Hang Zhang1, Pascal Spincemaille2, Mert Sabuncu3, Thanh Nguyen2, Ilhami Kovanlikaya2, and Yi Wang2
    1Cornell University, New York, NY, United States, 2Weill Cornell Medical College, New York, NY, United States, 3Cornell University, Ithaca, NY, United States
    An unrolled ADMM reconstruction network with learned optimal sampling pattern is trained to accelerate multi-echo 3D-GRE acquisition for quantitative susceptibility mapping. Prospective study shows the learned pattern achieves better QSM image quality than a manually designed pattern.
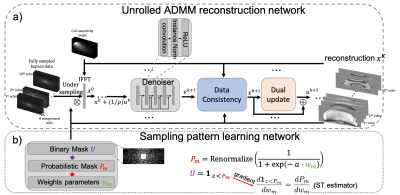
    Figure 1. Proposed network architecture. Unrolled ADMM network (a) reconstructed multi-echo images from the under-sampled multi-coil multi-echo kspace data. Sampling pattern learning network (b) optimized the kspace undersampling pattern with a straight-through estimator to improve back-propagation.
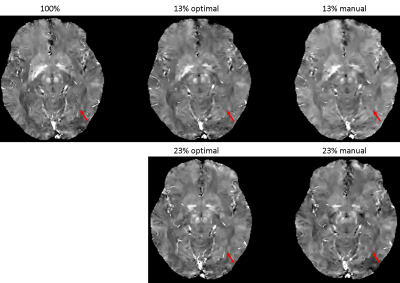
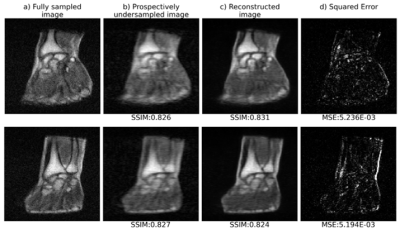
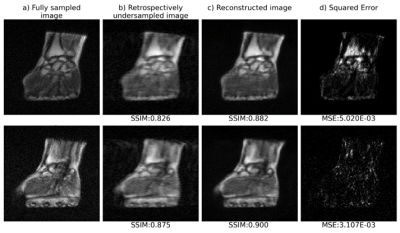
    Figure 3. QSMs of optimal and manually designed sampling patterns with 13% and 23% sampling ratios, with fully sampled (100%) QSM as the reference. QSM sampled by the optimal pattern captures more details in the image such as veins (red arrow) compared to the manual pattern. With 13% under-sampling ratio, both QSMs by the optimal and manual patterns lose some detailed structures (red arrow).
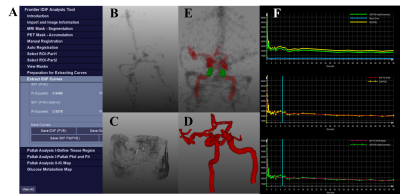
  • Automated quantitative evaluation of deep learning model for reduced gadolinium dose in contrast-enhanced brain MRI
    Srivathsa Pasumarthi1, Jon Tamir2, Enhao Gong2, Greg Zaharchuk2, and Tao Zhang2
    1Subtle Medical Inc, Menlo Park, CA, United States, 2Subtle Medical Inc., Menlo Park, CA, United States
    This work proposes an automated quantitative evaluation scheme for the GBCA dose reduction using DL.
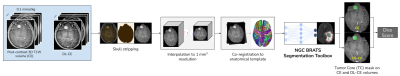
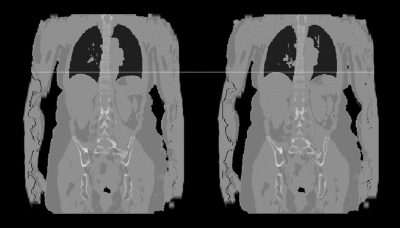
    Overall processing pipeline for the quantitative evaluation scheme. The post-contrast 3D T1W (CE) and DL-CE volumes were skull-stripped, interpolated and co-registered to anatomical template. The volumes are then processed with the BRATS pre-trained volume through the NGC interface to obtain the Tumor Core (TC) segmentation masks.
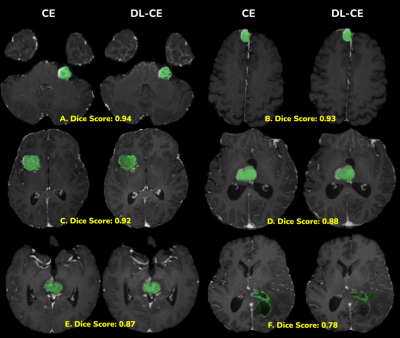
    CE and DL-CE shown side-by-side with the segmented Tumor Core (TC) (green overlay). Individual Dice scores are shown below each image pair. The segmentation mask of DL-CE in image (F) is different from that of CE, even though the enhancement patterns look similar.
  • Using an ANN to estimate Initial Values for Mapping of the Oxygen Extraction Fraction with combined QSM and qBOLD
    Patrick Kinz1, Sebastian Thomas1, and Lothar R. Schad1
    1Computer Assisted Clinical Medicine, Heidelberg University, Medical Faculty Mannheim, Mannheim, Germany
    Combining an ANN with traditional quasi-Newton methods increases robustness an reduces noise of OEF mapping with QSM and qBOLD.
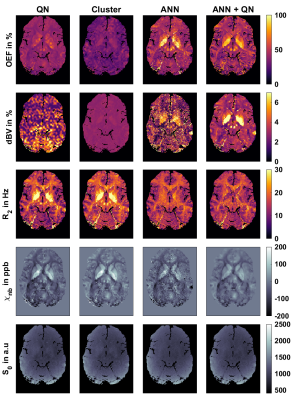
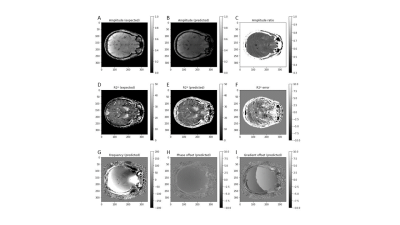
    Fig.1: Representative axial slice of the reconstructed parameters: oxygen extraction fraction OEF, deoxygenated blood volume dBV, transverse relaxation rate R2, non-blood susceptibility χnb and magnitude after excitation S0. Reconstruction is based on combined QSM and qBOLD and done with four different approaches: a voxel wise quasi-Newton (QN) approach, QN initialized with the results from an initial fit on clusters of voxels with similar signal development (Cluster), an artificial neural network (ANN), and QN initialized with the results from the ANN (ANN+QN).
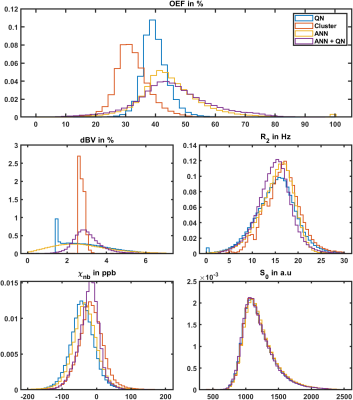
    Fig.2: Normalized histograms of reconstructed parameters in gray matter (left) and white matter (right) of the same test subject as in figure 1. Parameters are oxygen extraction fraction OEF, deoxygenated blood volume dBV, transverse relaxation rate R2, non-blood susceptibility χnb and magnitude after excitation S0. Reconstruction approaches are: voxel wise quasi-Newton (QN), QN initialized with an initial fit on clusters of voxels with similar signal development (Cluster), an artificial neural network (ANN), and QN initialized with the results from the ANN (ANN+QN).
  • A self-supervised deep learning approach to synthesize weighted images and T1, T2, and PD parametric maps based on MR physics priors
    Elisa Moya-Sáez1,2, Rodrigo de Luis-García1, and Carlos Alberola-López1
    1University of Valladolid, Valladolid, Spain, 2Fundación Científica AECC, Valladolid, Spain
    • - A self-supervised deep learning approach to compute T1, T2, and PD maps from clinical routine sequences.
    • - Any realistic weighted images can be synthesized from the parametric maps.
    • - The proposed self-supervised CNN achieves significant improvements in most synthesized modalities.
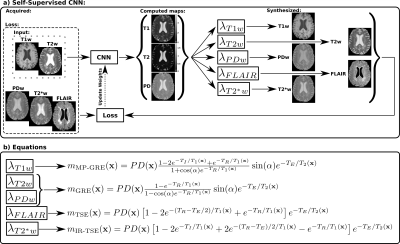
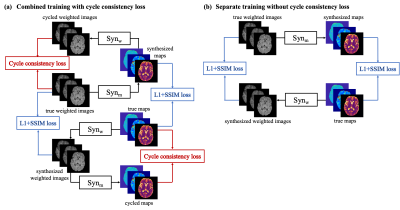
    Figure 1: Overview of the proposed approach. a) Pipeline for training and testing the self-supervised convolutional-neural-network (CNN). b) Equations of the lambda layers used to synthesize the T1w, T2w, PDw, T2*w and FLAIR images from the previously computed parametric maps and with sequence parameters of Table 1. m(x) is the signal intensity of the corresponding weighted image at pixel x. Note that the CNN is pre-trained exclusively with synthetic data, as described in Ref7, and that PDw, T2*w, and FLAIR images are only used to compute the loss function and are not input to the CNN.
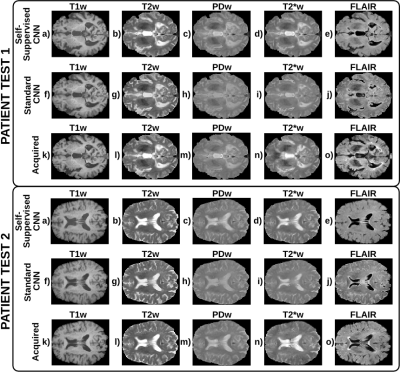
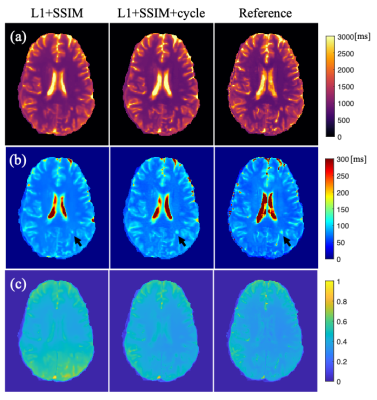
    Figure 3: A representative axial slice of the synthesized and the corresponding acquired weighted images for each test patient. a-e) T1w, T2w, PDw, T2*w, and FLAIR images synthesized by the self-supervised CNN. f-j) Corresponding images synthesized by the standard CNN. k-o) Corresponding acquired images. The self-supervised CNN achieves better structural information and contrast than the standard CNN obtaining higher quality synthesis. Specifically, for the PDw, T2*w, and FLAIR which had the lowest quality synthesis in the standard CNN. See the CSF of the PDw, T2*w, and FLAIR.
  • Free-breathing Abdomen T2 mapping via Single-shot Multiple Overlapping-echo Acquisition and Deep Neural Network Reconstruction
    Xi Lin1, Qinqin Yang1, Jianfeng Bao2, Shuhui Cai1, Zhong Chen1, Congbo Cai1, and Jingliang Cheng2
    1Department of Electronic Science, Xiamen University, Xiamen, China, 2Department of Magnetic Resonance Imaging, The First Affiliated Hospital of Zhengzhou University, Zhengzhou University, Zhengzhou, China
    In this work, overlapping echo acquisition together with deep learning-based reconstruction were proposed to achieve T2 mapping of abdomen in free-breathing for the first time.
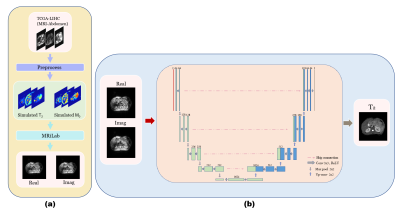
    Figure 2. The flowchart of training sample generation and reconstruction of T2 mapping. (a) The single contrast abdomen MRI images from TCGA-LIHC are preprocessed first to generate T2 and M0 templates, and then the simulated MOLED acquisition is implemented on MRiLab. (b) U-Net is trained to reconstruct T2 maps from MOLED data.
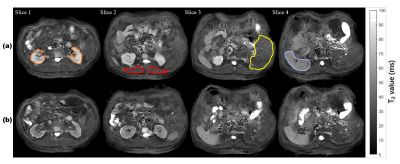
    Figure 3. Reconstructed abdomen T2 maps from single-shot MOLED images. (a) T2 maps with contrast enhancement, the kidney, skeletal muscle, liver and spleen are circled in orange, red, yellow and purple, respectively. (b) T2 maps without contrast enhancement.
  • Myelin water fraction determination from relaxation times and proton density through deep learning neural network
    Nikkita Khattar1, Zhaoyuan Gong1, Matthew Kiely1, Curtis Triebswetter1, Maryam H. Alsameen1, and Mustapha Bouhrara1
    1Laboratory of Clinical Investigation, National Institute on Aging, Baltimore, MD, United States
    An artificial neural network model was trained and successfully used to generate myelin water fraction maps from conventional relaxation times and proton density maps.
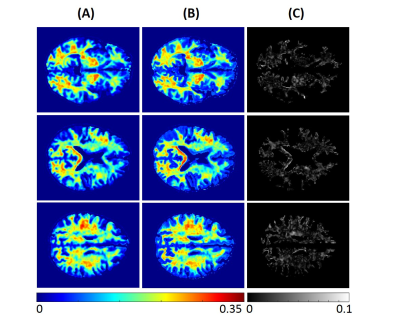
    Figure 1. MWF maps from the brain imaging of a young participant. Results are displayed for three different axial slices. (A) represents the MWF maps calculated from BMC-mcDESPOT method (the reference method). (B) represents MWF maps calculated using our trained neural network (NN) model. (C) shows the absolute difference map between the reference and the NN methods.
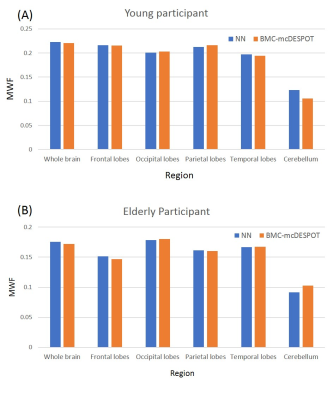
    Figure 3. Mean MWF values calculated within representative white matter brain regions using the NN (blue) and BMC-mcDESPOT (orange) methods. Results are shown for both the young (A) and elderly (B) participants, and indicate that NN- and BMC-mcDESPOT-derived MWF exhibit virtually similar values for all regions evaluated.
  • In-Vivo evaluation of high resolution T2 mapping using Bloch simulations and MP-PCA image denoising
    Neta Stern1, Dvir Radunsky1, Tamar Blumenfeld-Katzir1, Yigal Chechik2,3, Chen Solomon1, and Noam Ben-Eliezer1,4,5
    1Department of Biomedical Engineering, Tel Aviv University, Tel Aviv, Israel, 2Department of Orthopedics, Shamir Medical Center, Zerifin, Israel, 3Sackler Faculty of Medicine, Tel Aviv University, Tel Aviv, Israel, 4Sagol School of Neuroscience, Tel Aviv University, Tel Aviv, Israel, 5Center for Advanced Imaging Innovation and Research (CAI2R), New-York University, Langone Medical Center, NY, United States
    The Marchenko-Pastur Principle Component Analysis denoising algorithm can be used to improve the high-resolution mapping of quantitative T2 values. The technique was validated on in vivo brain and knee data, leading to an increase in T2 maps precision while preserving anatomical features.
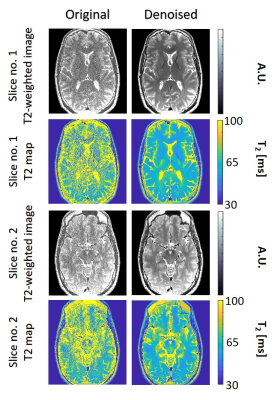
    Figure 
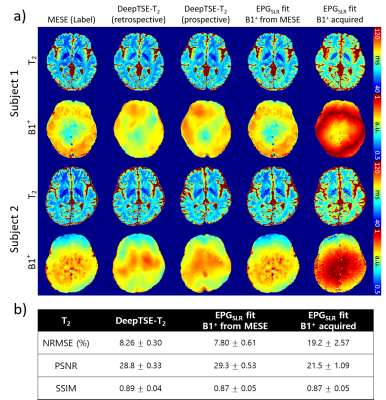
3: T2 weighted images and T2 maps for two slices acquired using the second high-resolution in vivo brain scan. Left / right columns show the pre- / post-denoising images and T2-maps (window size 15x15).
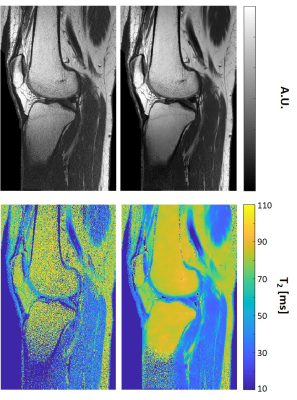
    Figure 4: T2 weighted images and T2 maps of a selected slice acquired using a high resolution in vivo knee scan (matrix size=448x280, FOV=192x120 mm2). The left column shows the original images and T2-maps, and the right column shows the corresponding images and T2 maps after MP-PCA image denoising (window size 20x10).
  • Rapid learning of tissue parameter maps through random FLASH contrast synthesis
    Divya Varadarajan1,2, Katie Bouman3, Bruce Fischl*1,2,4, and Adrian Dalca*1,5
    1Martinos Center for Biomedical Imaging, Charlestown, MA, United States, 2Department of Radiology, Harvard Medical School, Boston, MA, United States, 3Department of Computing and Mathematical Sciences, California Institute of Technology, Pasadena, CA, United States, 4Massachusetts General Hospital, Boston, MA, United States, 5Electrical Engineering and Computer Science, Massachusetts Institute of Technology, Cambridge, MA, United States
    We propose an unsupervised deep-learning strategy that generalizes over multiple acquisition parameters and employs the FLASH MRI model to jointly estimate T1, T2* and PD tissue parameter maps with the goal to synthesize physically plausible FLASH signals. 
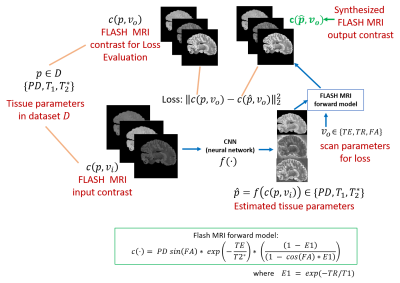
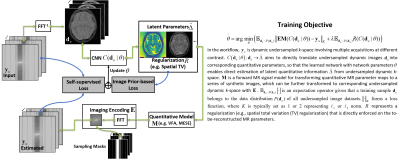
    Figure 1: Proposed framework: The proposed model to synthesize arbitrary FLASH MRI contrasts using a CNN and a FLASH forward model from three input image contrasts. As a consequence of using the FLASH model, the output of the CNN can be interpreted as estimates of the tissue parameters (T1,T2* and PD).
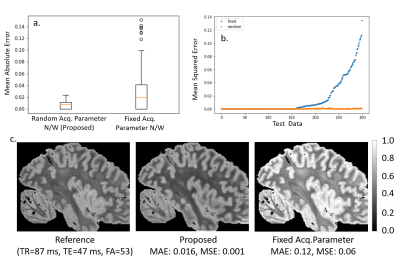
    Figure 2: Contrast Synthesis: Test error in synthesis of image contrasts estimated from three input images over 100 test datasets. The boxplots in 2a and 2b, plot the MAE and the images in 2c. show the reference, proposed estimate and fixed acq. network estimate. The images in 2c. show a slice from the test dataset, with the reference estimated from 3 flip 4 echo scan and predicted contrast from both random and fixed networks.
  • Accurate quantitative parameter maps reconstruction method for tsDESPOT using Low Rank approximated Unet ADMM
    Yuuzo Kamiguchi1, Sadanori Tomiha2, and Masao Yui3
    1Advanced Technology Reserch Dept. Reserch and Development Center, Canon Medical Systems Corporation, Kawasaki, Japan, 2Advanced Technology Reserch Dept. Reserch and Development Center, Canon Medical Systems Corporation, Otawara, Japan, 3Reserch and Development Center, Canon Medical Systems Corporation, Otawara, Japan
    From the data acquired by DESPOT like sequence, full sampled low rank approximated images were estimated using ADMM method which optimize Unet estimation and data consistency, then accurate quantitative maps were obtained by dense neural network.
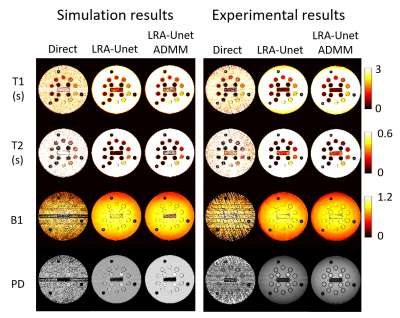
    Figure 4. Representative T1, T2, B1 and PD maps of numerical and real NIST system phantom obtained using three reconstruction methods.
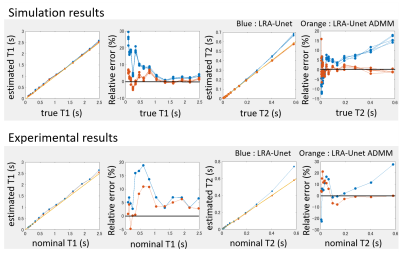
    Figure 5. Mean estimated value of T1, T2, and their relative errors in each region of numerical and real NIST system phantoms as function of their true and nominal value each other.
  • Deep Learning Enhanced T1 Mapping and Reconstruction Framework with Spatial-temporal and Physical Constraint
    Yuze Li1, Huijun Chen1, Haikun Qi2, Zhangxuan Hu3, Zhensen Chen1, Runyu Yang1, Huiyu Qiao1, Jie Sun4, Tao Wang5, Xihai Zhao1, Hua Guo1, and Huijun Chen1
    1Center for Biomedical Imaging Research, Medical School, Tsinghua University, Beijing, China, 2School of Biomedical Engineering and Imaging Sciences, King’s College London, London, United Kingdom, 3GE Healthcare, Beijing, China, 4Vascular Imaging Lab and BioMolecular Imaging Center, Department of Radiology, University of Washington, Seattle, Seattle, WA, United States, 5Department of Neurology, Peking University Third Hospital, Beijing, China
    A Deep learning enhAnced T1 parameter mappIng and recoNstruction framework using spatial-Temporal and phYsical constraint (DAINTY) was proposed. DAINTY imposed low rank, sparsity and physical constraints to generate good quality T1 weighted images and T1 maps.
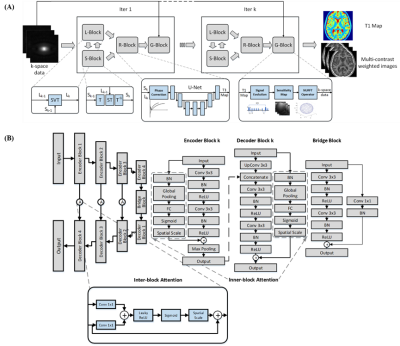
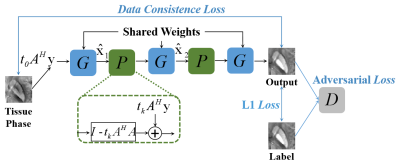
    Figure 1. The illustration of DAINTY framework. (A) The under-sampled k-space data are first processed by L-Block and S-Block to impose the low rank and sparsity constraint. Then they are processed through R-Block to generate refined T1 maps. The physical model G-Block is used to transform T1 map back to T1 weighted images to further improve the reconstruction quality. After k iterations the clear T1 map and high-quality T1 weighted images can be both obtained. (B) The structure of DenseAttention UNet. The number of feature maps for encoder and decoder block 1-4 are 256, 128, 64, and 32.
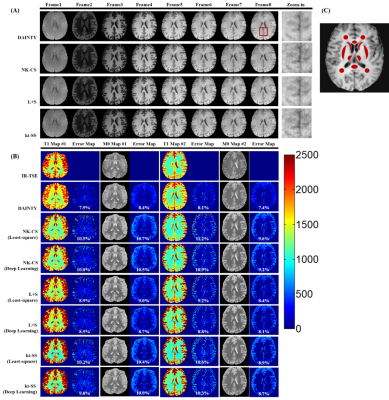
    Figure 3. MR images of in-vivo human brain. (A) T1 weighted images from GOAL-SNAP sequence using DAINTY, NK-CS, kt-SS and L+S method; (B) Reconstructed T1 and M0 maps and error maps from GOAL-SNAP sequence using DAINTY, NK-CS, kt-SS and L+S methods with least-square fitting and direct deep learning mapping. T1 and M0 maps from IR-TSE are as the reference.
  • Learned Proximal Convolutional Neural Network for Susceptibility Tensor Imaging
    Kuo-Wei Lai1,2, Jeremias Sulam1, Manisha Aggarwal3, Peter van Zijl2,3, and Xu Li2,3
    1Department of Biomedical Engineering, Johns Hopkins University, Baltimore, MD, United States, 2F.M. Kirby Research Center for Functional Brain Imaging, Kennedy Krieger Institute, Baltimore, MD, United States, 3Department of Radiology and Radiological Sciences, Johns Hopkins University, Baltimore, MD, United States
    We developed a physics-informed Learned Proximal Convolutional Neural Network (LP-CNN) with specialized loss function for Susceptibility Tensor Imaging (STI) reconstruction and demonstrated its feasibility with synthetic phantoms.
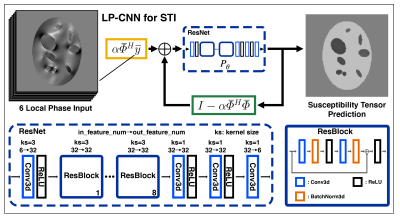
    Figure 1: Network architecture of LP-CNN. In the ResNet, there are 8 stacks of residual blocks. Each residual block contains 2 convolutional layers, 2 batch normalization layers, and 2 ReLU layers with 1 skip connection for residual learning. The forward pass of LP-CNN for STI contains 3 iterations.
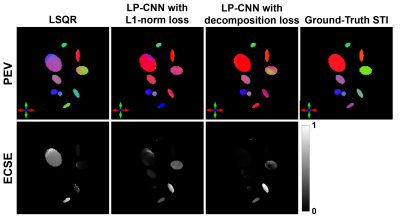
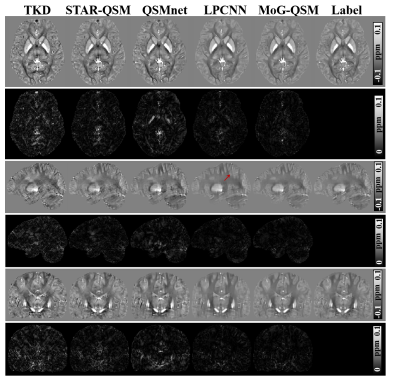
    Figure 3: Principal eigenvector (PEV) maps of the reconstructed susceptibility tensors in anisotropic regions using different methods and the associated ECSE maps. The color represents the PEV direction, and the ECSE maps show the angle difference between the reconstructed PEV and the ground-truth PEV.
  • Accelerating 3D MULTIPLEX MRI Reconstruction with Deep Learning
    Eric Z. Chen1, Yongquan Ye2, Xiao Chen1, Jingyuan Lyu2, Zhongqi Zhang3, Yichen Hu2, Terrence Chen1, Jian Xu2, and Shanhui Sun1
    1United Imaging Intelligence, Cambridge, MA, United States, 2UIH America, Inc., Houston, TX, United States, 3United Imaging Healthcare, Shanghai, China
    This is the first work applying the deep learning approach to the 3D MULTIPLEX MRI reconstruction. The proposed method shows good performance in image quality and reconstruction time.
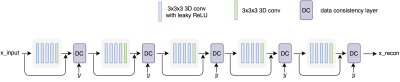
    Figure 1. The network architecture for 3D MULTIPLEX data reconstruction. The model includes five convolutional blocks and each block contains five 3D convolutional layers and one data consistency layer. The feature maps are 48 for the first four 3D convolutional layers and 2 for the last 3D convolutional layer in each block. The x, y indicate image and kspace, respectively. The real and imaginary numbers of complex values are transformed into two channels and fed into the network.
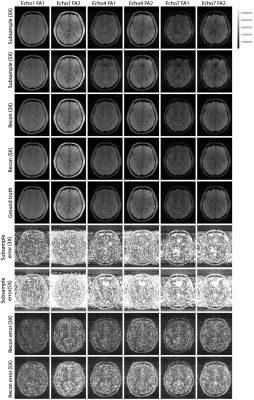
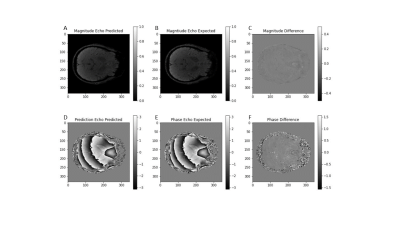
    Figure 2. Examples of reconstructed MULTIPLEX echo images by the proposed deep learning method at 3X and 5X accelerations. FA1 and FA2 indicate two different flip angle configurations. Three (Echo1, Echo4 and Echo7) out of seven echo configures are showed due to space constraints. All errors are multiplied by 50 for better visualization. The same 2D axial slice from each 3D image is plotted.
  • Accelerated cardiac T1 mapping using attention-gated neural networks
    Johnathan Le1,2, Jason Mendes2, Mark Ibrahim3, Brent Wilson3, Edward DiBella1,2, and Ganesh Adluru1,2
    1Department of Biomedical Engineering, University of Utah, Salt Lake City, UT, United States, 2Utah Center for Advanced Imaging Research, University of Utah, Salt Lake City, UT, United States, 3Department of Cardiology, University of Utah, Salt Lake City, UT, United States
    By using an attention-gated multi-layer perceptron, T1 mapping sequences can potentially be accelerated by reducing the number of T1-weighted images required to produce high-quality T1 maps.  
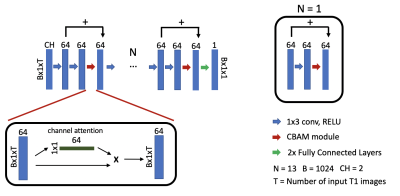
    Figure 1. Illustration of the proposed attention-gated neural network for cardiac T1 mapping. Inputs to the network have dimensions of B x CH x 1 x T. CH = 2 corresponds to T1 weighted values and their inversion times. T corresponds to the number of input T1 images and inversion times for pre-contrast (T = 5) and post-contrast (T = 4) acquisitions. B = 1024 is the batch size. Scanner generated T1 maps were used as the reference.
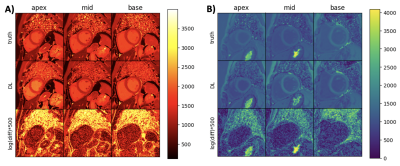
    Figure 2. Network generated T1 maps in comparison to scanner generated reference T1 maps and their corresponding difference images for (A) pre-contrast T1 maps and (B) post-contrast T1 maps from two test patients. T1 maps are shown in milliseconds.
  • 8X Accelerated Intervertebral Disc Compositional Evaluation with Recurrent Encoder-Decoder Deep Learning Network
    Aniket Tolpadi1,2, Francesco Caliva1, Misung Han1, Valentina Pedoia1, and Sharmila Majumdar1
    1Radiology and Biomedical Imaging, UCSF, San Francisco, CA, United States, 2Bioengineering, University of California, Berkeley, Berkeley, CA, United States
    A recurrent encoder-decoder network predicts T2 maps from undersampled T2 echos, allowing for eightfold reduction in quantitative MRI acquisition time while showing strong correlation to ground truth, low prediction error rates, fidelity to T2 values, and retainment of textures.
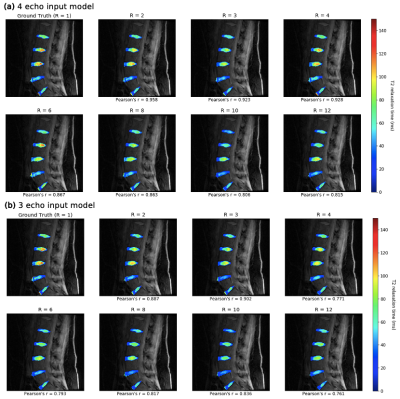
    Figure 2: Performance of 3 and 4-echo pipelines in predicting fully sampled T2 maps in an example of holdout set. Pearson’s r is calculated for each map with respect to ground truth. (a) Predicted 4-echo pipeline maps showed fidelity to ground truth up to R=6, and for (b) the 3-echo pipeline, up to R=3. Up to these acceleration factors, maps reconstitute T2 values and preserve NP/AF delineation, and can thus quantitatively assess disc health and reflect early degenerative changes.
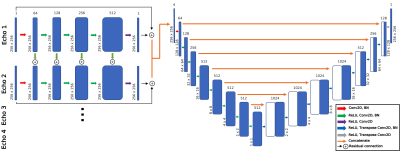
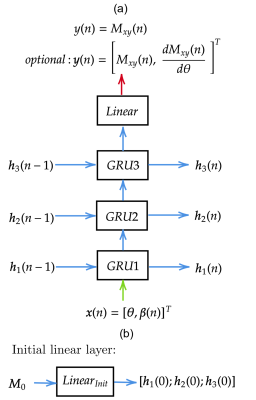
    Figure 1: Recurrent encoder-decoder architecture used to predict T2 maps from spatially undersampled MAPSS T2 echos. Initial recurrent network includes connections between processing streams of each echo to exploit temporal correlations. Subsequent encoder-decoder network exploits spatial correlation and predicts final T2 map. The network could be configured for any number of input T2 echos, but the number of filters throughout the encoder-decoder network portion are presented as for 4-echo inputs.
  • Deep Learning Reconstruction of MR Fingerprinting for simultaneous T1, T2* mapping and generation of WM, GM and WM lesion probability maps
    Ingo Hermann1,2,3, Alena-Kathrin Golla1,3, Eloy Martinez-Heras4, Ralf Schmidt1, Elisabeth Solana4, Sara Llufriu4, Achim Gass5, Lothar Schad1, Sebastian Weingärtner2, and Frank Zöllner1,3
    1Computer Assisted Clinical Medicine, Medical Faculty Mannheim, University Heidelberg, Mannheim, Germany, 2Magnetic Resonance Systems Lab, Department of Imaging Physics, Delft University of Technology, Delft, Netherlands, 3Mannheim Institute for Intelligent Systems in Medicine, Medical Faculty Mannheim, University Heidelberg, Mannheim, Germany, 4Center of Neuroimmunology, Laboratory of Advanced Imaging in Neuroimmunological Diseases, Hospital Clinic Barcelona, Universitat de Barcelona, Barcelona, Spain, 5Department of Neurology, Medical Faculty Mannheim, University Heidelberg, Mannheim, Germany
    Deep learning regression network for the reconstruction of T1, T2*, WM, GM and white matter lesion probability maps.
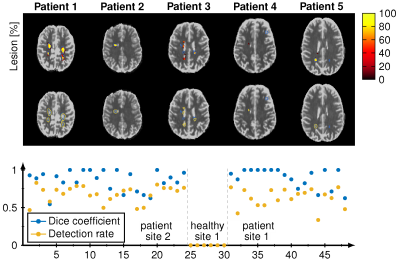
    The reconstructed lesions probability maps are overlayed on the magnitude date in color encoding for all five different patients from the test set. Manual annotation is depicted in blue. Below the probability map is binarized and depicted in yellow in addition. The dice coefficient and white matter lesion detection rate is depicted for every patient and healthy subject for both sites. The average lesions detection rate is 0.83 and dice coefficient is 0.67 for all patients.
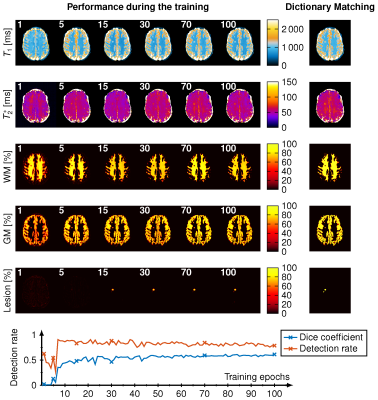
    Visualization of the reconstruction during the training. The reconstructed T1, T2*, WM-, GM and Lesion-probability maps are depicted for 1, 5, 15, 30, 70 and 100 training epochs (white number) and the dictionary matching reference maps are shown on the right side. On the bottom the Dice coefficient (blue) and the lesion detection rate (orange) is depicted over the 50 training epochs.
  • The sensitivity of classical and deep image similarity metrics to MR acquisition parameters
    Veronica Ravano1,2,3, Gian Franco Piredda1,2,3, Tom Hilbert1,2,3, Bénédicte Maréchal1,2,3, Reto Meuli2, Jean-Philippe Thiran2,3, Tobias Kober1,2,3, and Jonas Richiardi2
    1Advanced Clinical Imaging Technology, Siemens Healthineers, Lausanne, Switzerland, 2Department of Radiology, Lausanne University Hospital and University of Lausanne, Lausanne, Switzerland, 3LTS5, Ecole Polytechnique Fédérale de Lausanne, Lausanne, Switzerland
    Perceptual loss is correlated with L1 distance and outperforms other metrics in detecting changes in acquisition parameters. Segmentation loss is poorly correlated with other metrics, suggesting that maximizing these similarity metrics is not sufficient to harmonize data.
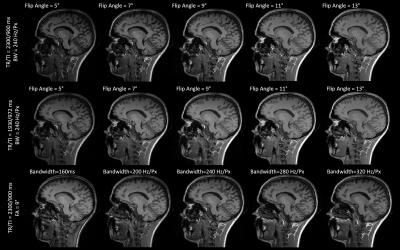
    Figure 1. Contrasts obtained from fourteen different MPRAGE protocols in one example subject. Five equally spaced flip angles were investigated (between 5° and 13°) for two different combinations of repetition and inversion times (TR/TI = 2300/900 ms and 1930/972 ms). Five equally spaced read-out bandwidths were also investigated (between 160 and 320 Hz/Px) for TR/TI=2300/900 ms.
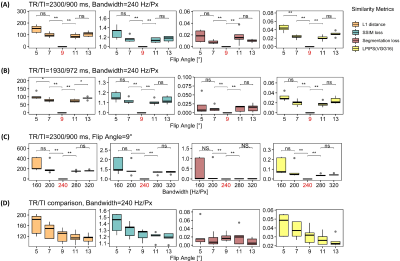
    Figure 2. Variation of similarity losses in four experimental scenarios shown in Table 2. SSIM loss is defined as the inverse of SSIM. Segmentation loss is defined as the relative absolute error in the thalamus volume estimation. LPIPS(VGG16) represents a learned similarity metric based on a perceptual loss. Highlighted x-axis ticks indicate the corresponding reference image. *: p < 0.05, **: p < 0.01, ***: p < 0.001
Back to Top
Digital Poster Session - Modelling, Reconstruction & Processing in Low-Field MRI & PET-MRI
Acq/Recon/Analysis
Tuesday, 18 May 2021 17:00 - 18:00
  • MR-based motion correction and anatomical guidance for improved PET image reconstruction in cardiac PET-MR imaging
    Camila Munoz1, Sam Ellis1, Stephan G Nekolla2, Karl P Kunze1,3, Teresa Vitadello4, Radhouene Neji1,3, René M. Botnar1, Julia A. Schnabel1, Andrew J. Reader1, and Claudia Prieto1
    1School of Biomedical Engineering and Imaging Sciences, King's College London, London, United Kingdom, 2Nuklearmedizinische Klinik und Poliklinik, Technische Universitat Munchen, Munich, Germany, 3MR Research Collaborations, Siemens Healthcare Limited, Frimley, United Kingdom, 4Department of Internal Medicine I, University hospital rechts der Isar, Technical University of Munich, Munich, Germany
    We introduce a cardiac PET-MR image reconstruction framework that uses high quality diagnostic MR images and MR-derived motion fields to enable PET motion correction and anatomical guidance, resulting in sharper, noise-suppressed cardiac PET images.
    Fig 2. Comparative reconstruction methods for two oncology patients alongside corresponding CMRA images. Aligning the scanner-provided μ-map to the CMRA image removes a defect mimicking artefact in P1 (magenta arrows), while applying motion compensation improves contrast and sharpness in the inferior myocardium (blue arrows). Using either unguided or MR-guided regularization (β=400) reduces noise, however MR-guidance results in better edge-preservation and contrast (green arrows).
    Fig 4. Example short-axis views of the reconstructed PET images for two cardiac patients, and corresponding 2D LGE images showing the extent of myocardial scarring. Using the proposed MC-guided MAPEM (with automatic β selection) method improves image quality while maintaining the appearance of myocardial defects (cyan arrows). Note that LGE images are shown only for comparison and did not provide any information for the MR-guided PET reconstructions, which instead used high resolution CMRA images (also shown here).
  • Impact of motion on simultaneously acquired PET/MRI of myocardial infarcted heart.
    Heeseung Lim1, Benjamin Wilk 1,2, Jane Sykes 1, John Butler 1, Gerald Moran3, Jonathan Thiessen1,2, Gerald Wisenberg1,4, and Frank S Prato1,2
    1Lawson Health Research Institute, London, ON, Canada, 2Medical Biophysics, Western University, London, ON, Canada, 3Siemens Healthcare Limited, Oakville, ON, Canada, 4MyHealth Centre, Arva, ON, Canada
    This study investigates the impact of motion in simultaneously acquired myocardial PET/MRI data and finds a significant discrepancy in functional data between registered to post-mortem images to non-registered images. 
    Comparison of net influx rate (Ki) between original dynamic PET data and transformed dynamic PET data. Heart polar-map comparison is shown in a) & b). Correlation scatter plot shows significant correlation with correlation coefficient = 0.959 in c).
    Comparison of net influx rate (Ki) between original and transformed images at 4 different segments (left anterior descending artery, left circumflex artery, right coronary artery, apex) of heart and 3 different time points (before the lipid infusion, during the lipid infusion and after the lipid infusion).
  • High resolution PET image denoising using anatomical priors by K-nearest neighborhood method in the feature space
    Mehdi Khalighi1, Timothy Deller2, Kevin Chen1, Tyler Toueg3, Dawn Holley1, Kim Halbert1, Floris Jansen2, Elizabeth Mormino3, Michael Zeineh1, Farshad Moradi1, Greg Zaharchuk1, and Andrei Iagaru1
    1Radiology, Stanford University, Stanford, CA, United States, 2Engineering Dept., GE Healthcare, Waukesha, WI, United States, 3Neurology, Stanford University, Stanford, CA, United States
    A new filtering method for PET images is proposed that exploits the correlation between voxels from the same tissue in addition to the correlation between neighboring voxels. Similar voxels within the PET volume are identified using KNN method in the feature-space built by anatomical priors. 
    Fig 3. Comparison of PET images with both conventional & proposed denoising methods. The images are reconstructed using TOF-OSEM with 1mm isotropic resolution. Top row images are filtered by a Gaussian filter with 4mm cut off freq. Bottom row images are filtered with the proposed method using anatomical priors. A neighborhood within 3 mm radius around each voxel was searched to find the 25 nearest neighbors. A Gaussian filter with 2mm spatial cut-off freq. was then applied to remove any remaining high freq. noise. The KNN and the Gaussian filter were applied 2 times iteratively.
    Fig 4. Comparison of PET images with conventional and proposed denoising methods on a prostate cancer subject imaged with 5 mCi of PSMA. The PET images are reconstructed using TOF-OSEM with 1mm isotropic resolution. Top row images are filtered by a Gaussian filter with 4mm cut off freq. Bottom row images are filtered with the proposed method using anatomical priors. A neighborhood within 3 mm radius around each voxel was searched to find the 25 nearest neighbors of that voxel. A Gaussian filter with 2mm spatial cut-off frequency was then applied to remove any remaining high frequency noise.
  • Free-Breathing MR-based Attenuation Correction for Whole-Body PET/MR Exams
    Patrick Korf1, Wolfgang Thaiss2, Ambros J. Beer2, Meinrad Beer3, Dominik Nickel1, and Thomas Vahle1
    1Siemens Healthcare GmbH, Erlangen, Germany, 2Department of Nuclear Medicine, University Hospital Ulm, Ulm, Germany, 3Department of Diagnostic and Interventional Radiology, University Hospital Ulm, Ulm, Germany
    We developed a free-breathing attenuation correction method based on 2pt Dixon for whole-body PET/MR exams. In addition to the attenuation map, high resolution Dixon images are generated. Initial results are presented.
    Figure 1: Comparison of whole-body attenuation maps of a healthy volunteer. Left: Breath-hold protocol. Right: Free-breathing protocol. The first two bed positions were acquired in breath-hold and free-breathing respectively. The last bed position was acquired using the breath-hold protocol without breath-hold command. In both cases the attenuation map consisting of five compartments (air, lung tissue, soft tissue, fat tissue and bone) could be generated successfully. The truncated arms were recovered as well as described in [2].
    Figure 2: Comparison of Dixon image quality. Left Column: Dixon water, acquisition with breath-hold protocol. Right Column: Dixon water, free-breathing acquisition. Free-breathing images show a more distinct boundary of the liver dome and appear to be sharper in the coronal and sagittal reformats (middle and bottom rows). The image quality in the axial plane (top row) is comparable. Images were acquired after a clinical study, Gadovist was given as part of the scan protocol prior to the shown acquisitions.
  • First-Principle Image SNR Synthesis Depending on Field Strength
    Charles McGrath1, Mohammed M Albannay1, Alexander Jaffray1, Christian Guenthner1, and Sebastian Kozerke1
    1Institute for Biomedical Engineering, University and ETH Zurich, Zurich, Switzerland
    We developed a synthetic MR image generator based on first principles to compare SNR at various fields. Findings show that SNR can deviate significantly from commonly used SNR scaling laws, specifically when acquisition times are short relative to RF pulse durations.
    Figure 3: (A-F) show images generated at three field strengths when no restriction is put on the repetition time. (A,D): TR=7ms,FA=60,SNR$$$\approx$$$6 (B,E):TR=6ms,FA=50,SNR$$$\approx$$$10 (C,F):TR=5ms,FA=30,SNR$$$\approx$$$14 (G-L) are generated with repetition time restricted such that the intra-TR phase wrap is no more than $$$\pi/3$$$ with an inhomogeneity of 0.5ppm. (G,J): same as A (H,K):same as B (I,L):TR=4ms,FA=23,SNR$$$\approx$$$5 (G-L) A significant decrease can be seen in the SNR at 3T due to this restriction.
    Figure 5: Optimized SNR plots for both the unrestricted case (left) and case where TR is restricted such that banding is limited to $$$\pi/3$$$ (right). Both plots also show the expected scaling according to coil dominated and noise dominated SNR scaling laws. Note that bandwidth (BW) changes with the optimization. In both cases SNR scales better than the linear case at low fields. These results also approximately match the images generated in Figure 3, with a drop in SNR seen in the restricted case at 3T.
  • Development of a Numerical Bloch Solver for Low-Field Pulse Sequence Modeling
    John Adams1,2, William Handler1,2, and Blaine Chronik1,2
    1Department of Physics and Astronomy, Western University, London, ON, Canada, 2xMR Labs, London, ON, Canada
    Renewed interest in clinical low-field MR systems has opened up a new design space for MR pulse sequence design. To explore these opportunities, and to better inform hardware design, we are developing a flexible simulation tool based on a numerical simulation of the Bloch equations. This tool will both be able to model pulse sequences under the influence of realistic applied fields, and account for changes in relaxation time due to changes in field strength. This abstract presents our work to date in developing this tool; initial validation has been performed using a series of simple NMR sequences including stimulated echoes and a CPMG train. Both these sequences produced realistic results which show that the core of our simulation tool accurately simulates an MR experiment.
    Figure 1 - Simulated CPMG Signal
    Figure 2 - Simulated Stimulated Echo Signal
  • Automatic Quantitative Analysis of Low-field Infant Brain MR Images
    Bo Peng1,2,3, Baohua Hu1,2,3, Mao Sheng4, Yuqi Liu4, Zhongchang Miao5, Zijun Dong6, Jian Bao7, SiSeung Kim7, Bing Keong Li7, and Yakang Dai1,2,3
    1Suzhou Institute of Biomedical Engineering and Technology, Chinese Academy of Sciences, Suzhou, China, 2Suzhou Key Laboratory of Medical and Health Information Technology, Suzhou, China, 3Jinan Guoke Medical Engineering Technology Development co., Ltd., Jinan, China, 4Department of Radiology, Children’s Hospital of Soochow University, Suzhou, China, 5Department of Radiology, The First People’s Hospital of Lianyungang, Jiangsu Province, China, 6Department of Medical Imaging, Lianyungang Women and Children Hospital and Health Institute, Jiangsu Province, China, 7Jiangsu LiCi Medical Device Co., Ltd., Lianyungang, China
    Low-field MRI is foreseeable as a safer system for infants. We developed an automated image processing method. It is also capable to automatically construct the surfaces of the cerebral cortex and provides automatic quantitative analysis of selected region of interest.
    Figure 2. Original, preprocessed, extracted brain images of infants at various age month. Top row shows the original T1W images at 0.35T. Middle row shows preprocessed images after de-nosing and N3 bias correction. Bottom row shows the extracted brain with the skull removed.
    Figure 5. Quantitative calculation results of ROI volume, cortical thickness after brain labeling. (a) Automated labeling results on voxel-wise image (hippocampus). (b) Quantitative calculation of hippocampus volume for five cases. (c) Labeling ROIs on cortical surface on surface-based (superior frontal gyrus (dorsal)). (d) Cortical thickness for superior frontal gyrus (dorsal) of different cases.
  • Low-field MR imaging using multiplicative regularization
    Merel de Leeuw den Bouter1, Martin van Gijzen1, and Rob Remis2
    1Delft Institute of Applied Mathematics, Delft University of Technology, Delft, Netherlands, 2Circuits and Systems, Delft University of Technology, Delft, Netherlands
    We present an image reconstruction approach that incorporates regularization by multipliying the data-fidelity term by a total variation functional, thereby eliminating the need of a regularization parameter. We apply the method in a low-field MR setting, where it yields promising results.
    Algorithm results.
    The algorithm progressively denoises the image.
  • Unsupervised Denoising for Low-field Diffusion MRI
    Jo Schlemper1, Neel Dey2, Seyed Sadegh Mohseni Salehi1, Carole Lazarus1, Rafael O'Halloran1, Prantik Kundu1,3, and Michal Sofka1
    1Hyperfine Research Inc., Guilford, CT, United States, 2New York University, New York, NY, United States, 3Icahn School of Medicine at Mount Sinai, New York, NY, United States
    An unsupervised deep learning framework is proposed for denoising low-field 64 mT diffusion-weighted MRI images (DWI), which enables denoising correlated noise without ground truth, leading to improved DWI quality as measured by expert evaluation
    Figure 1: The summary of the proposed approach. (a) The training data is generated by creating a pair of original noisy and noisier images. The additional noise is simulated by simply feeding the raw data with higher noise to the reconstruction pipeline. (b) Once the pair is generated, the noisier images are fed to U-net like architecture to regress noisy images.
    Figure 3: The reconstructions for DWI images for b=890 for a patient with pathology. The residual maps show the difference between noisy and the denoised images, highlighting the content that was removed. Both proposed and BM3D showed effectiveness, however, the proposed approach was able to preserve sharpness better.
  • Correction of Image Distortions Arising from RF Encoding with Nonlinear Fields
    Paul Wang1, Michael Mullen2, Lance DelaBarre2, and Michael Garwood2
    1Center for Magnetic Resonance Research and Department of Biomedical Engineering, University of Minnesota, Minneapolis, MN, United States, 2Center for Magnetic Resonance Research and Department of Radiology, University of Minnesota, Minneapolis, MN, United States
    Image distortions in RF-encoded MRI can be corrected by modeling the spatially-dependent Bfield of the RF transmitter coil as a sum of linear and nonlinear components, and adapting a mathematical framework used to correct image distortions arising from B0 nonlinearity in standard MRI. 
    Figure 1: Illustration of nonlinearity arising from B1 gradients. (a) Standard MRI phase encoding gradients are built to be linear in amplitude and phase. (b) Example nonlinear B1 gradient generated by single loop surface coil is nonlinear in amplitude and phase.
    Figure 3: Nonlinear RF gradient encoding leads to geometric and intensity distortions in the image, which can be corrected. (a) Numerical phantom plotted with linear and nonlinear RF gradients. (b) Fourier reconstruction of Bloch simulation using linear RF gradient shows no distortions whereas nonlinear RF gradient encoding does. (c) Geometric distortions are corrected using interpolation. (d) Intensity distortion is corrected by Jacobian scaling.
  • Deep learning for fast 3D low field MRI
    Reina Ayde1, Tobias Senft1, Najat Salameh1, and Mathieu Sarracanie1
    1Center for Adaptable MRI Technology (AMT Center), Department of Biomedical Engineering, University of Basel, Allschwil, Switzerland
    Deep learning enables 5-fold undersampling of low field (0.1 T) 3D MR images while maintaining anatomical structure and preserving contrast in both retrospective and prospective, acquired data.
    Figure 2: Prospective undersampling. Two examples of a) fully sampled images, b) corresponding prospectively undersampled images, c) U-net reconstructed images, and d) squared error of reconstructed images using U-net versus fully sampled image.
    Figure 1: Retrospective undersampling. Two examples of a) fully sampled images, b) corresponding retrospectively undersampled images, c) U-net reconstructed images, and d) squared error of reconstructed images using U-net versus fully sampled image.
  • CONN-NLM: a novel CONNectome-based Non-Local Means filter for PET-MRI denoising
    Zhuopin Sun1, Steven Meikle2,3, and Fernando Calamante1,3,4
    1School of Biomedical Engineering, The University of Sydney, Sydney, Australia, 2Faculty of Medicine and Health, The University of Sydney, Sydney, Australia, 3Brain and Mind Centre, The University of Sydney, Sydney, Australia, 4Sydney Imaging, The University of Sydney, Sydney, Australia
    The proposed CONNectome-based Non-Local Means (CONN-NLM) exploits synergies between diffusion MRI-derived structural connectivity and PET intensity to denoise PET data. CONN-NLM can improve the overall PET image quality in gray matter and to enhance lesion contrast-to-noise ratio. 
    Fig. 2. A) Illustration of proposed connectome-based NLM filter. The filtered value for any given voxel is computed by a weighted value for every brain voxel. This weighting is based on voxel-wise PET intensity similarity3 and connectivity strengths between each pair of parcellations (coloured cubes). B) Top: schematic demonstration of computation of intensity similarity matrix, distant and local connectivities. These 3 matrices are combed to form the total weight. Bottom: a realistic example.
    Fig. 3. A) Ground-truth simulated PET phantom and AAL parcellations10. B-D) Left: PET image; right: intensity difference relative to ground-truth, calculated based on grey matter only. B) Reconstructed PET image with noise. C) Smoothing performed by non-local means filter without connectivity information.11 D) Smoothing performed by the proposed CONN-NLM filter.
  • Generalizing Ultra-low-dose PET/MRI Networks Across Radiotracers: From Amyloid to Tau
    Kevin T. Chen1, Olalekan Adeyeri2, Tyler N Toueg3, Elizabeth Mormino3, Mehdi Khalighi1, and Greg Zaharchuk1
    1Radiology, Stanford University, Stanford, CA, United States, 2Salem State University, Salem, MA, United States, 3Neurology and Neurological Sciences, Stanford University, Stanford, CA, United States
    We aimed to investigate whether a pre-trained ultra-low-dose amyloid PET/MRI network could generalize to ultra-low-dose tau PET image enhancement. Results showed that data bias needs to be accounted for before applying an ultra-low-dose network trained on one tracer to another.
    Figure 2. Representative tau PET images and their corresponding T1-weighted MR image in a patient with significant cortical uptake. The synthesized PET images show greatly reduced noise compared to the low-dose PET image, while the images generated from the Tau Network and the Fine-tuned Network were superior in reflecting the underlying anatomical patterns of the tau tracer uptake. The image obtained directly from the Amyloid Network performed less well, with more image blurring.
    Figure 1. A schematic of the CNN used in this work and its input and output channels. The arrows denote computational operations and the tensors are denoted by boxes with the number of channels indicated above each box.
  • Ablation Studies in 3D Encoder-Decoder Networks for Brain MRI-to-PET Cerebral Blood Flow Transformation
    Ramy Hussein1, Moss Zhao1, Jia Guo2, Kevin Chen1, David Shin3, Michael Moseley1, and Greg Zaharchuk1
    1Radiology, Stanford University, Stanford, CA, United States, 2Bioengineering, University of California, Riverside, Riverside, CA, United States, 3Neuro MR, GE Healthcare, Menlo Park, CA, United States
    This work demonstrates that a 3D convolutional encoder-decoder network integrating multi-contrast information from brain structural MRI and ASL perfusion images can synthesize high-quality PET CBF maps. 
    Figure 3. Examples of reference PET CBF and corresponding synthetic CBF maps generated with different loss functions and network settings.
    Figure 1. Our 3D convolutional encoder-decoder network for predicting PET CBF maps from multi-contrast MRI scans.
  • Development and Evaluation of a software for Parametric Patlak mapping using PET/MRI input function (CALIPER).
    Praveen Dassanayake1,2, Lumeng Cui3, Elizabeth Finger2,4, Andrea Soddu5,6, Bjoern Jakoby7, Keith St. Lawrence1,2, Gerald Moran8, and Udunna Anazodo1,2
    1Department of Medical Biophysics, University of Western Ontario, London, ON, Canada, 2Lawson Health Research Institute, London, ON, Canada, 3Division of Biomedical Engineering, University of Saskatchewan, Saskatoon, SK, Canada, 4Department of Clinical Neurological Sciences, University of Western Ontario, London, ON, Canada, 5Brain and Mind Institute, University of Western Ontario, London, ON, Canada, 6Department of Physics and Astronomy, University of Western Ontario, London, ON, Canada, 7Department of Physics, University of Surrey, Guildford, United Kingdom, 8Siemens Healthineers, Oakville, ON, Canada
    Parametric Patlak mapping using positron emission tomography/magnetic resonance imaging input function tool can extract reliable image derived input function in animal and human models that can potentially be applied clinically for non-invasive tracer kinetic modelling.
    Figure 1. CALIPER’s (A). Graphical user interface consisting (B). PET vessel accumulation, (C) and (D) MRI vessel segmentation prior to (E). co-registration, selection of a region of interest from internal carotid arteries and extracting a (F). IDIF corrected for PVE and spill-in contamination.
    Figure 3. (A) IDIFs generated using TOF MR images and AIF of a healthy human control indicating the shape of the entire curve and the initial peak from 0 to 1000 s. (B). Two-sample t-test indicates no significant changes in the ratio of AUC between IDIF and PBAIF for IDIFs generated using TOF and MPRAGE MRI vessel masks.
  • Comparison of deformable registration techniques for real-time MR-based motion correction in PET/MR
    Thibault Marin1, Yanis Djebra1,2, Paul Han1, Vanessa Landes3, Yue Zhuo1, Kuan-Hao Su4, Georges El Fakhri1, and Chao Ma1
    1Massachusetts General Hospital, Harvard Medical School, Boston, MA, United States, 2LTCI, Telecom Paris, Institut Polytechnique de Paris, Paris, France, 3GE Healthcare, Boston, MA, United States, 4GE Healthcare, Waukesha, WI, United States

    Physiological motion during PET/MR acquisition can significantly degrade the diagnostic value of PET images. We evaluate three image motion estimation packages for kidney imaging in presence of irregular breathing motion, for application in motion-corrected PET reconstruction.

    Figure 2. Comparison of registration methods. The left column shows the MR target and reference bins. Top row images are deformations (Def.) of the reference bin image to match the target bin using different image registration tools. Bottom row images represent the difference (Diff.) between the true MR target bin and the deformed images from the top row. The Q.Freeze2 registration results in lower residual error than MIRT and elastix.
    Figure 4: Residual error between warped and original MR bins. The left column shows the regions of interest (ROI) considered. The center and right columns show the normalized root mean squared error (NRMSE) as a function of the target bin for each ROI. The shaded region around the curves corresponds to three standard deviations, estimated via bootstrap of the ROI pixels. Q.Freeze2 results in lower error, especially for bins further from the reference bin (i.e. bin 12).
  • A registration approach for cardiac PET/CT and MR images
    Xiaomeng Wu1, Shuai Liu1, Li Huo2, Xihai Zhao3, and Fei Shang1
    1Department of Biomedical Engineering, School of Life Science, Beijing institute of technology, beijing, China, 2Department of Nuclear Medicine, Peking Union Medical College Hospital, Chinese Academy of Medical Sciences & Peking Union Medical College, Beijing, China, 3Department of Biomedical Engineering, Center for Biomedical Imaging Research, Tsinghua University School of Medicine, Beijing, China
    In the present study, a solution for multi-modality images registration was proposed by combining global registration and local registration.