-
Nonlinear projection imaging with the Bloch-Siegert shift in an inhomogeneous B0 at low-field
Kartiga Selvaganesan1, Yonghyun Ha2, Basong Wu2, Kasey Hancock3, Charles Rogers III2, Sajad Hosseinnezhadian2, Gigi Galiana2, and Todd Constable2
1Biomedical Engineering, Yale University, New Haven, CT, United States, 2Radiology and Biomedical Imaging, Yale University, New Haven, CT, United States, 3Electrical Engineering, Yale University, New Haven, CT, United States
This work
shows that the Bloch-Siegert shift, which provides an RF alternative to spatial
encoding with gradient coils, can be used to image in a low-field, open MRI system.
We present a new approach to evaluate and optimize nonlinear RF encoding
schemes generated by transmit phased arrays.
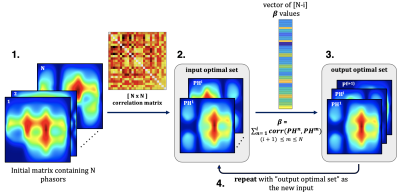
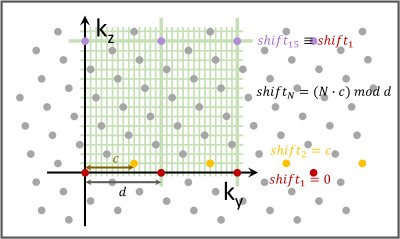
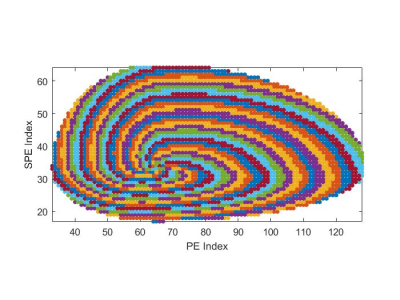
Figure 3.
The correlation between pairs of phasors was calculated for the initial set of
N phasors (1). The phasors with the smallest correlation was added to
the "input optimal set" (2).
The sum of correlations squared was calculated between
the remaining $$$(N-i)$$$ phasors, and the phasors in the "input optimal set", for a total of
$$$(N-i)$$$ β values.
The phasor with the smallest $$$β$$$ value was then added to the "output optimal set" (3).
The ”output optimal set” became the new input, and steps 2 and 3 were repeated
until the final optimal set contained the desired number of phasors (4).
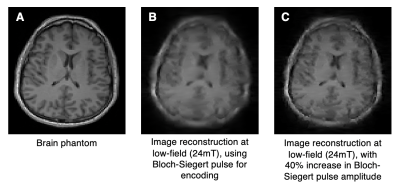
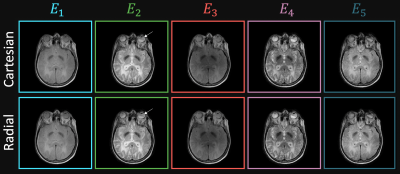
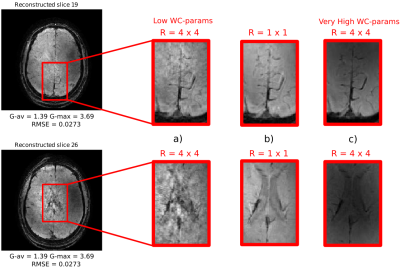
Figure 5. Brain images reconstructed from the simulated phasor patterns. Image
reconstruction was performed using 128 encoding patterns in a 128x128 matrix.
The overall image resolution is improved by applying a higher Bloch-Siegert
pulse amplitude (C vs. B).
-
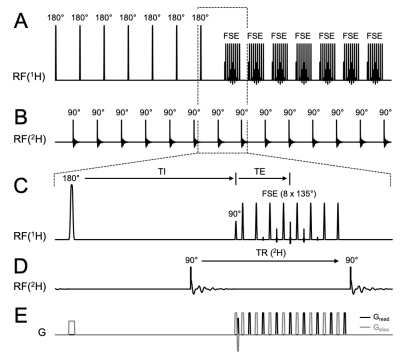
B1-gradient based MRI using Frequency-modulated Rabi Encoded Echoes (FREE)
Efraín Torres1,2, Taylor Froelich2, Lance DeLaBarre2, Michael Mullen2, Gregory Adriany2, Alberto Tannús3, Daniel Cosmo Pizetta3, Mateus Jose Martins3, and Michael Garwood2
1Biomedical Engineering, University of Minnesota, Minneapolis, MN, United States, 2Center for Magnetic Resonance Research, University of Minnesota, Minneapolis, MN, United States, 3Centro de Imagens e Espectroscopia por Ressonância Magnética - CIERMag - Sao Carlos Physics, São Carlos, Brazil
Here, a B1-encoding approach is presented that allows for phase-encoding without the use of B0 gradient coils. This presents the possibility of designing systems without B0 gradient coils, greatly reducing cost and increasing portability.
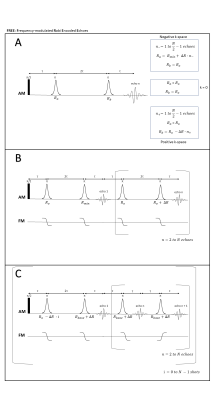
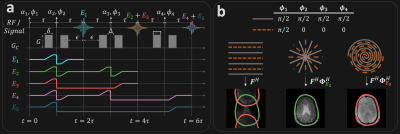
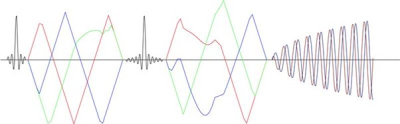
Fig. 1a) Multi-shot approach of FREE 1b) is a
single-shot approach. First double spin-echo pair has the greatest R-difference.
Subsequent π pulse pairs have a
difference of exactly ∆R incrementally
adding phase at each echo acquired. 1c) Multi-shot version of FREE, in
which all (odd and even) echoes are acquired. All pulses, except for the first, have Rbase +
∆R, where Rbase is any adiabatic R value. Further shots reduce the R value of the first pulse (Ro) by integer values of ∆R. The k-space
matrix is created by concatenating the data columns (shot number) with rows as
echo number.
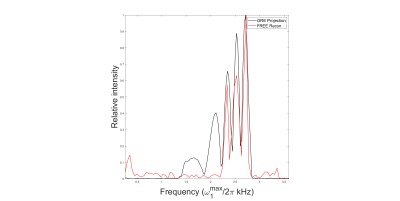
Phantom is a NMR tube with ~15 cm water doped with copper sulfate. Structure
was created in the phantom by purposefully creating a flip angle range. Comparison
of the GRE projection and FREE reconstruction. The x-axis represents nutation
frequency which has positional dependence due to the surface coil’s B1
gradient. The plane of surface coil is located on the right where
is the largest. Linearity of the B1
gradient decreases with distance from the coil. Good agreement between GRE and
FREE reconstructions is achieved except at the deeper location.
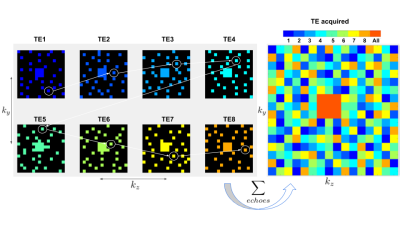
-
Rapid simultaneous T1 and T2 quantification (RAS-Q T1T2) of the myocardium using transient bSSFP with variable flip angles
Céline Marquet1,2,3, Jihye Jang1,2,4, Andrew J. Powell1,2, and Mehdi H. Moghari1,2
1Department of Pediatrics, Harvard Medical School, Boston, MA, United States, 2Department of Cardiology, Boston Children's Hospital, Boston, MA, United States, 3Department of Informatics, Technical University Munich, Munich, Germany, 4Philips Healthcare, Boston, MA, United States
RAS-Q T1T2 combines
transient bSSFP with variable flip angles for simultaneous myocardial T1
and T2 quantification at a rapid scan time (≤ 4s). It shows accurate
T2 quantification, lower T2 precision, and lower T1
accuracy and precision.
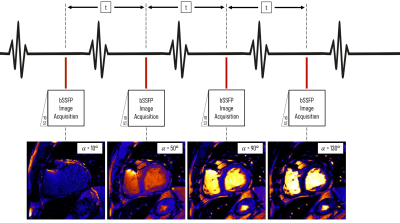
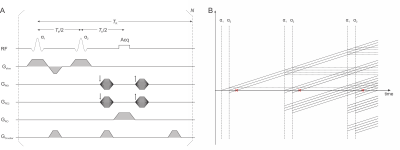
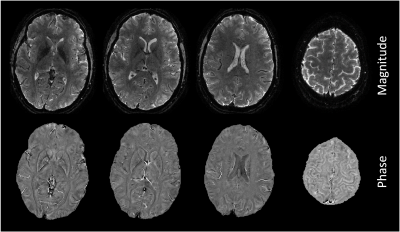
Figure 1: RAS-Q T1T2
pulse sequence acquisition scheme. Four images are
acquired in the same diastolic phases within 4 consecutive heartbeats (t). Each
image is acquired with a different flip angle (α = [10°, 50°, 90°, 130°]) after
ten linear startup pulses (ST). All further sequence parameters are kept
constant (TR/TE: 2.96/1.48ms, CS-SENSE: 3). Image
acquisition is performed during breath-hold in ≤4s.
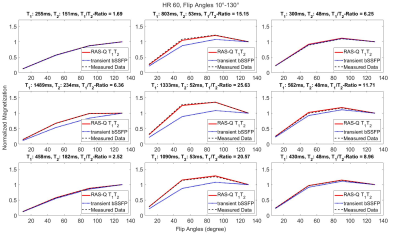
Figure
2: Magnetization
curves for different T1/T2 ratios. Graphs show
normalized magnetization evolution over flip angles from 10°-130° for 9
different tubes of the T1MES phantom.15 Measured mean pixel
intensity (black, dashed curves) is compared to theoretical values of RAS-Q T1T2
(red curve) and the transient bSSFP function (blue, dotted curves). Results are
depicted for heartrate 60bpm. Measured RAS-Q T1T2 pixel
intensities demonstrate a close alignment to expected theoretical values over
different T1/T2 ratios and heartrates.
-
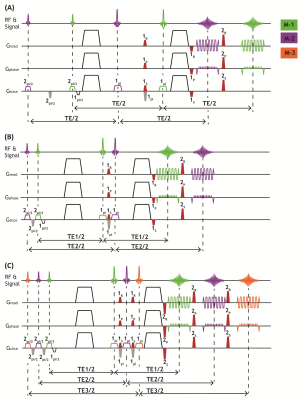
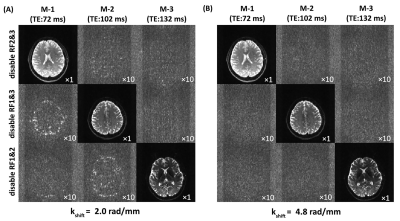
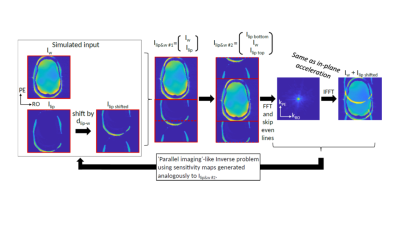
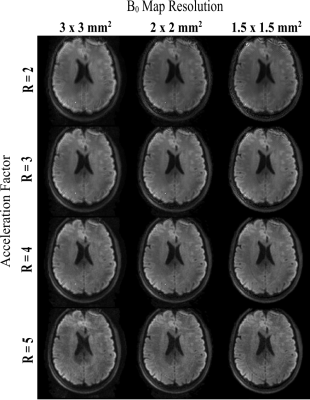
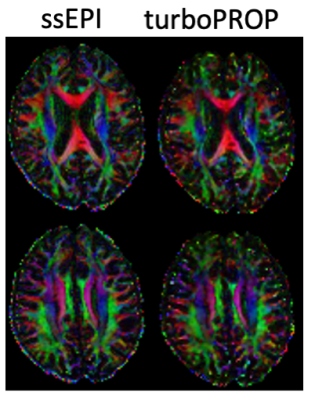
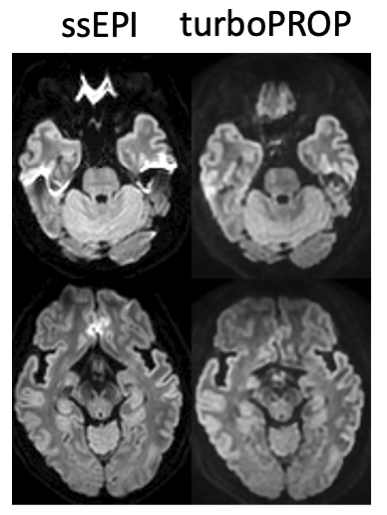
Susceptibility artifact-insensitive ultrafast 3D gradient-echo imaging by combination of head-tilting and ERASE acquisition
Jaeyong Yu1,2, Seulki Yoo1,2, Jae-Kyun Ryu3, Seung-Kyun Lee1,2,4, and Jang-Yeon Park1,2,3
1Department of Biomedical Engineering, Sungkyunkwan University, Suwon, Korea, Republic of, 2Department of Intelligent Precision Healthcare Convergence, Sungkyunkwan University, Suwon, Korea, Republic of, 3Biomedical Institute for Convergence at SKKU, Sungkyunkwan University, Suwon, Korea, Republic of, 4Center for Neuroscience Imaging Research, Institute for Basic Science (IBS), Suwon, Korea, Republic of
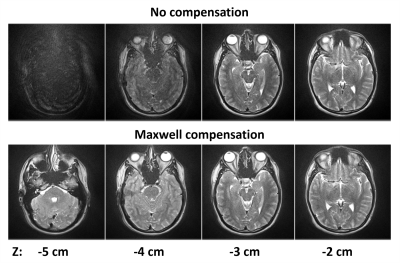
We
proposed a new method for ERASE sequence with head-tilted scan to
improve B0 inhomogeneity in comparison with gradient-echo
EPI.
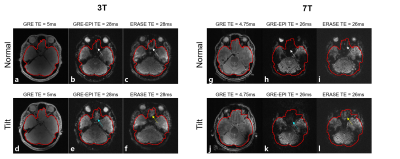
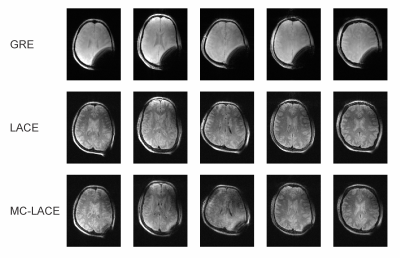
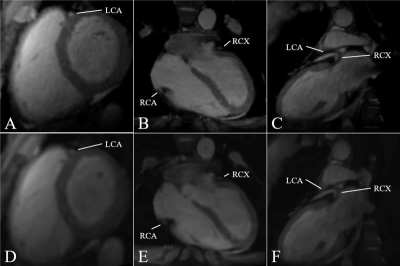
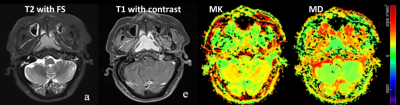
Figure 3. Axial views of the
reference GRE magnitude, EPI and ERASE images for a single subject. The solid
red lines indicate the manually drawn masks as a guide for
comparison of image quality. Signal loss and image degradation in prefrontal
cortex of the normal-orientation scans (white arrows) are reduced in
tilted scans (blue arrows and yellow arrows).
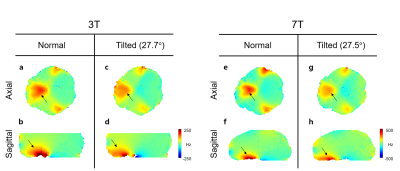
Figure 2. Measured B0 maps at normal and tilted head
orientations at 3T and 7T. Black arrows indicate B0 inhomogeneity near the prefrontal
region. In head-tilted scan (c-d, g-h), B0 field distribution is spread more indicating that
local gradient is smaller
than the normal orientation scan (a-b, e-f).
-
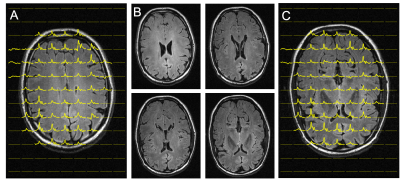
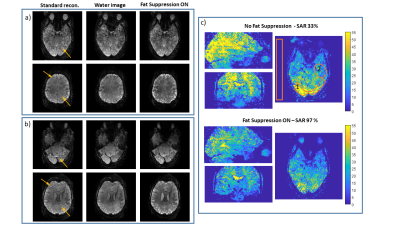
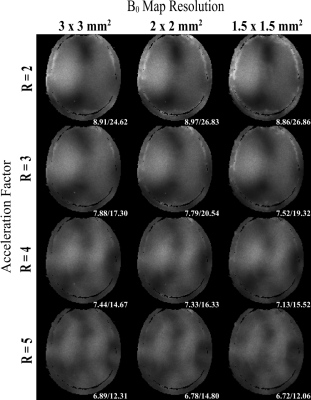
Optimization of Flip Angle and RF Pulse Phase in MP-SSFP for MRI in Inhomogeneous Magnetic Fields
Naoharu Kobayashi1 and Michael Garwood1
1CMRR, Radiology, University of Minnesota, Minneapolis, MN, United States
Flip angle and RF phase in MP-SSFP were
numerically optimized. The optimal RF setting improved SNR under the fixed SAR
conditions and provided strong image contrasts in brain tissues with linear
gradient inhomogeneous fields at 3T.
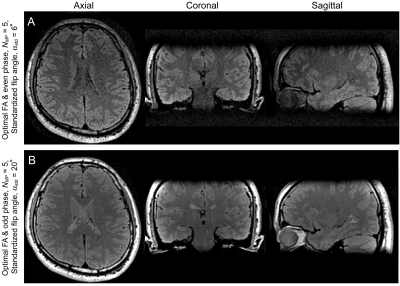
Figure
5. Brain MP-SSFP
images with 1.5-mm isotropic resolution. Images acquired with αstd = 6º, optimal flip angle and even
phase (A) provided stronger image contrasts between gray and white matter as
compared to those with αstd=20º, optimal flip angle and odd
phase (B), but as predicted in simulation and phantom experiments, the noise
level is noticeably higher in the images acquired with αstd=6º.
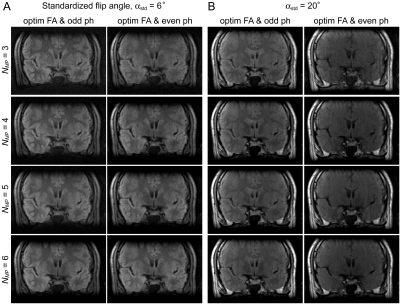
Figure
3. Brain MP-SSFP
images acquired with αstd=6º (A) and 20º (B). With αstd=6º, strong image contrasts between
gray and white matters were detected, which is consistent in even and odd RF
phase images. With αstd=20º, odd RF phase provided
stronger image contrasts in brain tissues than even RF phase. Although SNR
increased along with an increase of NMP,
image contrasts were consistent in each RF pulse setting.
-
Spectro-Dynamic MRI: Characterizing Bio-Mechanical Systems on a Millisecond Scale
Max H. C. van Riel1,2, Niek R. F. Huttinga1, and Alessandro Sbrizzi1
1Department of Radiotherapy, Computational Imaging Group for MR diagnostics and therapy, UMC Utrecht, Utrecht, Netherlands, 2Department of Biomedical Engineering, Medical Image Analysis, Eindhoven University of Technology, Eindhoven, Netherlands
We propose
spectro-dynamic MRI as a method for the characterization of dynamical systems
directly from k-space data. A measurement model and dynamical model are used to
estimate the motion fields and dynamical parameters of the system at a
millisecond time scale from heavily undersampled data.
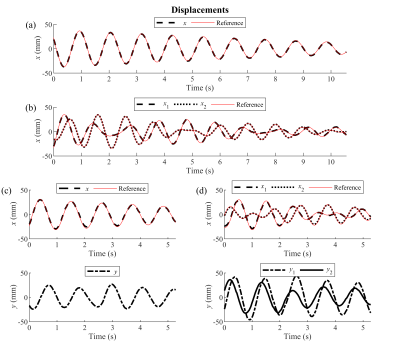
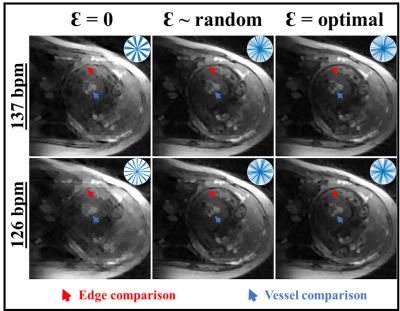
Figure 3: The
estimated displacements. The black lines indicate the estimated displacements
for the experiments with (a) a simple pendulum, (b) coupled pendula, (c) a
spherical pendulum, and (d) coupled spherical pendula. For the 2D acquisitions
in (c) and (d), the $$$x$$$- and $$$y$$$-displacements are plotted separately.
The red line is the reference line as determined in Fig. 2.
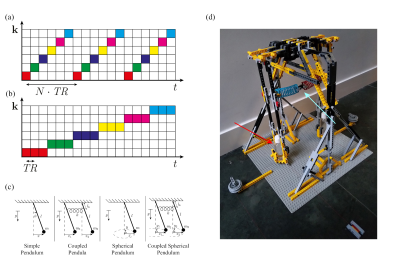
Figure 1: (a)
In conventional MRI, a different line in k-space is sampled every repetition. (b)
In spectro-dynamic MRI, one k-space line is repeated $$$N_\textrm{rep}$$$ times,
reducing the time interval between the acquisition of the same data point in
k-space. (c) Schematic representations of the four dynamical systems used for
our experiments. (d) The experimental setup with two pendula, each containing a
gel-filled vial (red arrow), which are connected with a spring (light blue
arrow).
-
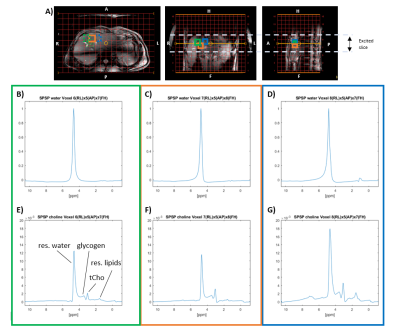
2.5D MRI of the Vocal Fold Oscillation using Single Point Imaging with Rapid Encoding
Johannes Fischer1, Ali Caglar Özen1,2, Matthias Echternach3, Louisa Traser4, Bernhard Richter4, and Michael Bock1
1Dept.of Radiology, Medical Physics, Medical Center University of Freiburg, Faculty of Medicine, University of Freiburg, Freiburg, Germany, 2German Consortium for Translational Cancer Research Freiburg Site, German Cancer Research Center (DKFZ), Heidelberg, Germany, 3Division of Phoniatrics and Pediatric Audiology, Department of Otorhinolaryngology, Head and Neck Surgery, Ludwig-Maximilians-University, Munich, Germany, 4Institute of Musicians' Medicine, Freiburg University Medical Center, Germany Faculty of Medicine, University of Freiburg, Freiburg, Germany
Single point imaging with rapid encoding
(SPIRE) is used image the vocal fold oscillations in the coronal plane
and readout in AP direction allows for the reconstruction in multiple slices.
Electroglottography and MR navigators are used to gate and motion-correct data
prior to reconstruction.
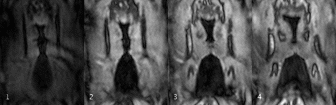
Figure 4: Vocal
fold oscillation in the coronal plane reconstructed into 4 slices and 12 Frames
resulting in a temporal resolution Δt = 890μs (f0 = 92Hz). Although motion of
the vocal folds is visible, no full contact can be observed. The vocal fold
oscillations cause the EGG electrodes to vibrate on the skin, which can be seen
on the edges of each frame.
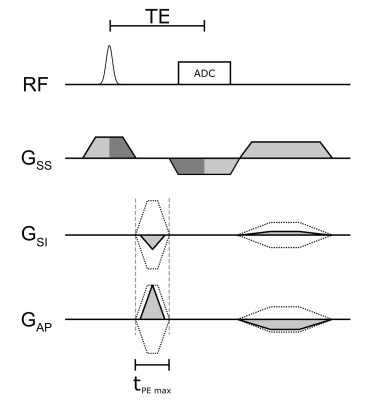
Figure 1: Sequence
diagram of the 2.5D SPIRE method. Rapidly switched phase encoding gradients
immediately follow $$$G_\mathrm{SS}$$$ and slice rephasing is performed simultaneously with
the frequency encoding in slice direction (dark grey areas indicate equal
gradient moments). PE gradients are rewound and a spoiler is applied with
opposite sign to the readout gradient to reduce switching when ramping to $$$G_\mathrm{SS}$$$
at the beginning of the next acquisition block. Dotted lines indicate the
gradient shapes for the largest phase encoding moments.
-
Zero Echo Time Imaging Using Low Resolution k-Space Interleaves
Hanna Frantz1, Thomas Huefken1, Patrick Metze1, Kilian Stumpf1, Tobias Speidel1, and Volker Rasche1
1Department of Internal Medicine II, Ulm University Medical Center, Ulm, Germany
This abstract presents an approach that relies on the
interleaved combination of ZTE read-outs with different resolutions combined
with a Compressed Sensing reconstruction, to acquire more information around
the k-space center, for high-quality ZTE without prolonged acquisition times.
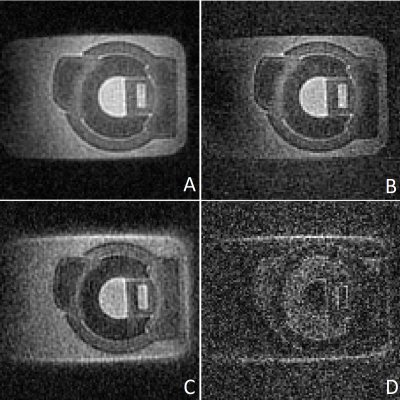
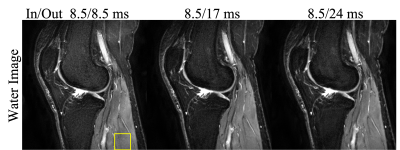
Figure 1: Coronal slice of a dedicated rubber phantom acquired at 15
mT/m gradient strength (A, B) and 24 mT/m (C, D). Images A and C were
acquired with the modified approach including the low-strength gradients.
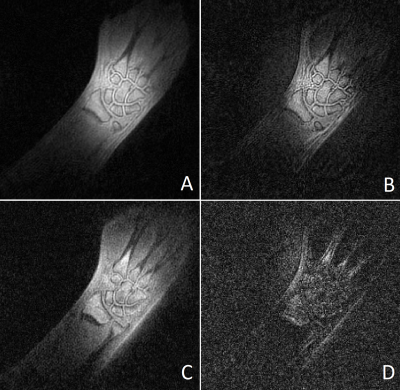
Figure 3: Coronal slice of a wrist
acquired at 15 mT/m gradient strength (A, B) and 24 mT/m (C, D). Images A
and C were acquired with the modified approach including the low-strength
gradients.
-
Arterial calcification imaging using ZTE on PET/MR
Edwin Eduard Gert Willem ter Voert1, Florian Wiesinger2, Graeme McKinnon3, Mathias Engström4, Jose Fernando de Arcos5, Marlena Hofbauer1, Ronny R Buechel1, and Philipp A Kaufmann1
1Department of Nuclear Medicine, University Hospital Zurich, Zurich, Switzerland, 2GE Healthcare, Munich, Germany, 3GE Healthcare, Milwaukee, WI, United States, 4GE Healthcare, Stockholm, Sweden, 5GE Healthcare, Little Chalfont, Amersham, United Kingdom
In the current study we demonstrate that ZTE imaging on PET/MR, combined
with Deep Learning reconstructed ZTE, can likely be applied to detect
calcifications in peripheral vasculature.
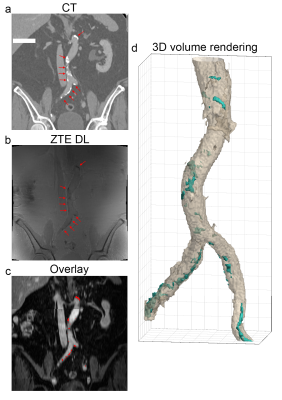
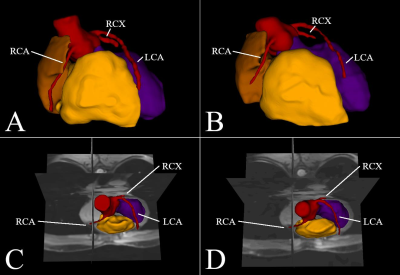
Figure 2: Example coronal slices and a 3D volume rendering in the
abdominal region. a) prior obtained CT, b) Deep Learning reconstructed ZTE, c)
ZTE calcifications (red) overlaid on the contrast enhanced water map MRI
(LAVA-Flex based), d) 3D volume rendering showing the ZTE calcifications (cyan).
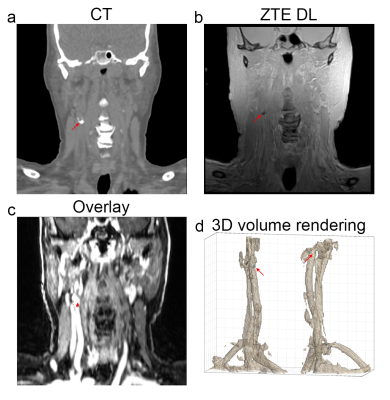
Figure 4: Example coronal slices and a 3D volume rendering in the
head/neck region. a) prior obtained CT with indicated (red arrow) calcification,
b) Deep Learning reconstructed ZTE, c) ZTE calcifications (red) overlaid on the
contrast enhanced water map MRI (LAVA-Flex based), d) 3D volume rendering
showing the ZTE calcifications (cyan).
-
Compressed Sensing PETRA MRI
Serhat Ilbey1, Johannes Fischer1, Michael Bock1, and Ali Caglar Ozen1,2
1Dept. of Radiology, Medical Physics, Medical Center University of Freiburg, Faculty of Medicine, University of Freiburg, Freiburg, Germany, 2German Consortium for Translational Cancer Research Partner Site Freiburg, German Cancer Research Center (DKFZ), Heidelberg, Germany
csPETRA
enables 3D imaging with isotropic sub-millimeter resolution within only a few minutes,
e.g., for (0.5 mm)3 voxel size with (20 cm)3 field of
view, which is demonstrated with different acceleration factors for high-resolution
imaging of the knee.
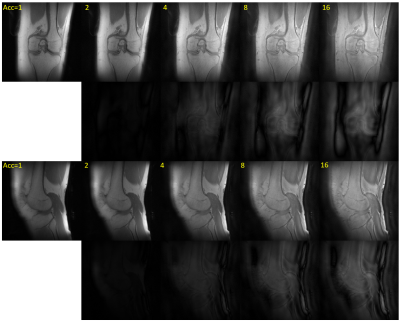
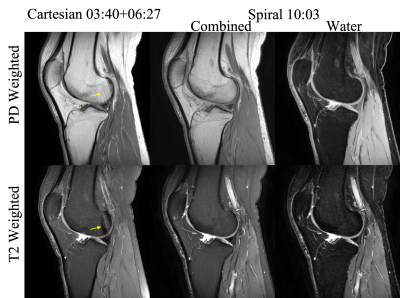
Fig. 3: Coronal (first row) and sagittal view (third row) of PETRA (Acc=1) and csPETRA (Acc>1) images. Yellow numbers show the Acc factor used for the SPI acquisition. Second and fourth rows show difference images subtracted with Acc=1 images (far left images) of coronal and sagittal views, respectively.
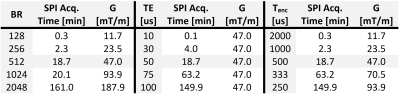
Table 1: Examples of SPI acquisition times w.r.t. the parameters $$$\text{BR}$$$, $$$\text{TE}$$$, and $$$T_\text{enc}$$$ with the corresponding maximum gradient amplitude (|G|). Default parameters were: $$$\text{BR}$$$=512, $$$\text{TE}$$$=50 µs, $$$T_\text{enc}$$$=500 us, TR=2 ms, when they were not used as the sweep parameter.
-
Single echo reconstruction for rapid and silent MRI
Sairam Geethanath1
1Columbia MR Center, Columbia University, New York, NY, United States
This work demonstrates the the first, rapid 128 x 128 imaging without phase encoding using a 64-channel coil. This was applied to T2 weighted imaging of 11 slices with (i) Acquisition time for TE (80ms) = 1.8s (ii) Total RF deposition for both TEs = 10.8W (iii) PNS % 12.09 (iv) no blurring artifacts
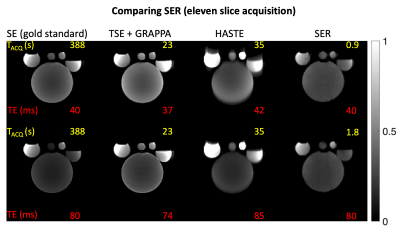
Fig.4: Comparison of SER with other methods for eleven slices - the top row shows vendor-provided gold standard spin-echo (SE), a turbo SE with an ETL of 7 and a GRAPPA factor of 6, a half-Fourier acquisition single-shot TSE (HASTE) at echo times (TE) shown in red font. The corresponding acquisition times (Tacq) are shown in yellow font and were recorded from the vendor’s user interface. The bottom row shows the corresponding images at TEs close to 80ms allowed by the vendor. SER images acquired using pypulseq at similar slice locations, do not suffer from saturation or blurring artifacts.
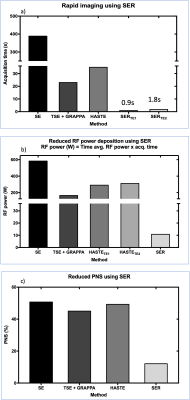
Fig. 5: Single echo reconstruction (SER) imaging performance a) SER provides the fastest acquisition time for the four methods, depends on echo time (TE) rather than repetition time (TR) and phase encoding steps, and is faster than TSE + GRAPPA by an order of magnitude; b) SER delivers the lowest RF power to the phantom among the methods, due to the one-time use of the 900 and 1800 pulse; c) SER is the most silent scan with the least peripheral nerve stimulation (PNS) percentage due to the one-time use of the readout gradient
-
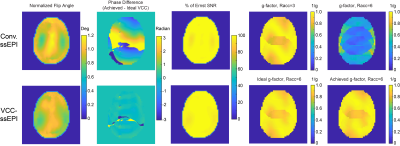
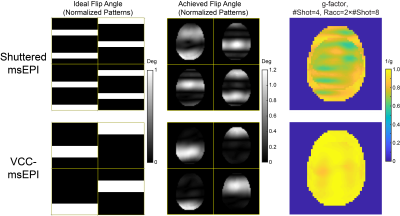
Investigations on accelerated imaging at 9.4T with electronically modulated time-varying receive sensitivities
Felix Glang1, Kai Buckenmaier1, Jonas Bause1, Alexander Loktyushin1, Nikolai Avdievich1, and Klaus Scheffler1,2
1High-field Magnetic Resonance Center, Max-Planck Institute for Biological Cybernetics, Tübingen, Germany, 2Department of Biomedical Magnetic Resonance, Eberhard Karls University Tübingen, Tübingen, Germany
Time-varying
receive sensitivities can be achieved by introducing variable capacitance
diodes to the receive loops, which allow to dynamically tune B1-. This offers
an additional degree of freedom for MR image encoding, with the potential for
improved parallel imaging performance.
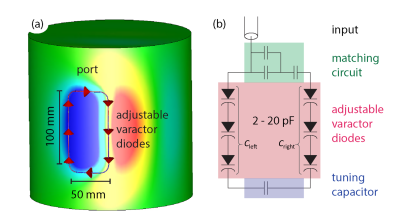
Figure 1. Schematic
of the proposed receive loop geometry and circuitry. (a) Simulation setup for
one of the four modulatable receive loops placed circumferentially around a
cylindrical phantom. (b) Circuit diagram of the receive loop with tuning and
matching capacitors as well as six adjustable varactor diodes (each in a range
between 2 and 20pF) placed on the long sides of the loop, which are used to
modulate receive sensitivity profiles B1-.
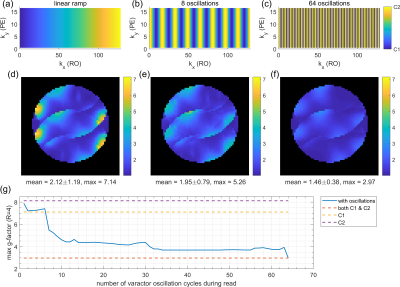
Figure 4. Sensitivity
modulation during readout (RO) of k-space lines. k-space configuration
weightings for (a) linear ramp, (b) 8 and (c) 64 sinusoidal oscillations
between C1 and C2 along each RO line. The latter is equivalent to switching between C1
and C2 for each ADC sample. (d), (e), (f) G-factors for the respective
sensitivity switching patterns. (g) Maximum g-factor for sinusoidal sensitivity
switching versus number of oscillations, compared to static sensitivity sets of
C1, C2 and combined C1 & C2.
-
Feasibility of a Novel Sampling/Reconstruction Method Ensuring a SNR Benefit Over the Traditional Sampling Approach
Samuel Perron1, Matthew S. Fox1,2, Hacene Serrai1, and Alexei Ouriadov1,2,3
1Physics and Astronomy, The University of Western Ontario, London, ON, Canada, 2Lawson Health Research Institute, London, ON, Canada, 3School of Biomedical Engineering, The University of Western Ontario, London, ON, Canada
The proposed
software-based under-sampling and reconstruction method has been shown to yield
improved SNR for FGRE, x-Centric, and FE-Sectoral imaging schemes, with
possible implementation in existing MRI systems without any hardware
modifications.
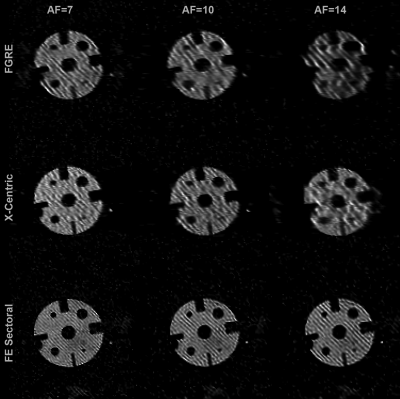
Figure 4.
Representative resolution phantom images reconstructed from
retroactively under-sampled k-spaces corresponding to FGRE, x-Centric and FE
Sectoral. AF were 7, 10 and 14. FGRE SNR was 20, x-Centric SNR was
28 and Sectoral SNR was 25. The FE Sectoral images show much
less image distortions at all three AF compared to FGRE and x-Centric.
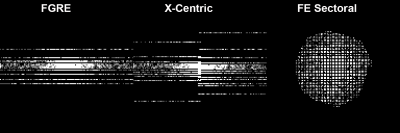
Figure 1. Depicts three different k-space
under-sampling patterns corresponding to AF=10, used for each wash-out image retroactively
in wash-out or SNR attenuation direction.
-
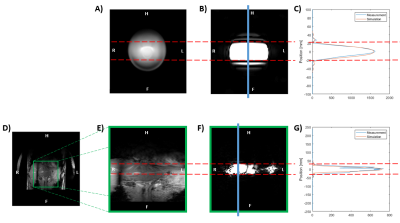
A Deselecting Alias Approach to Volumetric Zoomed Imaging
Nicolas Arango1, Molin Zhang1, Jason Stockmann2,3, Jacob White1, and Elfar Adalsteinsson1,4
1Department of Electrical Engineering and Computer Science, Massachusetts Institute of Technology, Cambridge, MA, United States, 2A. A. Martinos Center for Biomedical Imaging, Massachusetts General Hospital, Charlestown, MA, United States, 3Harvard Medical School, Boston, MA, United States, 4Institute for Medical Engineering and Science, Massachusetts Institute of Technology, Cambridge, MA, United States
We demonstrate simulations of a new method for ∆B0 selective excitation for rFOV imaging by only deselecting signal that would otherwise alias into the target FOV.
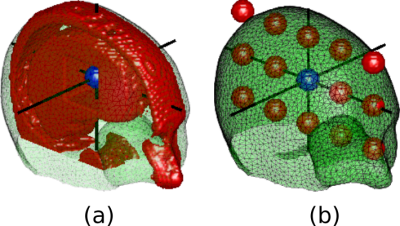
Figure 1. Excited volume from one-sided zoomed imaging excitation and optimized b) ΔB0 field. The Hyperboloid excitation volume does not take advantage of the don't care regions introduced by the alias deselection mask.
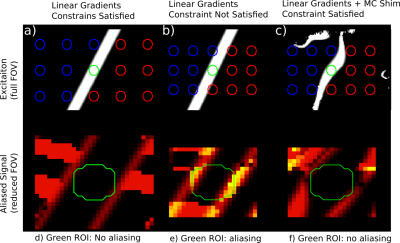
Figure 3. Sagital slice of excitation (a,b,c) and rFOV aliasing pattern (d,e,f) from Linear gradient optimized and linear gradients plus multicoil shim optimized rFOV excitation. (a,d) Linear gradients can select an off-axis slab between aliases with a sufficiency large rFOV. (b,e) Tighter rFOVs cannot be achieved with linear gradients only.(c,f) Multicoil shim array in conjunction with linear gradients achieves tighter rFOV.
-
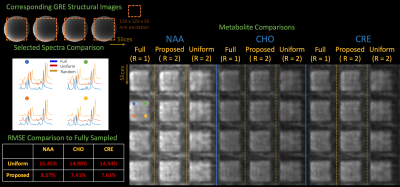
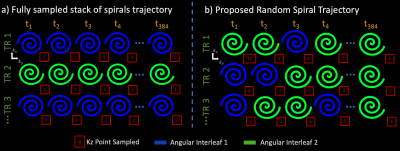
Efficient NUFFT Backpropagation for Stochastic Sampling Optimization in MRI
Guanhua Wang1, Douglas C. Noll1, and Jeffrey A. Fessler2
1Biomedical Engineering, University of Michigan, Ann Arbor, MI, United States, 2Electrical Engineering and Computer Science, University of Michigan, Ann Arbor, MI, United States
Fast approximation method for calculating the Jacobian matrix of the NUFFT operations.
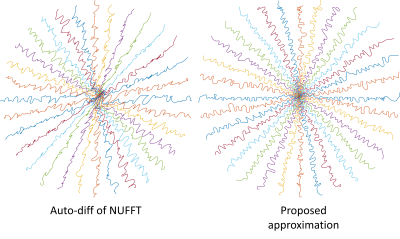
Figure 3. The learned trajectories by different methods. The initialization is an under-sampled radial sampling pattern.
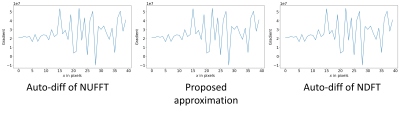
Figure 1. The gradient w.r.t. $$$\boldsymbol{x}$$$. We denote auto-differentiation of NUFFT as auto-diff, exact NDFT as exact, and our approximation method as approx. Three calculation methods achieve similar results.
-
A digital MRI RF-receiver using an ordinary GPU
Annalena Erbrecht1, Enrico Pannicke1, and Christoph Dinh1
1Otto-von-Guericke University, Magdeburg, Germany
Our studies
showed that a CIC based decimation filter is suitable to realize a digital MRI
console which requires low calculation effort and high noise attenuation. This
filter can be used to directly convert the acquired signal to the k-space.
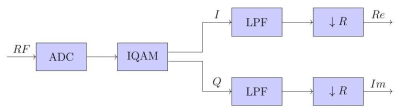
Figure
1: Block diagram of an MRI RF-receiver
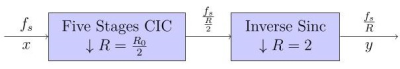
Figure 2:
Block diagram of a five stages CIC filter combined with a compensation filter
-
Feasibility of a single low dose dual temporal resolution DCE-MRI method for whole-brain, high-spatial resolution parametric mapping
Ka-Loh Li1, Daniel Lewis2, David J Coope3, Federico Roncaroli3, Omar N Pathmanaban2, Andrew T King2, Sha Zhao1, Erjon Agushi1, Alan Jackson1, Timothy Cootes1, and Xiaoping Zhu1
1Division of Informatics, Imaging and Data Sciences, The University of Manchester, Manchester, United Kingdom, 2Department of Neurosurgery, Salford Royal NHS Foundation Trust, Manchester, United Kingdom, 3Division of Neuroscience and Experimental Psychology, The University of Manchester, Manchester, United Kingdom
A new dual-temporal resolution DCE-MRI analysis technique (LEGATOS) combined with a single-injection low-dose interleaved protocol permits the derivation of accurate, tissue-validated high-spatial resolution kinetic parameter estimates following a single low contrast agent dose.
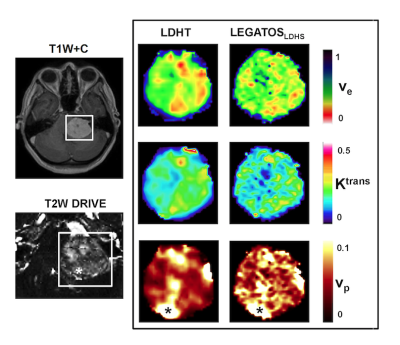
Figure 3: Representative images from a patient with a large left sided sporadic VS imaged using a single low-dose (LD) interleaved high-temporal (HT) (frame duration of Dt = 1.46 s) and high-spatial resolution (Dt = 6.04 s) DCE-MRI acquisition on a 1.5 T Philips scanner. Kinetic maps derived using the HT segments alone (LDHT, left column) or the LEGATOS method are shown. Note the increased vascularity around the tumor capsule, visible on both the high-spatial T2W DRIVE acquisition (voxel size = 0.5 x 0.5 x 0.5mm3) and LEGATOS derived vp parameter maps (*).
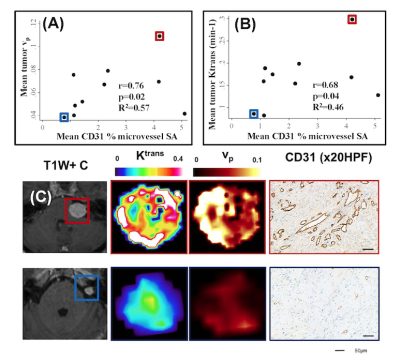
Figure 4: Comparison of LEGATOS derived vp and Ktrans estimates from the in vivo single-injection low-dose DTR Study against tissue derived parameters
(A) Inter-tumor scatterplot comparison of LEGATOS derived mean tumor vp estimates against mean CD31 % microvessel surface area (SA).
(B) Inter-tumor scatterplot analysis of LEGATOS derived mean tumor Ktrans (min-1) against mean CD31 % microvessel surface area (SA).
(C) Representative imaging and histology from a patient with a growing highly vascular VS (top row) and a comparatively less vascular static VS (bottom row) are shown.
-
B1+ inhomogeneity mitigation using adiabatic refocusing RF pulses for diffusion weighted imaging at 7T
Shahrokh Abbasi-Rad1, Martijn Cloos1,2, Jin Jin3, Kieran O'Brien3, and Markus Barth1,2,4
1Centre for Advanced Imaging, University of Queensland, Brisbane, Australia, 2ARC Training Centre for Innovation in Biomedical Imaging Technology, The University of Queensland, Brisbane, Australia, 3Siemens Healthcare Pty Ltd, Brisbane, Australia, 4School of Electrical Engineering and Information Technology, The University of Queensland, Brisbane, Australia
We showed that the use of two
adiabatic refocusing pulses (TR-FOCI) could mitigate the B1+
inhomogeneity problem commonly observed at 7T in a twice-refocussed spin echo
diffusion weighted images.
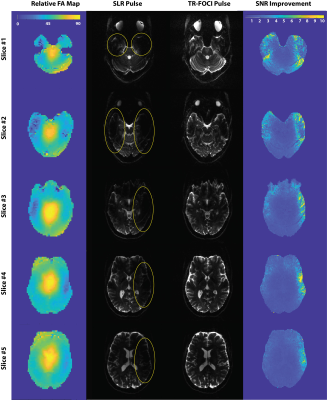
Figure
4. Shows the comparison of b0
images acquired by SLR versus adiabatic refocusing pulses. The B1+
insensitivity of the adiabatic TR-FOCI pulse mitigates the B1+
inhomogeneity leading to retrieval of spin-echo signal at the temporal lobe and
cerebellum. The first column shows the relative FA map indicating the
low B1+ areas and the last column shows the relative SNR map. The SNR map
indicates that in the B1+ starved areas of the
brain SNR is improved up to 10 times. The TR value (30000 ms) was kept
identical between the two measurements so that signal intensities could be
comparable.
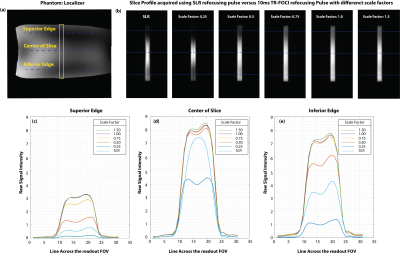
Figure
3. (a) shows the localizer
view of the phantom with the location of the acquired slice. (b) shows the slice
profile images of the SLR refocusing pulse versus TR-FOCI refocusing pulse with
different scale factors for the power of the pulse. With the scale factor of
one, the pulse is applied with the power of 9 T, which is derived from the simulations as the minimum value
required for the adiabaticity of the pulse. (c), (d), and (e)
show the slice profile across the superior, center, and the inferior regions of
the slice.
-
RF-encoding for improved multi-voxel separation in MR spectroscopy
Adam Berrington1, Penny Gowland1, and Richard Bowtell1
1Sir Peter Mansfield Imaging Centre, School of Physics and Astronomy, University of Nottingham, Nottingham, United Kingdom
Phase
and amplitude signal modulation was shown to improve the g-factor of reconstruction for 5 voxels in simulation. Phantom spectra
from two-voxels were acquired over M=1…5 encoding steps with 30° phase
increments and were of higher SNR than reconstructing using coil-encoding
alone.
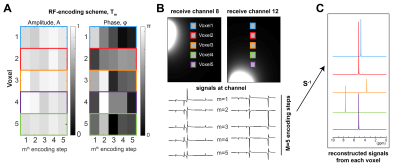
Fig.1: RF-encoding simulated with unique spectral
peaks assigned to 5 voxel ‘locations’ (coloured regions). A) Encoding scheme applied to each voxel at each encoding step, $$$m=1…5$$$. Amplitude was weighted
randomly between 0.8 and 1 and phase modulated between 0 and 180$$$^{\circ}$$$. B) Receive
sensitivities (shown for two coils),
which are combined with (A) to generate weighted signals at each channel
for each encoding step, $$$m$$$. Signals are concatenated over M=5 steps. C)
Inversion of the system matrix, $$$\bf S$$$, reveals reconstructed signals from each voxel.
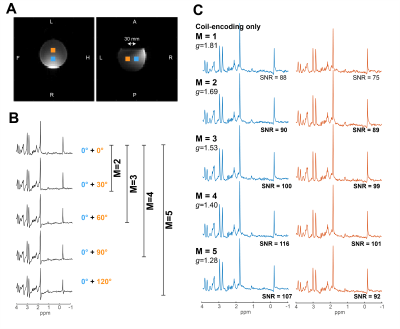
Fig. 4: Data
acquired from two voxels (voxel 1=blue; voxel 2=orange) in a phantom (A) using
proposed RF-encoded technique with an increasing number of encoding steps, M. (B)
Combined signal (not unfolded) from all receive coils shows shot-to-shot
variation in phase from (0°,30°,60°,90°,120°) modulation on voxel 2 using the dual-band pulses.
(C) Reconstructed data using RF-encoding (steps M=2-5) are shown below coil-encoding
only (M=1). The spectral SNR and effective g-factor values are stated next to
each encoding.
-
Extended Accelerated Systematic Tracking using Experimental Radiology: an Encephalo-Graphic Generation
S. T. Claus1, Y. Eti2, and E. S. Terbuny3
1Dept. of Presents, North Pole Research Agency, Rovaniemi, Finland, 2Atopof Amountain, Himalaya, Bhutan, 3Dept. for Sweets, Greenfield Institute, Ostereistedt, Germany
Don't let your chocolate lie around.
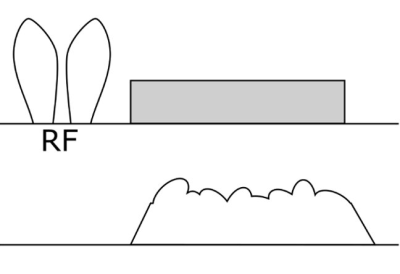
Figure 1: Sequence diagram of the UTE se-quence with the rabbit feigning (RF) pulse shape. Note that the gradients in the lower part require fast switching capabilities and a small amount of time travel. Allergy advice: sequence may contain traces of nuts.
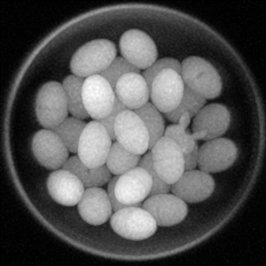
Figure 3:
POTS reconstructed image of the EASTER-EGG sequence being presented to
the CNN
(or $$$CNN$$$ or CNN). Rabbit detection is completely
impossible for a human being, but the CNN (or $$$CNN$$$ or CNN) was able to ignore it in less than 4
h.