-
Mechanism and quantitative assessment of saturation transfer for water-based detection of the aliphatic protons in carbohydrate polymers
Yang Zhou1, Peter van Zijl2,3, Jiadi Xu2,3, and Nirbhay N. Yadav2,3
1Institute of Biomedical and Health Engineering, Shenzhen Institutes of Advanced Technology, Shenzhen, China, 2The Russell H. Morgan Department of Radiology, The Johns Hopkins University School of Medicine, Baltimore, MD, United States, 3F.M. Kirby Research Center for Functional Brain Imaging, Kennedy Krieger Institute, Baltimore, MD, United States
The analytical solution for rNOE based magnetization transfer in CEST experiments is derived and then successfully validated for polycarbohydrates through both numerical simulations and experimental data from glycogen in different solvents and as a function of pH.
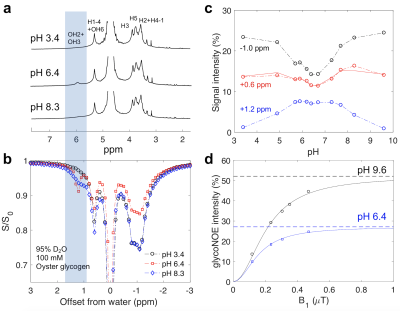
Figure 1. The pH dependence of NMR and Z-spectral intensities for oyster glycogen (100 mM glucose units) in 95% D2O/5% H2O. (a) 1D NMR spectra at different pH. (b) Z-spectra at three pH values (4s continuous RF irradiation, B1 = 0.4 µT). (c) Lorentzian fitted peak intensities (S/S0) at +1.2, +0.6 and -1.0 ppm as a function of pH. (d) GlycoNOE (-1 ppm) intensity as a function of B1 (16s continuous RF) at two pH values. The curve was fitted using Eq. 1.
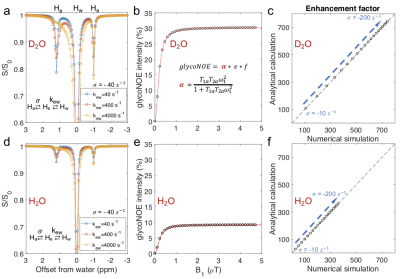
Figure 2. Numerical simulations agree with the analytical results. (a, d) Numerically simulated Z-spectra for different hydroxyl exchange rates. (b, d) The dependence of the numerically simulated glycoNOE (black circles) intensities on B1 field strengthis in agreement with that using the analytical solution (red line, using Eq. 1). (c, f) Values for the enhancement factor (e) for numerically and analytically simulated data are the same.
-
Improving the Bloch Fitting Method for the Analysis of acidoCEST MRI
Tianzhe Li1, Aikaterini Kotrotsou1, Shu Zhang1, Kyle Jones1, and Mark Pagel1
1Cancer Systems Imaging, UT MD Anderson Cancer Center, Houston, TX, United States
Our Bloch-fitting algorithm can quantify the changes of kex
of iopamidol amide protons with sample pH levels and temperatures. We have
confirmed that including experimentally measured information can increase the
accuracy of the fitting results.
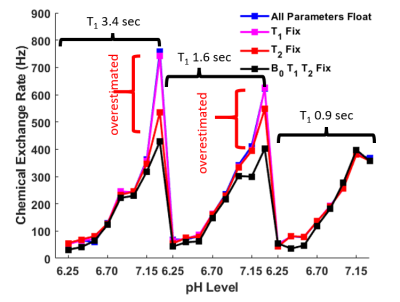
Figure 3. Bloch fitted kex with different
fitting conditions for the 5.6 ppm amide proton in 25 mM iopamidol solutions
with different T1 values. The analyzed spectra were acquired at 37
°C with a saturation power of 3.0 μT and a saturation time of 6.0 sec.
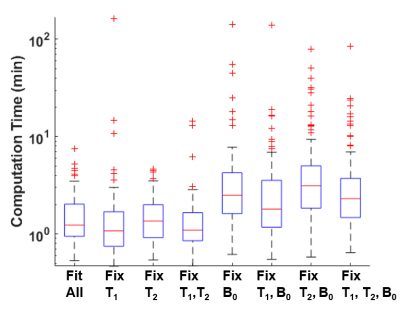
Figure 4. The computation time for the Bloch-fitting
process with different fitting conditions. For each fitting condition, the
computation time presented includes data for the fitting of the spectra of
twenty-four 25 mM iopamidol samples scanned at five temperatures (i.e. 120
spectra per fitting condition).
-
Time resynchronization of data obtained during cardiovascular MRI combined with catheterization using biophysical cardiac modeling
Maria Gusseva1,2, Daniel Alexander Castellanos3, Mohamed Abdelghafar Hussein4,5, Joshua Greer 4, Gerald Greil4, Surendranath Veeram Reddy4, Dominique Chapelle1,2, Tarique Hussain4, and Radomir Chabiniok1,2,4,6
1Inria, Palaiseau, France, 2LMS, Ecole Polytechnique, Palaiseau, France, 3Department of Cardiology, Boston Children’s Hospital, Boston, MA, United States, 4Division of Pediatric Cardiology, UT Southwestern Medical Center Dallas, Dallas, TX, United States, 5Pediatric department, Kafrelsheikh University, Kafr Elsheikh, Egypt, 6Department of Mathematics, Czech Technical University in Prague, Faculty of Nuclear Sciences and Physical Engineering, Prague, Czech Republic
Patient-specific biophysical heart modeling was employed to resynchronize the intraventricular pressure and volume data acquired during combined cardiovascular MRI and catheterization procedure. Such model-filtered P-V loops allowed better clinical interpretation of iCMR exam.
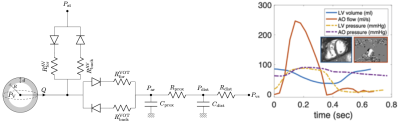
Figure 1: Left: Single-heart cavity model coupled with the circulation system via system of diodes and a two-stage Windkessel. Right: Example of acquired and processed CMR and pressure data of LV rTOF patient #1.
-
Realistic diffusion tensor cardiovascular magnetic resonance simulations in a histology-based substrate: The effect of membrane permeability
Jan N Rose1, Ignasi Alemany1, Andrew D Scott2,3, and Denis J Doorly1
1Department of Aeronautics, Imperial College London, London, United Kingdom, 2Cardiovascular Magnetic Resonance unit, Royal Brompton Hospital, London, United Kingdom, 3National Heart and Lung Institute, Imperial College London, London, United Kingdom
We extend our existing, histology-based Monte Carlo random walk simulations of DT-CMR with a model for permeable cell membranes. Results show that values of FA move closer towards in-vivo expectations when considering permeability.
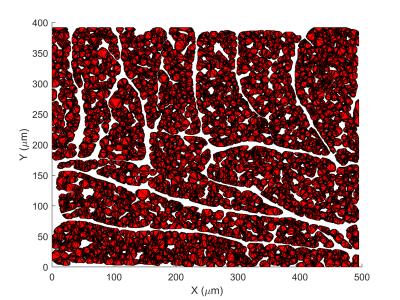
2D illustration of the virtual histology-based geometry used in the simulations. Myocytes are triangular meshes (polyhedra). The extra-cellular volume fraction is 22%.
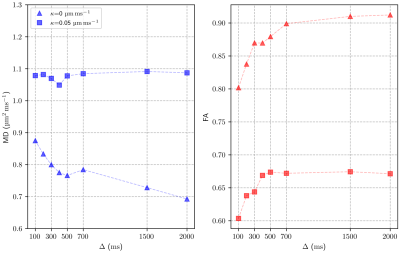
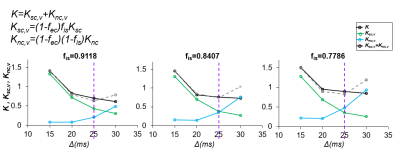
FA and MD values for two extreme permeability cases ($$$\kappa$$$=0 and 0.05μm/ms). All simulations have been computed considering a STEAM sequence with increasing $$$\Delta$$$ and constant gradient strength and duration. Parameters: $$$N_p$$$=104 walkers, $$$D_\text{ICS}$$$=1.5µm2/ms and $$$D_\text{ECS}$$$=3µm2/ms.
-
Packing hierarchical structures in myocardial tissue to synthesise a realistic substrate
Jan N Rose1, Andrew D Scott2,3, and Denis J Doorly1
1Department of Aeronautics, Imperial College London, London, United Kingdom, 2Cardiovascular Magnetic Resonance unit, Royal Brompton Hospital, London, United Kingdom, 3National Heart and Lung Institute, Imperial College London, London, United Kingdom
We have developed an algorithm to pack cardiomyocytes of arbitrary polygonal shape into groups also of arbitrary shape, known as sheetlets, found in the myocardium. Using the method, we synthesise an imaging voxel replicating histological specimen geometric properties.
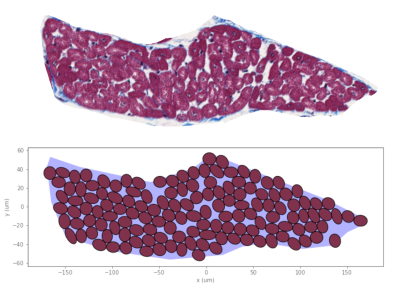
(Top) Sheetlet segmented from histological images. (Bottom) Synthesised sheetlet after completion of the packing algorithm and after removing ghost cells, which leave distinct pockets of ECS between myocytes. The sheetlet outline was used as the target region and myocytes were created to match cell geometries from histology.
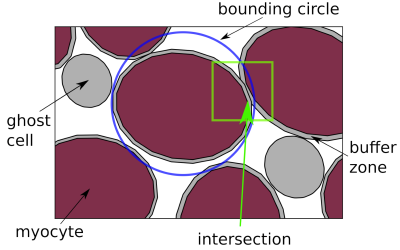
Illustration of the presented packing algorithm. Bounding circles are used to quickly reject objects from intersection computation. Objects in grey are the buffer zone and "ghost cells", which will be removed at the end of the simulation, leaving the myocyte objects.
-
Neurovascular coupling in the cerebellum: reconstructing the neurophysiological basis of different cerebellar fMRI responses.
Anita Monteverdi1,2, Giuseppe Gagliano2, Stefano Casali2, Fulvia Palesi1,2, Claudia AM Gandini Wheeler-Kingshott 1,2,3, Lisa Mapelli2, and Egidio D'Angelo1,2
1Brain Connectivity Center Research Department, IRCCS Mondino Foundation, Pavia, Italy, 2Brain and Behavioral Sciences, University of Pavia, Pavia, Italy, 3Queen Square MS Centre, Department of Neuroinflammation, UCL Queen Square Institute of Neurology, Faculty of Brain Sciences, University College London, London, United Kingdom
Our results show for the first time the region-specificity and frequency-dependency of the neurovascular coupling in the cerebellar cortex, combining vascular time-lapse bright-field imaging, electrophysiological investigations ex vivo, and computational models of neuronal activity.
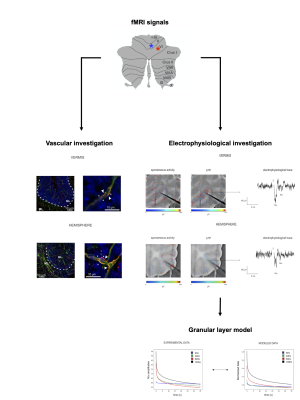
Fig.1| Cerebellar vermis and hemisphere showed different fMRI signals in humans in vivo1,2. In order to explore the neurophysiological basis of such difference we characterized capillary responses ex-vivo in vermis lobule V and hemisphere lobule VI in acute mouse cerebellar slices (left: vascular organization of these regions) and recorded neuronal activity with an HD-MEA (right: LFP signals recorded from the granular layer). Then, we validated a biophysical realistic model with the electrophysiological data and used it to dissect the neuronal contribution to the NVC.
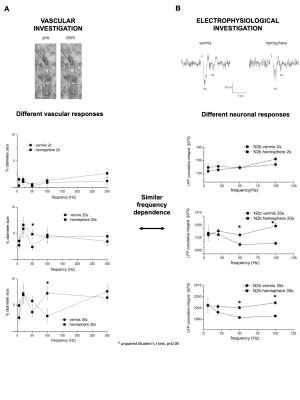
Fig. 2| Capillary dilation differed between cerebellar vermis and hemisphere in response to mossy fibers stimulation, and vascular responses did not show linear trends while increasing the input frequency. Granular layer neuronal responses recorded as Local Field Potentials (N2a-N2b peaks) differed in cerebellar vermis and hemisphere, and the N2b peak presented a non-linear frequency dependent trend. Importantly N2b peak is informative of N-methyl-D-aspartate receptors (NMDA) activation and the NMDAR-NO pathway is known to regulate cerebellar neurovascular coupling3.
-
Simulations of the BOLD Non-Linearity Based on a Viscoelastic Model for Capillary and Vein Compliance
Joerg Peter Pfannmoeller1, Grant Addison Hartung1, Xiaojun Cheng2, Avery Berman1, David Boas2, and Jonathan Rizzo Polimeni1
1Athinoula A. Martinos Center for Biomedical Imaging, Massachusetts General Hospital, Charlestown, MA, United States, 2Neurophotonics Center, Boston University, Boston, MA, United States
We extended an existing framework of BOLD modeling based on biophysical simulations to incorporate viscoelastic properties of individual blood vessels and tissue, and use it to examine BOLD response nonlinearities to short-duration stimuli.
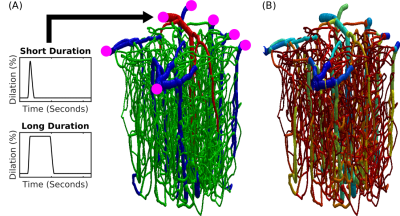
Fig.1 Realistic VAN model of mouse cortex. (A) Anatomical reconstruction of full vascular network (600 micron cube). Arteries (red), capillaries (green), veins (blue). The inputs and outputs to the network are indicated in magenta. The boundary conditions must be computed to emulate the behavior within the VAN as if it were connected to large feeding arteries and draining veins as it is in the brain. (B) The distribution of Young’s elasticity modulus indicating the characteristic difference between pial veins and the intra cortical diving veins and capillaries (logarithmic scale).
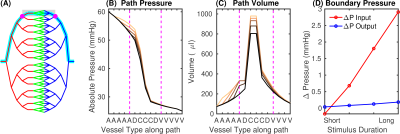
Fig.2 Determination of boundary conditions using a whole-brain stylistic VAN. (A) Vascular network for mouse brain (diving artery:vein ratio 1:3; arteries red, capillaries green, veins blue). Cyan indicates the path used for analysis, the area representing the realistic VAN is shaded, magenta dots show the VAN boundary nodes. (B) Pressure and (C) blood volume along the path in (A) for baseline and active conditions for short and long-duration stimuli. Magenta lines indicate the boundary nodes in (A). (D) Pressure increases at the boundary nodes for different stimulus durations.
-
Established a rat model of discogenic low back pain for evaluating the paravertebral muscle functional magnetic resonance changes
Luo Bao fa1, Huang Yi long1, Yang Kai wen1, Nie Li sha2, and He Bo1
1The First Affiliated Hospital of Kunming Medical University, kunming, China, 2GE Healthcare, MR Research China, Beijing, Beijing, China
It is feasible to construct DLBP rat model by X-ray
guided puncture of intervertebral disc, and the T2 value changes earlier than
R2*in the early stage
of DLBP.
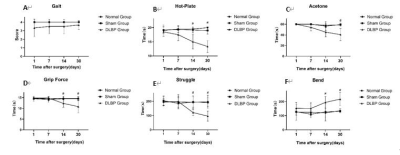
Figure.2 Behavioral assay,1,7,14 and 30 days after operation. (
A ) Gait disturbance score: There was no significant difference among the three
groups;(B and C) Hot-Plate and acetone assay: Compared with the normal group
and sham group, the DLBP group showed a decreased in pain and temperature
threshold; (D,E and F) Grip force and tail suspension assay: The DLBP group
showed reduced grip and struggle time and increased bending time due to axial
pain in the waist and back (#P < 0.05).
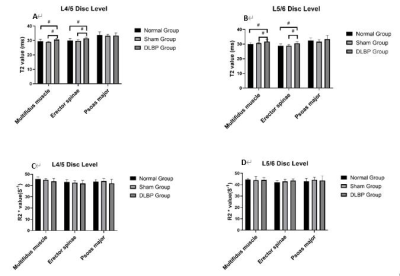
Figure.4 MRI T2 mapping (A and B) and BOLD (C and D),1 month
after operation. Compared with the normal group and sham group, the T2 values
of the L4/5 and L5/6 multifidus and erector spinae in the DLBP group were increased. There was no
significant difference in R2*values of multifidus , erector spinae and psoas
major among the three groups (#P < 0.05) .
-
Modelling Depth-Dependent VASO and BOLD Signal Changes in Human Primary Motor Cortex
Atena Akbari1, Saskia Bollmann1, and Markus Barth1,2,3
1Centre for Advanced Imaging, The University of Queensland, Brisbane, Australia, 2School of Information Technology and Electrical Engineering, Brisbane, Australia, 3ARC Training Centre for Innovation in Biomedical Imaging Technology, Brisbane, Australia
Using a cortical vascular model, we simulated the depth-dependent BOLD and VASO signal change in human primary motor cortex.
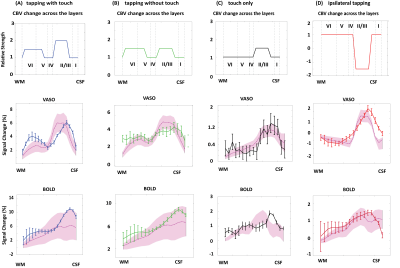
Figure 2. The first row shows
the pattern of the CBV change across the layers used in our simulation. Rows 2 to 5 show the BOLD and VASO simulated
profiles. Profiles with RMSE 20% higher than the minimum RMSE are plotted as
the shaded area. In all figures the horizontal axes show the relative cortical
depth, vertical axes show the percentage of signal change, solid lines
represent imaging data, dotted lines represent simulated responses, and error
bars show the standard error of the mean.
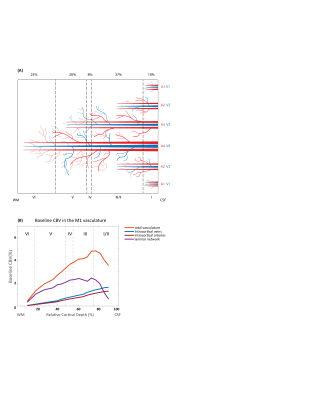
Figure 1. A) Schematic
representation of the modelled primary motor cortex centred on two adjacent
principal veins of groups 3 and 4 (V3, V4) with artery to vein ratio of 2-1. B)
Baseline blood volume in intracortical vessels and the laminar network (i.e.
arterioles, capillaries, and venules) in the modelled area.
-
A Comparison on the Estimated Stiffness and Signal-to-Noise Ratio of Magnetic Resonance Elastography Images Acquired at 3T and 7T
Yuan Le1, Andrew J. Fagan1, Jun Chen1, Eric G. Stinson2, Joel P. Felmlee1, Matthew C. Murphy1, Kevin J. Glaser1, Arvin Arani1, Phillip J. Rossman1, Stephan Kannengiesser3, Bradley D. Bolster, Jr.2, John Huston, III1, and Richard L. Ehman1
1Radiology, Mayo Clinic, Rochester, MN, United States, 2Siemens Medical Solutions USA, Inc., Malvern, PA, United States, 3Siemens Healthcare GmbH, Erlangen, Germany
By comparing the MRE images acquired using a PVC phantom
at 7T vs. 3T, we found that the signal-to-noise ratio and the octahedral shear
strain based SNR were much higher, or close to double, at 7T compared with 3T. The
stiffness values were very close between the two field strengths.
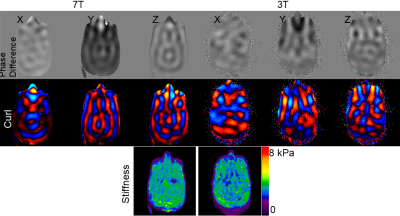
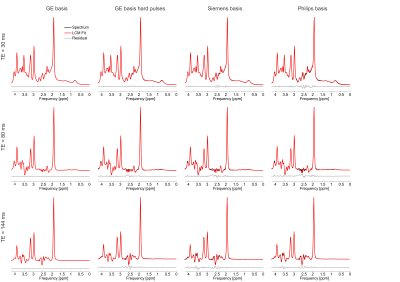
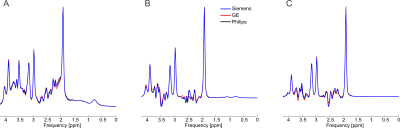
Figure 3. Wave images, curl maps and stiffness maps at 7T and 3T.
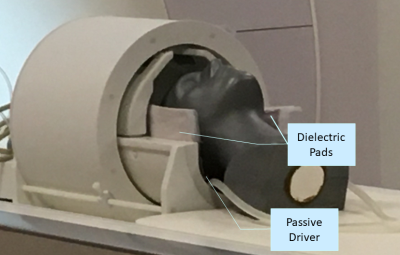
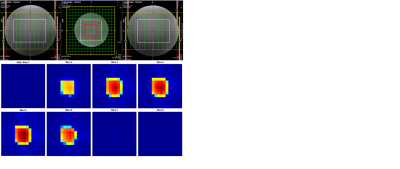
Figure 1. PVC head phantom and the setup of the MRE test.
-
Towards direct neuronal-current MRI: a novel statistical processing technique for measurements in the presence of system imperfections.
Chiara Coletti1, Sebastian Domsch1, Frans Vos1, and Sebastian Weingärtner1
1Imaging Physics, TU Delft, Delft, Netherlands
- - Direct neuro-current MRI shows high susceptibility to B0 and B1+ inhomogeneities.
- - The proposed data-processing for neuro-current MRI time series, achieves higher sensitivity and is less susceptible to system imperfections than previous approaches.
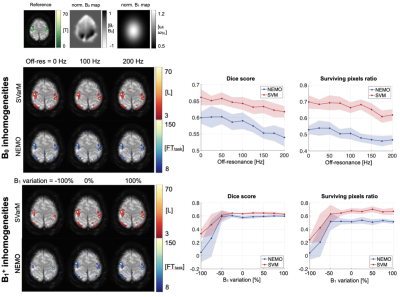
Representative activation maps for the two processing methods, NEMO and SVarM, for different levels of B0 and B1+ inhomogeneities. On the right, corresponding plots of Dice score and surviving pixels ration (mean ± std). On the top, ground truth activation map, obtained from BOLD fMRI experiments, and representative B0 and B1+ field maps.
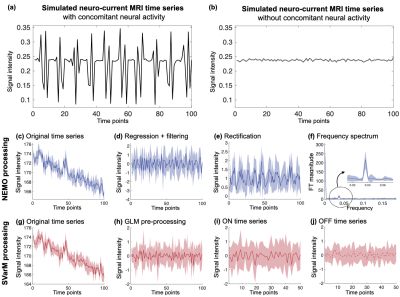
Simulated neuro-current time series with (a) or without (b) concomitant neural activation. Time courses (mean ± std) after each step of data processing. NEMO consists of a regression and high-pass filtering step to remove low frequency confounds (d), a rectification step converting variance differences in mean shifts (e) and extraction of the peak magnitude in the frequency spectrum at the task frequency (f). SVarM uses GLM regression to remove low frequency confounds (h), then pools the data into ON and OFF groups and tests the difference in their variance with Levene’s test (i-j).
-
UNIform COmbined RecoNstruction (UNICORN) for 7T Clinical Fat-Suppressed TSE Imaging of the Human Knee
Xiaowei Zou1, Venkata V Chebrolu2, and Nakul Gupta3
1Siemens Medical Solutions USA Inc., Houston, TX, United States, 2Siemens Medical Solutions USA Inc., Rochester, MN, United States, 3Department of Radiology, Houston Methodist Research Institute, Houston, TX, United States
UNICORN is a promising method to improve uniformity and
contrast of 7T clinical fat-suppressed TSE images of the human knee.
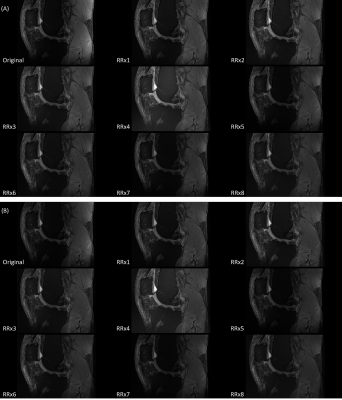
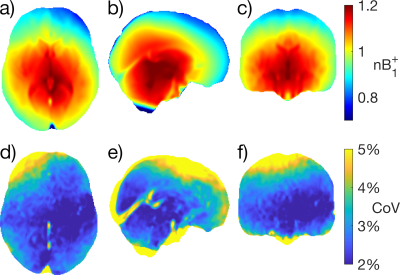
Figure 2: Exemplary images of the original and UNICORN+B1
images of RRx1 to RRx8 of (A) FA = 126o and (B) FA = 163o.
Each image was automatically windowed individually.
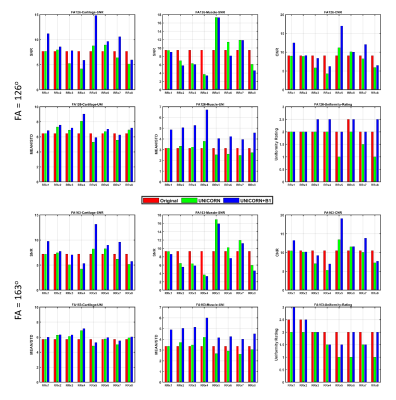
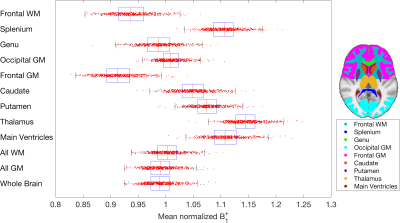
Figure 1: Quantitative ROI analysis and qualitative
clinical evaluation for the eight different UNICORN settings RRx1 to RRx8 of FA
= 126o (top) and FA = 163o (bottom). Each setting
reconstructed three image series: original without UNICORN and B1 filtering
(original, red), UNICORN without B1 filtering (UNICORN, green), and UNICORN
with B1 filtering (UNICORN+B1, blue).
-
Correcting Signal Intensity Bias in 19F MR Imaging of Inflammation by Statistical Modelling
Ludger Starke1, Thoralf Niendorf1, and Sonia Waiczies1
1Berlin Ultrahigh Field Facility (B.U.F.F.), Max Delbrück Center for Molecular Medicine in the Helmholtz Association, Berlin, Germany
Labeling cells with 19F NPs enables
localization of inflammation and monitoring of cell therapy. Systematic overestimation
of signal intensities has been observed. We propose a statistical model which successfully
removes this bias and improves the reliability of quantitative 19F
MRI.
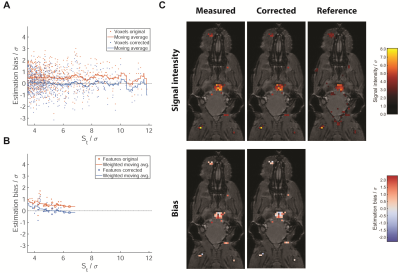
Example in
vivo dataset. Estimation bias including moving average for individual
voxels (A) and averaged over signal features (B). The area of markers is
proportional to the number of voxels in the feature. (C) Example slice from the
same 3D dataset. 19F-NPs
are taken up by inflammatory cells, which then accumulate at sites of inflammation. The first row shows 19F-MR
signal intensity for test data after RNBC (measured) and with model based bias
correction (corrected), as well as the reference data. The second line shows
estimation bias computed by comparison of test and reference data.
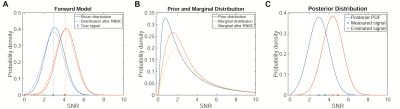
(A) Rician noise with known noise level is used
for the forward model. (B) The true signal intensities are assumed to be drawn
from a positively skewed probability distribution. Here a log-normal prior is shown.
The measured data is thus drawn from a marginal distribution computed by
integrating the product of forward model and prior distribution. The right
shift of probability mass for signal levels above the detection threshold leads
to the observed overestimation. (C) Posterior distributions for two measured
signal levels. The posterior mean gives the corrected signal
-
Automated 3D modeling and analysis of cerebral small vessels with MR angiography at 7 Tesla
Zhixin Li1,2,3, Yue Wu1,2,3, Dongbiao Sun1,2,3, Jing An4, Qingle Kong5, Rong Xue1,2,3, Yan Zhuo1,2,3, and Zihao Zhang1,2,3
1State Key Laboratory of Brain and Cognitive Science, Institute of Biophysics, Chinese Academy of Sciences, Beijing, China, 2The Innovation Center of Excellence on Brain Science, Chinese Academy of Sciences, Beijing, China, 3University of Chinese Academy of Sciences, Beijing, China, 4Siemens Shenzhen Magnetic Resonance Ltd., Shenzhen, China, 5MR Collaboration, Siemens Healthcare Ltd, Beijing, China
A
comprehensive framework was proposed to overcome the challenges in the automated
modeling of 3D cerebral small vessels with 7T TOF-MRA. The vasculature
and quantification of LSA were obtained in an automated
way, which facilitate related radiological studies in the future.
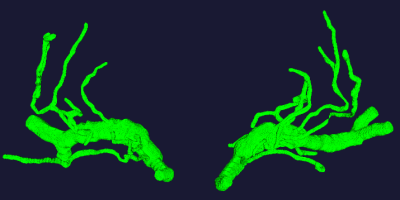
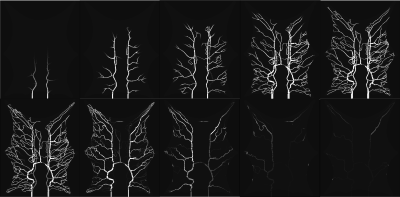
Figure 1. The 3D vasculature from 7T TOF-MRA obtained by our progressive method.
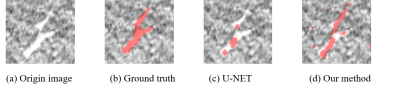
Figure 2. Comparison between the segmentation results of our method and U-NET. (a)
Origin image. (b) Ground truth. (c) Result of U-NET. (d) Result of our method.
-
Impact of ASL modelling strategies on cerebral blood flow and reactivity assessment
Joana Pinto1, Nicholas P. Blockley2, James W. Harkin3, and Daniel P. Bulte1
1Institute of Biomedical Engineering, Department of Engineering Science, University of Oxford, Oxford, United Kingdom, 2School of Life Sciences, University of Nottingham, Nottingham, United Kingdom, 3Respiratory Medicine Department, School of Medicine, University of Nottingham, Nottingham, United Kingdom
Our results highlight the importance of multiple-PLD ASL strategies for accurate CBF and CVR quantification. Furthermore, when using this strategy, the modelling options used significantly impact CBF quantification, regardless of the condition studied.
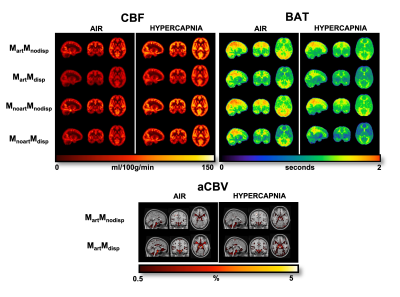
Figure 1. Orthogonal representations of CBF, BAT, and aCBV maps of one subject for the different modelling strategies and conditions (air and hypercapnia). aCBV maps are only obtained when using strategies where the macrovascular component is modelled (Mart). MartMnodisp - model with macrovascular component but without dispersion, MartMdisp - model with macrovascular and dispersion components, MnoartMnodisp - model without macrovascular and dispersion components, MnoartMdisp - model with dispersion but without macrovascular component.
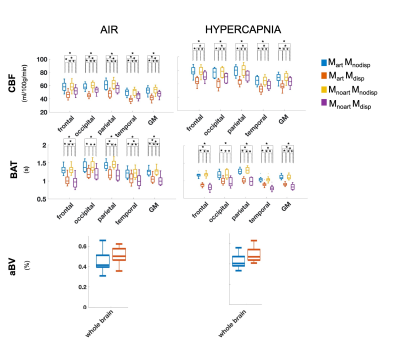
Figure 2. Regional analysis of the different haemodynamic parameters (CBF, BAT and aBV; rows) with the different modelling strategies (colors, correspondence detailed in Figure 1 legend) and conditions (columns). Statistically significant results are highlighted with * (p>0.05, corrected for multiple comparisons).
-
Improving the predictive power of The Virtual Brain in healthy and neurodegenerative diseases with cerebro-cerebellar loops integration.
Anita Monteverdi1,2, Fulvia Palesi1,2, Claudia AM Gandini Wheeler-Kingshott 1,2,3, and Egidio D'Angelo1,2
1Brain Connectivity Center Research Department, IRCCS Mondino Foundation, Pavia, Italy, 2Brain and Behavioral Sciences, University of Pavia, Pavia, Italy, 3NMR Research Unit, Queen Square MS Centre, Department of Neuroinflammation, UCL Queen Square Institute of Neurology, Faculty of Brain Sciences, UCL, London, United Kingdom
The integration of cerebro-cerebellar connections in The Virtual Brain increases its ability to predict subject-specific brain dynamics both in healthy and in pathological conditions, i.e. Alzheimer’s disease and Frontotemporal Spectrum Disorder.
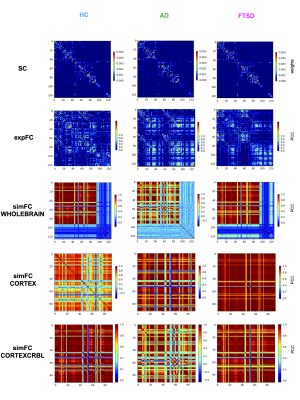
Fig.1| The Virtual Brain (TVB) simulation was performed in three different conditions: healthy (HC), Alzheimer’s disease (AD) and Frontotemporal Spectrum Disorder (FTSD). For each group a randomly chosen subject is reported as an example. Each row shows structural connectivity (SC), experimental functional connectivity (expFC) and simulated functional connectivity (simFC) obtained with three different networks: whole-brain, cortical subnetwork (CORTEX) and embedded cerebro-cerebellar subnetwork (CORTEXCRBL).
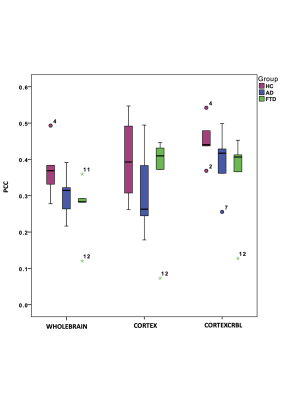
Fig.2| Boxplot of Pearson correlation coefficient (PCC) between experimental and simulated functional connectivity for all groups (healthy, HC Alzheimer’s disease, AD Frontotemporal Spectrum Disorder, FTSD) and networks. PCC values obtained integrating cerebro-cerebellar connections (CORTEXCRBL) are higher than PCC values obtained with the other networks (WHOLEBRAIN and CORTEX) both in healthy and pathological conditions.
-
Hemodynamic simulations reveal changes in ascending venules leads to enhanced venous CBV response to arterial dilation.
Grant Hartung1, Joerg Pfannmoeller1, Avery J. L. Berman1, and Jonathan R. Polimeni1
1Athinoula A. Martinos Center for Biomedical Imaging, Boston, MA, United States
We adapted realistic models of
cortical microvasculature to alter the topology of the vascular network and
performed dynamical simulations of blood flow and volume changes following
neural activity. We find that the topology changes cause qualitatively
different blood volume responses.
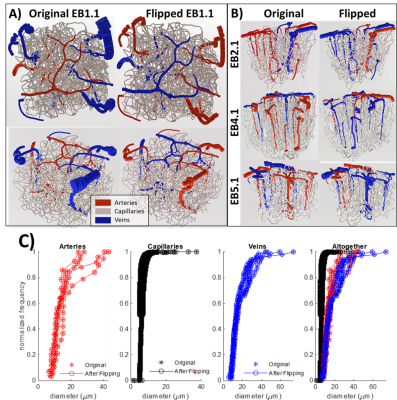
Figure
1. Visualization of A) the first network and B)
the other three networks both (Left Column) before and (Right Column) after the
anatomical swapping of arteries and veins. Not only was the labeling swapped
but the diameter spectra were also reassigned so that the newly assigned
arteries have the same diameter distribution as the previous arteries and
similarly the veins share the diameter spectra of the original veins. C) This
topological matching is also reflected by plotting the diameter spectra of the
arteries, capillaries, and veins from before and after swapping the anatomy.
Figure
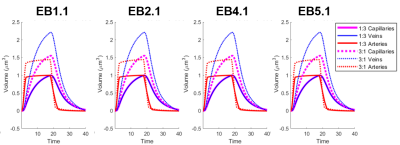
4. Visualization of the cerebral blood volume
(CBV) time course for all 4 VANs. The dilation in the experimental group (3:1
ratio) is significantly higher than the control counterpart in each case.
-
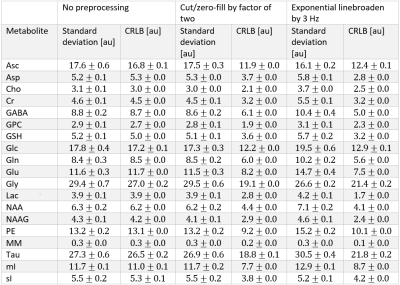
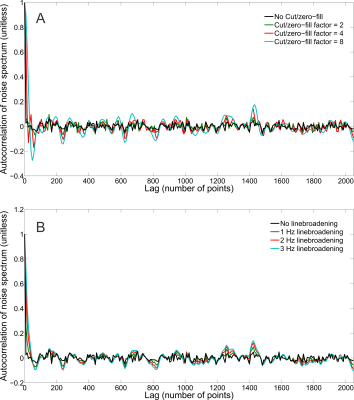
Pre-processing of high-resolution gradient-echo images for laminar fMRI applications
Patricia Pais-Roldan1, Seong Dae Yun1, and Jon N Shah1
1Forschungszentrum Juelich, Juelich, Germany
Sophisticated
pre-processing with added voxel-wise regression of the phase signal
from the pre-processed magnitude increases the accuracy of GE
signals, allowing whole-brain, high-resolution GE-sequences to be
exploited in the resting-state laminar fMRI field.
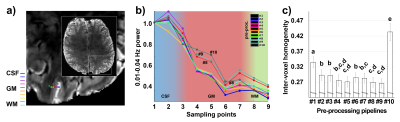
Figure
2.
Signal
amplitude and independence in resting-state data.
a)
The image shows the location of nine voxels crossing the cortical
ribbon (“cross-cortex line”) that were used in the successive
analysis. b)
Power of low-frequency fluctuations at different points of the
cross-cortex line calculated for ten different pre-processing
pipelines. c)
Mean homogeneity, assessed as correlation and coherence between pairs
of voxels in the cross-cortex-line. Error bars represent standard
error of the mean. Different letters indicate significantly different
groups.
Figure
3.
Identification
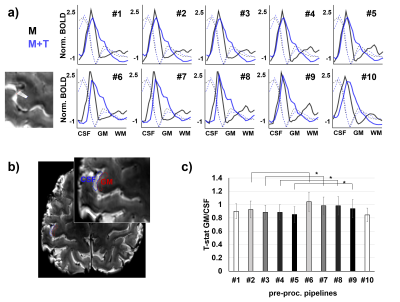
of evoked responses. a)
Line activation profiles, calculated as the mean beta-value across 20
lines (see inset on the bottom left), for two task-fMRI scans
involving either motor-only (M) or motor and sensory processing
induced by touch (M+T), computed after pre-processing with ten
different pipelines. The dashed lines indicate the intensity of the
mean functional image. b)
ROIs selected for group analysis. c)
The GM to CSF ratio of the t-statistic. Asterisks indicate
significant differences between pre-processing pipelines (p<0.05).
-
Improved signal integrity in multi-echo fMRI through locally low-rank tensor regularization
Nolan K Meyer1, Daehun Kang2, MyungHo In2, John Huston2, Yunhong Shu2, Matt A Bernstein2, and Joshua D Trzasko2
1Mayo Clinic Graduate School of Biomedical Sciences, Rochester, MN, United States, 2Radiology, Mayo Clinic, Rochester, MN, United States
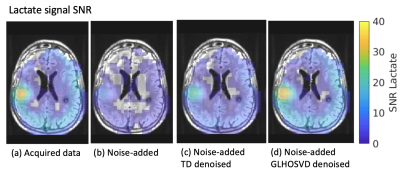
Locally low-rank regularization methods are extended to denoise multi-echo resting-state functional MRI data, yielding substantial increases in temporal signal to noise ratio and robustly improved network connectivity mapping.
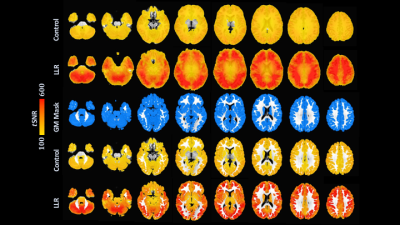
Figure 1. Group
mean atlased tSNR,
identically viewed and windowed (rows 1-2), and masked to grey matter (rows
3-5). Control images shown in rows 1/4; LLR-denoised images, rows 2/5. For
control data, global, masked, and default mode, auditory, and sensorimotor
network seed mean and standard deviation tSNRs were 180.98 ± 17.19, 181.75 ± 18.40,
132.28 ± 7.29, 236.79 ± 28.67, and 246.87 ± 41.24 respectively; for LLR data,
454.10 ± 62.76, 436.63 ± 66.58, 237.83 ± 27.87, 498.25 ± 71.02, and 576.57 ±
161.65.
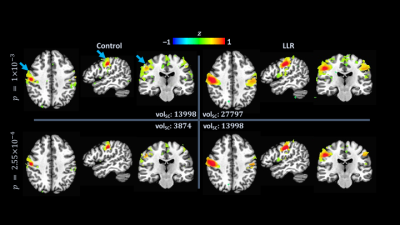
Figure 5. Group-level
sensorimotor network connectivity statistical map. Left column shows control
data; right column, LLR-denoised data. Shown for each variant and threshold are
volumes (volSC) of the seed-containing cluster (blue
arrows). Clusters are thresholded in
volume to 40 voxels. Top row has maps thresholded to $$$p=1\times{10}^{-3}$$$;
bottom row, $$$p=2.55\times{10}^{-4}$$$ (reduction to $$$25.5\%$$$ of baseline) for LLR-denoised data to replicate volSC of control. LLR-denoised data show a $$$98.58\%$$$ increase in volSC at $$$p=1\times{10}^{-3}$$$.
-
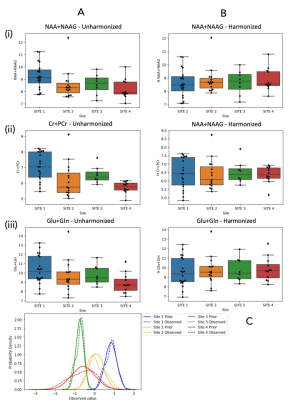
Comparison of Region-Wise and Voxel-Wise Diffusion Signal Harmonisation via Z-scoring and ComBat
Stefan Winzeck1,2, Maíra Siqueira Pinto3, Virginia F. J. Newcombe2, Ben Glocker1, David K. Menon2, and Marta M. Correia4
1BioMedIA, Department of Computing, Imperial College London, London, United Kingdom, 2Division of Anaesthesia, Department of Medicine, University of Cambridge, Cambridge, United Kingdom, 3Universitair Ziekenhuis Antwerpen, Antwerp, Belgium, 4MRC Cognition and Brain Sciences Unit, University of Cambridge, Cambridge, United Kingdom
Z-scoring and ComBat could both reduce variation in FA and MD derived from different scanning protocols. The signal harmonisations on a regional or voxel-wise level were equally successful when DWI data were processed identically.
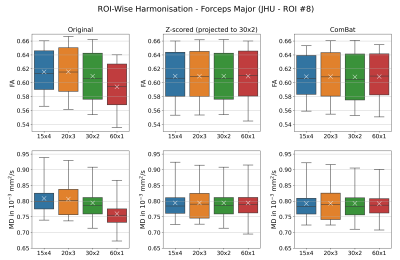
Figure1. Harmonisation of FA and MD on ROI-wise level via Z-scoring or ComBat was equally effective. While Z-scoring projected diffusion metrics independently (here to reference scheme 30x2), ComBat adjusted signal across all acquisition schemes.
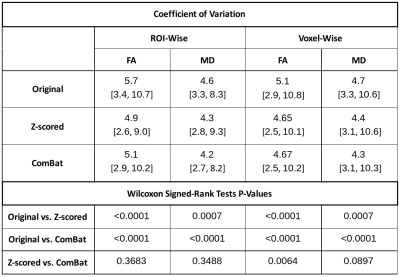
Table 1. Coefficient of Variation of JHU ROI Means Before and After Data Harmonisation. All CV values displayed as mean [min, max] in %.