-
Diagnosis of Breast Cancer Using Radiomics Models Built Based on DCE-MRI and Mammography Compared to BI-RADS Reading
Zhongwei Chen1, Yang Zhang2, Jiejie Zhou1, Youfan Zhao1, Haiwei Miao1, Huiru Liu1, Shuxin Ye1, Nina Xu1, Meihao Wang1, and Min-Ying Su2
1Department of Radiology, The First Affiliated Hospital of Wenzhou Medical University, wenzhou, China, 2Department of Radiological Sciences, University of California, Irvine, CA, United States
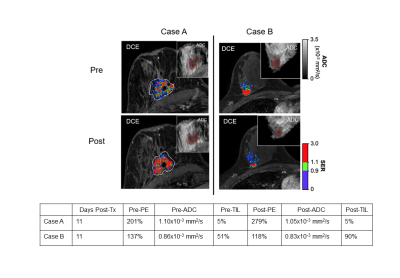
The model built based on all MRI and mammography features yielded the highest accuracy and had significantly better diagnostic performance than BI-RADS using threshold of 4A or 4B.
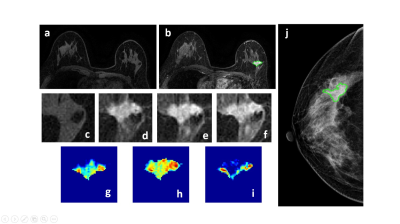
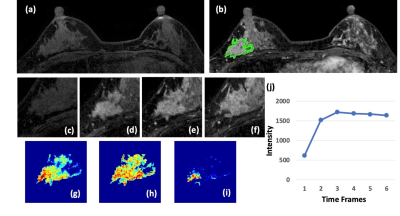
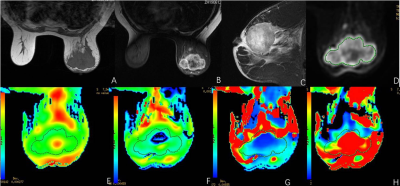
Figure 1: A 50-year-old patient with a malignant cancer showing smooth boundary. (a) F1 Precontrast image. (b) The F2 postcontrast image. (c) The F1 precontrast image. (d) The F2 postcontrast image. (e) The F3 postcontrast image. (f) The last F6 postcontrast image,showing persistent enhancement with increased intensity over time. (g) The washin signal enhancement map F2-F1. (h) The F3-F1 signal enhancement map. (i) The washout F6-F3 map. (j) The corresponding CC view mammography, the lesion mass was outlined by green line.
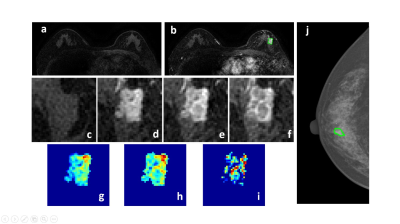
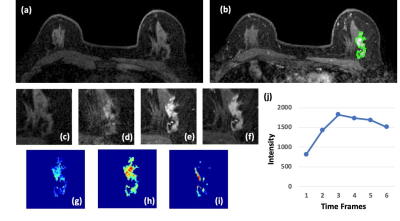
Figure 2: A 58-year-old patient with a malignant cancer showing smooth boundary. (a) F1 Precontrast image. (b) The F2 postcontrast image. (c) The F1 precontrast image. (d) The F2 postcontrast image. (e) The F3 postcontrast image. (f) The last F6 postcontrast image, showing persistent enhancement with increased intensity over time. (g) The washin signal enhancement map F2-F1. (h) The F3-F1 signal enhancement map. (i) The washout F6-F3 map. (j) The corresponding CC view mammography, the lesion mass was outlined by green line.
-
Predicting Underestimation of Invasive Cancer in Patients with Core-needle Biopsy-diagnosed Ductal Carcinoma in Situ using Deep Learning
Luu-Ngoc Do1, Chae Yeong Im2, Jae Hyuk Park2, So Yeon Ki3, Ilwoo Park2,4,5, and Hyo Soon Lim2,3
1Department of Radiology, Chonnam National University, Gwangju, Korea, Republic of, 2College of Medicine, Chonnam National University, Gwangju, Korea, Republic of, 3Department of Radiology, Chonnam National University Hwasun Hospital, Hwasun, Korea, Republic of, 4Department of Artificial Intelligence Convergence, Chonnam National University, Gwangju, Korea, Republic of, 5Department of Radiology, Chonnam National University Hospital, Gwangju, Korea, Republic of
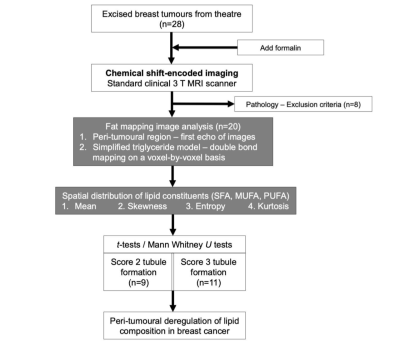
In this paper, we developed a 2-step algorithm
utilizing a recurrent CNN model and demonstrated that the proposed algorithm
can provide a method to predict invasiveness in the core needle biopsy-proven
DCIS with the results comparable to the previous reports.
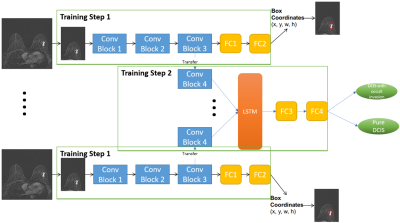
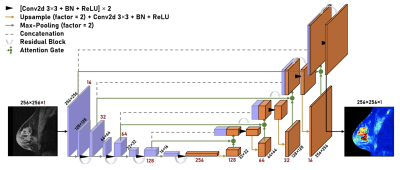
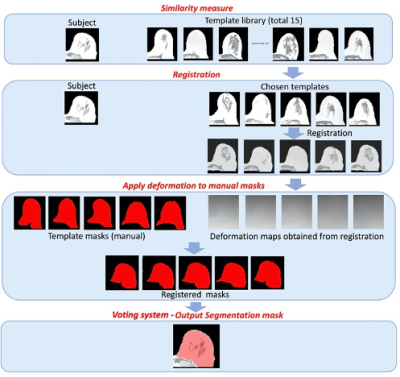
Figure 1. The diagram of the proposed
two-step deep learning model.
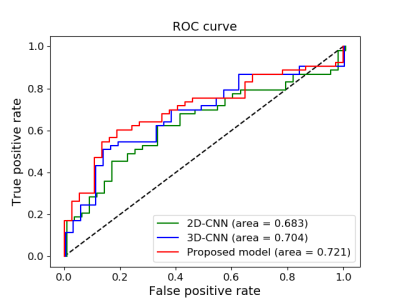
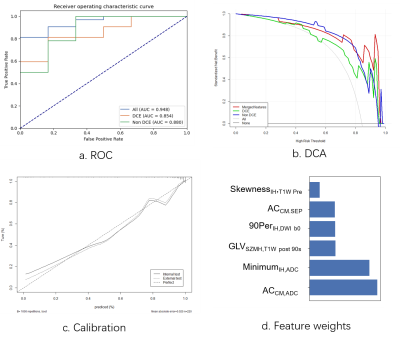
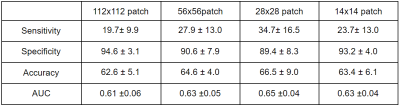
Figure 3. ROC curves of 3 models on testing data
-
Combination of pharmacokinetic parameters and texture features of DCE-MRI for predicting preoperative classification of breast cancer
Xia Wu1,2,3, Zhou Liu4, Meng Wang4, Zhe Ren1,2,3, Ya Ren4, Jie Wen4, Qian Yang4, Xin Liu1,2,3, Hairong Zheng1,2,3, and Na Zhang1,2,3
1Paul C. Lauterbur Research Center for Biomedical Imaging, Shenzhen Institutes of Advanced Technology, Chinese Academy of Sciences Synopsis, ShenZhen, China, 2Key Laboratory for Magnetic Resonance and Multimodality Imaging of Guangdong Province, Shenzhen Institutes of Advanced Technology, Chinese Academy of Sciences, ShenZhen, China, 3CAS key laboratory of health informatics, Shenzhen Institutes of Advanced Technology, Chinese Academy of Sciences, ShenZhen, China, 4Department of Radiology, National Cancer Center/Cancer Hospital and Shenzhen Hospital, Chinese Academy of Medical Sciences and Peking Union Medical College, ShenZhen, China
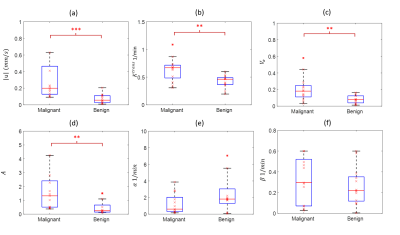
Combination of texture features and pharmacokinetic
parameters for a classifier can improve the accuracy of classification.
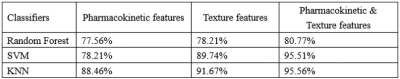
Table 1: The accuracy of breast cancer grading using three classifiers according
to different feature sets
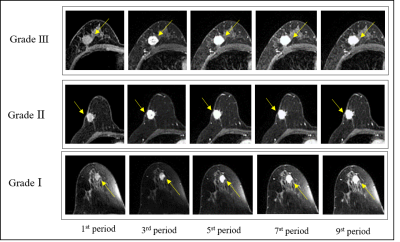
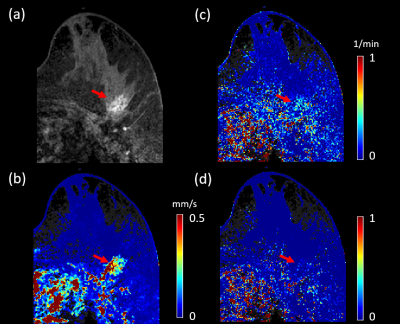
Figure 1: Representative images of Grade Ⅰ-Ⅲ
breast cancer. The arrows point to the breast cancer lesions.
-
Classification of Breast Cancer Molecular Subtypes on DCE-MRI Using Radiomics Analysis with Various Machine Learning Algorithm
Yan-Lin Liu1, Yang Zhang1,2, Jeon-Hor Chen1,3, Siwa Chan4, Jiejie Zhou5, Meihao Wang5, and Min-Ying Su1
1Department of Radiological Sciences, University of California, Irvine, CA, United States, 2Department of Radiation Oncology, Rutgers-Cancer Institute of New Jersey, Robert Wood Johnson Medical School, New Brunswick, NJ, United States, 3Department of Radiology, E-Da Hospital and I-Shou University, Kaohsiung, Taiwan, 4Department of Medical Imaging, Taichung Tzu-Chi Hospital, Taichung, Taiwan, 5Department of Radiology, The First Affiliate Hospital of Wenzhou Medical University, Wenzhou, China
Patients were classified into three molecular Subtypes. Five machine learning algorithms were implemented to build models. For TN vs. Non-TN, accuracy was 91.0% in training and 88.2% in testing datasets. For HER2+ vs. HER2-, accuracy was 90.4% in training and 86.2% in testing datasets.
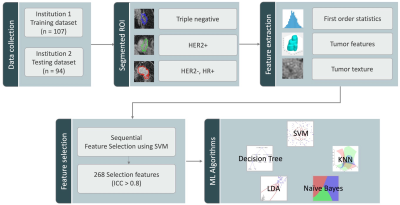
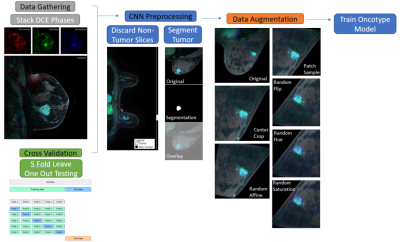
Figure 1: The flowchart of the experimental design. The tumor is segmented by Fuzzy-C-means clustering algorithm on F2 post-contrast image, and then the tumor ROI is mapped to 3 generated DCE parametric maps. On each map, 32 first-order and 75 texture parameters are extracted using the PyRadiomics. For each case, a total of 268 radiomics features with ICC ³ 0.8 are used to build models using five machine learning algorithms to differentiate three different molecular subtypes.
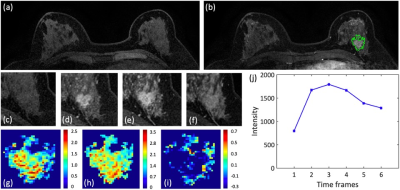
Figure 2: A 48-year-old patient with an invasive ductal cancer (TN). (a) F1 Pre-contrast image. (b) F2 post-contrast image. (c-i): The zoom-in smallest bounding box containing the tumor. (c) F1 pre-contrast, (d) F2 post-contrast, (e) F3 post-contrast, (f) The last F6 post-contrast image. (g) The wash-in signal enhancement map F2-F1, (h) The maximum F3-F1 signal enhancement map, (i) The wash-out F6-F3 map. (J) The DCE time course shows a typical wash-out pattern.
-
Characterization of Breast Tumor using Machine Learning based upon Multi-parametric MRI Features.
Snekha Thakran1, Rakesh Kumar Gupta2, and Anup Singh1,3
1Centre for Biomedical Engineering, Indian Institute of Technology Delhi, New Delhi, India, Delhi, India, 2Department of Radiology, Fortis Memorial Research Institute, Haryana, Gurgaon, India, Delhi, India, 3Department of Biomedical Engineering, All India Institute of Medical Science, New Delhi, India, Delhi, India
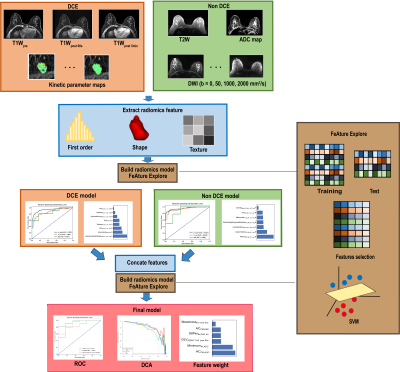
The combination of support-vector-machine(SVM) with Wrapper method using Adaptive-Boosting(AdaBoost) technique resulted in high sensitivity(0.94±0.07), specificity(0.80±0.05), and accuracy(0.90±5.48) in classification of low-grade vs. high-grade tumors.
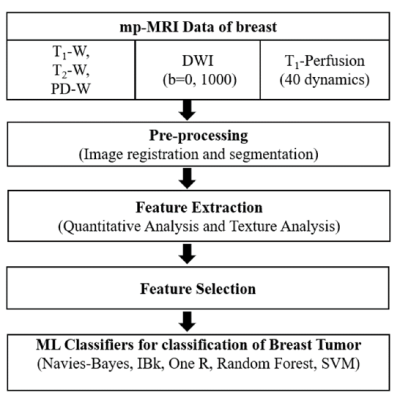
Figure-1: The flow chart of the proposed framework.
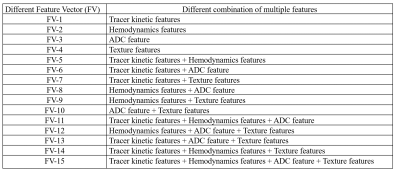
Table-1: List of different feature vectors and their description.
-
A meta-analysis of the diagnostic performance of machine learning–based MRI for axillary lymph node metastasis in breast cancer patients
Chen Chen1, Fabao Gao1, and Xiaoyue Zhou2
1Department of Radiology, West China Hospital, Chengdu, China, 2MR Collaboration, Siemens Healthineers Ltd., Shanghai, China
Machine learning can be used to predict the
presence of axillary lymph node metastasis in breast cancer patients.
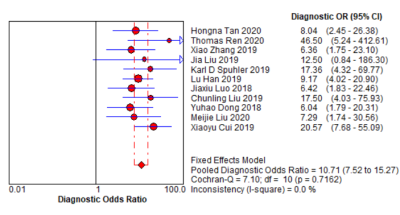
Fig. 3. Forest plot of single studies for
the pooled diagnostic odds ratio and 95% CI
-
Early prediction of pathologic complete response to neoadjuvant systemic therapy for triple-negative breast cancer using deep learning
Zijian Zhou1, David E. Rauch1, Jong Bum Son1, Benjamin C. Musall1, Nabil A. Elshafeey2, Jason B. White3, Mark D. Pagel4, Stacy Moulder3, and Jingfei Ma1
1Imaging Physics, The University of Texas MD Anderson Cancer Center, Houston, TX, United States, 2Breast Imaging, The University of Texas MD Anderson Cancer Center, Houston, TX, United States, 3Breast Medical Oncology, The University of Texas MD Anderson Cancer Center, Houston, TX, United States, 4Cancer Systems Imaging, The University of Texas MD Anderson Cancer Center, Houston, TX, United States
Using convolutional and recursive neural networks on pre-treatment DCE
and DWI, the deep learning ensemble can predict pathologic complete response to
neoadjuvant systemic therapy for triple-negative breast cancer patients.
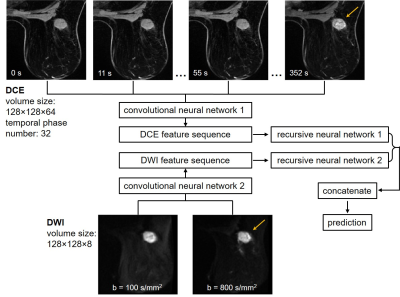
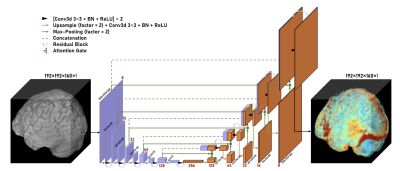
Figure 1. Illustration of the deep learning ensemble developed for pathologic
complete response (pCR) prediction for the triple-negative breast cancer
cohort. The ensemble took the pre-treatment DCE and DWI as input. Two
convolutional neural networks extracted features from the DCE and DWI,
respectively. The sequences of features were then input to the two recursive
neural networks, respectively. Outputs of the recursive neural networks were
concatenated and used for pCR or non-pCR prediction.
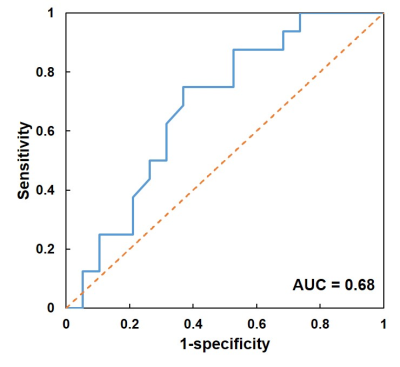
Figure 3. Receiver operating characteristic curve (blue) of the prediction using the deep
learning ensemble. Using the pre-treatment DCE and DWI, the ensemble achieved
the best accuracy of 69%, with the sensitivity of 75% for pCR patients and
specificity of 63% for non-pCR patients. The area under the curve (AUC) was
0.68.
-
Application of Two Deep Learning Networks for Diagnosis of Breast Cancer on MRI: Automatic Detection Using Mask R-CNN Followed by Classification Using ResNet50
Yang Zhang1,2, Yan-Lin Liu2, Ke Nie1, Jiejie Zhou3, Siwa Chan4, Vivian Youngjean Park5, Min Jung Kim5, Zhongwei Chen3, Jeon-Hor Chen2,4, Meihao Wang3, and Min-Ying Su2
1Department of Radiation Oncology, Rutgers-Cancer Institute of New Jersey, Robert Wood Johnson Medical School, New Brunswick, NJ, United States, 2Department of Radiological Sciences, University of California, Irvine, CA, United States, 3Department of Radiology, The First Affiliate Hospital of Wenzhou Medical University, Wenzhou, China, 4Department of Medical Imaging, Taichung Tzu-Chi Hospital, Taichung, Taiwan, 5Department of Radiology and Research Institute of Radiological Science, Severance Hospital, Yonsei University College of Medicine, Seoul, Korea, Republic of
These
research shows the potential of Mask R-CNN detection followed by ResNet50
classification for automatic detection and further characterization of
identified lesions to develop a fully-automatic computer-aided diagnosis system
for breast MRI.
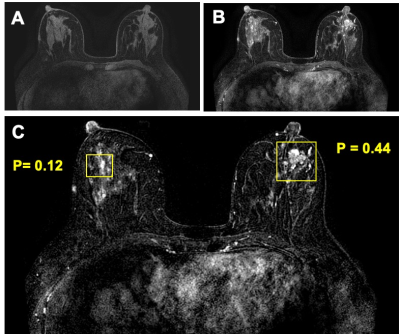
Figure
5: True
negative (TN) case example from a 44-year-old patient with a confirmed benign adenosis in the left breast. Extensive parenchymal enhancements are seen in both breasts. (a) Pre-contrast image acquired using fat-sat sequence; (b) Post-contrast image; (c) Tumor detection results searched by the Mask R-CNN algorithm. Two boxes are generated to identify two suspicious lesions, one in each breast. After evaluation by ResNet50 network, the left lesion has a malignant probability of 0.44, thus correctly diagnosed as benign. The parenchymal enhancements from normal tissues in the right breast has a very low malignant probability of 0.12. These results illustrate the potential of Mask R-CNN detection followed by ResNet50 classification for automatic detection and further characterization of identified lesions to develop a fully-automatic computer-aided diagnosis system for breast MRI.
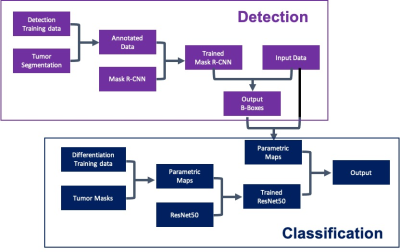
Figure 1: Flow
diagram of the training and testing
courses using Mask R-CNN for
detection (shown in purple) and
ResNet50 for classification (shown in blue).
-
A Parsimonious Assessment of Breast Density Classes from Quantitative, AI-based FGT Volume Segmentations
Pablo F. Damasceno1,2, Tatiana Kelil1,2, Rutwik Shah1,2, Bruno Astuto Arouche Nunes1,2, Jason Crane1,2, and Sharmila Majumdar1,2
1Radiology and Biomedical Imaging, University of California San Francisco, San Francisco, CA, United States, 2Center for Intelligent Imaging, University of California San Francisco, San Francisco, CA, United States
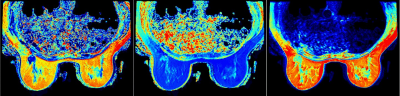
We use deep learning to compute FGT amounts in breast MRI and evaluate its relationship to qualitative FGT categories assigned by a radiologist at the time of examination, opening the door for a parsimonious relationship between qualitative classes and quantitative density values.
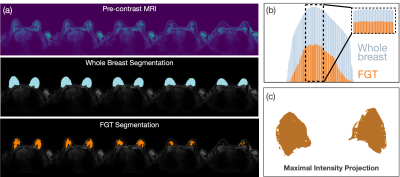
Fig. 1 Methods of FGT ratio calculation. (a) Example slices of pre-contrast image (top), whole breast (middle) and FGT segmentations (bottom) for one typical exam labelled ‘extreme fibroglandular tissue’ according to the radiology report. (b) Ratio of FGT (orange) to whole breast (blue) segmentations is higher for center slices (ρ=49%, inset) compared to all slices (ρ=36%). (c) Resulting FGT segmentation following the Maximal Intensity Projection method skews densities even more toward higher values (ρ=70%).
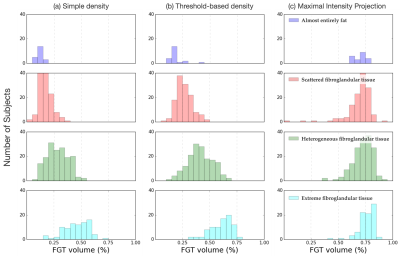
Fig. 2. Distribution of FGT amounts per radiology-defined class for different density calculation methods. (a) Simple density, where all slices were considered for the FGT amount calculation, (b) threshold-based density, where only slices with a significant amount of FGT are considered, and (c) maximal intensity projection, where segmentations across all slices were projected onto a 2-dimensional array prior to the density calculation.
-
Correction of Artifacts Induced by B0 Inhomogeneities with RPG on a Breast Diffusion Phantom
Lauren K Fang1, Ana E Rodriguez-Soto1, Summer J Batasin2, Kathryn E Keenan3, and Rebecca A Rakow-Penner2
1Radiology, University of California San Diego, La Jolla, CA, United States, 2University of California San Diego, La Jolla, CA, United States, 3National Institute of Standards and Technology, Boulder, CO, United States
Reduced-FOV DWI without parallel imaging (PI) and full-FOV DWI with PI reduced initial distortions in the phase encoding (PE) direction. Reduced-FOV images had the largest initial distortion in the frequency encoding direction. RPG improved distortion artifacts in the PE direction.
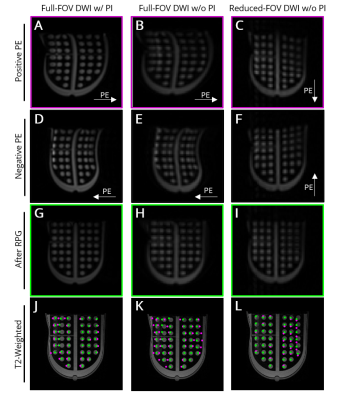
Figure 1. Representative images of breast distortion phantom polycarbonate grid collected with full-FOV EPI with (left) and without (middle) parallel imaging (PI) and reduced-FOV EPI without PI (right). Images of positive (A-C) and negative (D-F) PE direction before RPG distortion correction. (G-I) Positive PE direction images after RPG correction. (J-L) Overlay of each circle’s center location from DWI data before (magenta) and after (green) RPG on anatomical reference image.
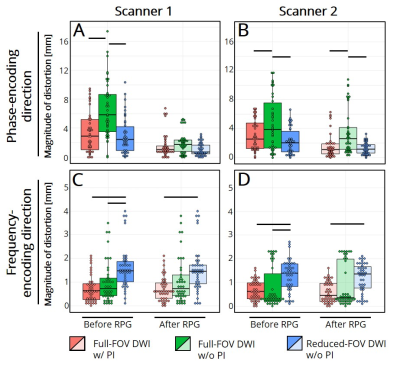
Figure 2. Magnitudes of distortion artifacts before and after RPG correction in (A,B) the phase-encoding, (C,D) frequency-encoding directions for full-FOV EPI with (red) and without (green) parallel imaging (PI) and reduced-FOV EPI without PI (blue). Horizontal black bars indicate p<0.05 significance.
-
Influence of gadolinium-based contrast agent on DWI and ADC values in breast lesions
Kay van der Hoogt1, Robert-Jan Schipper1, Ronni Wessels1, Cees de Graaf1, Arjan te Boekhorst1, Leon ter Beek2, Regina Beets-Tan1, and Ritse Mann1
1Radiology, the Netherlands Cancer Institute – Antoni van Leeuwenhoek, Amsterdam, Netherlands, 2Medical Physics, the Netherlands Cancer Institute – Antoni van Leeuwenhoek, Amsterdam, Netherlands
Currently,
preliminary data shows a decrease in ADC after contrast administration.
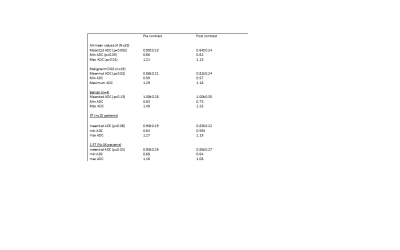
Table 2: ADC measures for pre and post-contrast DWI

Figure 1: Bland-altman plot for all lesions, comparing pre and post-contrast ADC
-
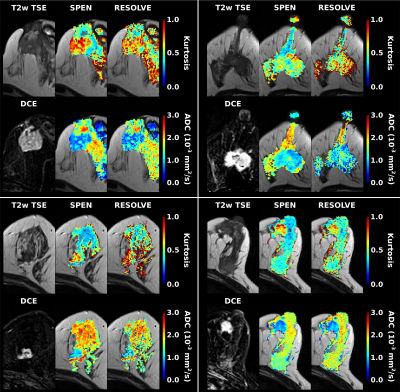
A Comparison of different models of diffusion-weighted MRI in distinguishing benign and malignant breast lesions
Muzhen He1, Huiping Ruan1, Mingping Ma1, Zhongshuai Zhang2, and Robert Grimm2
1Radiology, Provincial Clinical College of Fujian Medical University, Fujian Provincial Hospital, Fuzhou, China, 2Siemens Healthcare Ltd, Shanghai, China
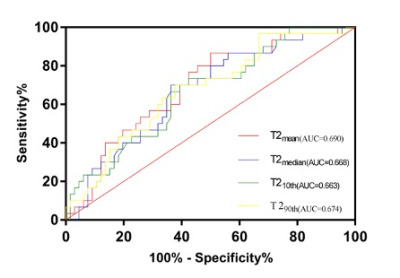
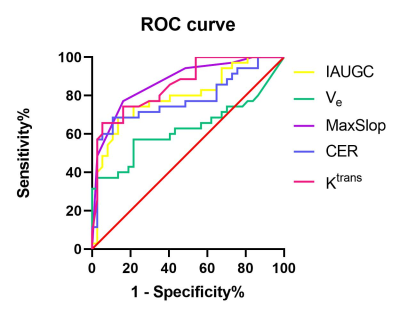
A Comparison of apparent diffusion coefficient (ADC), intravoxel incoherent motion (IVIM) and diffusional kurtosis imaging (DKI) in distinguishing benign and malignant breast lesions
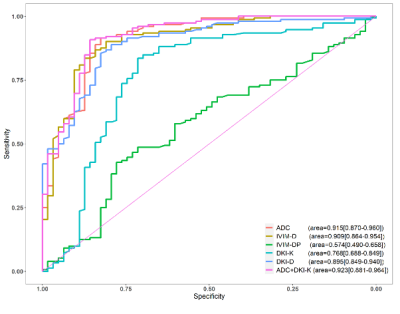
Figure 7. The area under the ROC curve of the mean ADC, IVIM-D, IVIM-DP, DKI-K and DKI-D values are 0.915, 0.909, 0.574, 0.768 and 0.895, which indicates that the ADC value is the best single quantitative parameters to distinguish benign and malignant breast lesions. The area under the ROC curve of combined ADC and DKI-K value is 0.923.
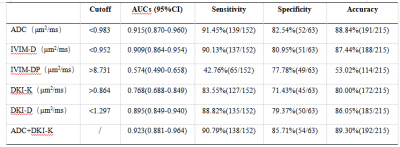
Table2:Diagnostic Effectiveness for Benign and Malignant Lesions of Quantitative Parameters
-
A BI-RADS like lexicon for Breast DWI: Proposal and early evaluation
Mami Iima1,2, Aika Okazawa3, Ryosuke Okumura3, Sachiko Takahara4, Tomotaka Noda3, Taro Nishi3, Yuji Nakamoto1, and Masako Kataoka1
1Diagnostic Imaging and Nuclear Medicine, Kyoto University Graduate School of Medicine, Kyoto, Japan, 2Clinical Innovative Medicine, Institute for Advancement of Clinical and Translational Science, Kyoto University Hospital, Kyoto, Japan, 3Radiology, Kitano Hospital, The Tazuke Kofukai Medical Research Institute, Osaka, Japan, 4Breast Surgery, Kitano Hospital, The Tazuke Kofukai Medical Research Institute, Osaka, Japan
Our
proposed DWI reading method based on BI-RADS lexicons from multiple b-value
images had comparable specificity and NPV to standard BI-RADS. DWI reading
method might increase diagnostic confidence in differentiating malignancy from benignity.
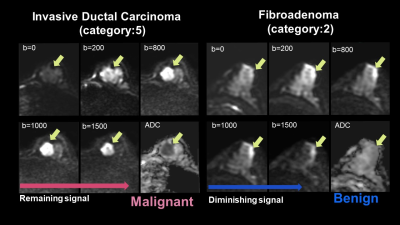
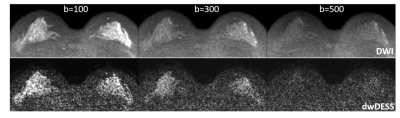
Figure 2:
the representative case of the typical malignant tumor (left). The tumor shows moderate signal intensity at low b-value, an increased signal at high b-value, and decreased ADC, suggesting malignancy. Invasive ductal carcinoma.
the representative case of the typical benign tumor (right). The tumor shows marked signal intensity at low b-value, decreased signal at high b-value, and slightly low ADC, suggesting a benign breast tumor. Fibroadenoma.
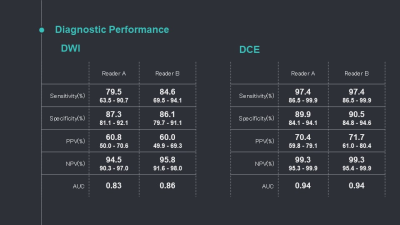
Table 2: Diagnostic performance for DWI and DCE-MRI
-
Evaluation of the efficacy of therapy for breast cancer using DWI and DCE-MRI based on acquired radial golden-angle compressed sensing
Haiyun Wang1, Qian Xu1, Gaofeng Shi1, Lijia Wang1, Qinglei Shi2, and Chen Zhang2
1CTMRI, The Fourth Hospital of Hebei Medical University, Shijiazhuang,Hebei, China, 2MR Scientific Marketing,Siemens Healthcar, Beijing, China
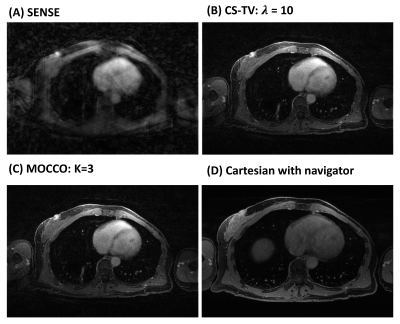
In this study, we studied the feasibility of GRASP based DCE technique and readout-segmented DWI technique in early evaluation of breast cancer response to neoadjuvant therapy. We found the combination of these demonstrated great potential in breast cancer with neoadjuvant therapy.
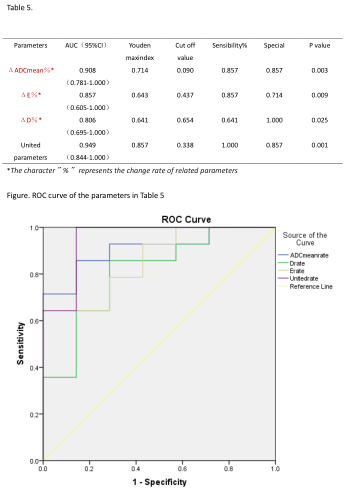
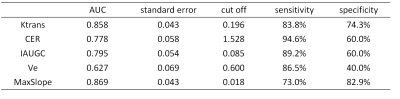
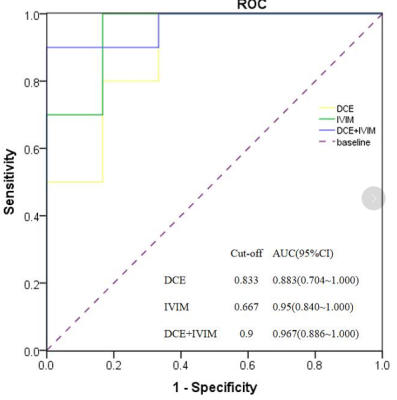
Table5 and Figure show ROC curve of the parameters in Table 5 and parameters in forecasting performance of model
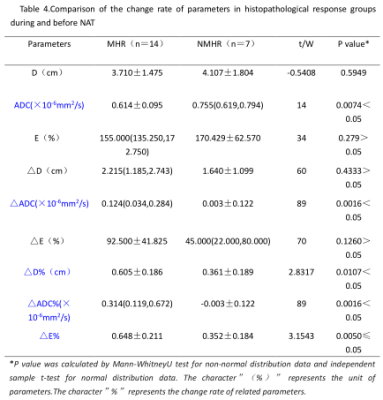
Table 4.Comparison of the change rate of parameters in histopathological
response groups during and before NAT
-
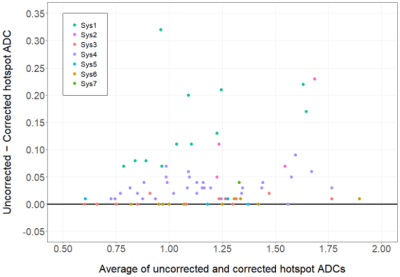
Accuracy and Precision of a Breast Diffusion Phantom Across 3T Scanners
Lauren K Fang1, Ana E Rodríguez-Soto1, Kathryn E Keenan2, and Rebecca A Rakow-Penner1
1Radiology, University of California San Diego, La Jolla, CA, United States, 2National Institute of Standards and Technology, Boulder, CO, United States
Overall accuracy and precision of DWI estimates was >88% and improved when normalized by an internal reference. High inter- and intra-scanner variability highlight the need for investigating spatial effects on breast tumor ADC heterogeneity.
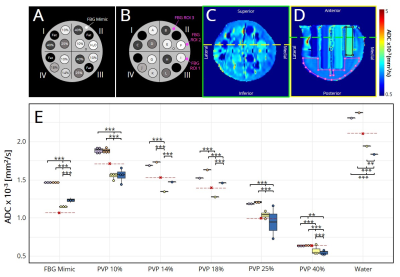
Figure 1. (A) Diffusion breast phantom schematic. Percentages indicate % w/w PVP in water. (B) Schematic with tubes and fibroglandular ROI locations. (C) Axial view of ADC map. Yellow line shows the slice at which ROIs of water (black) and fibroglandular tissue (pink) were drawn in the (D) coronal view. Green line shows the slice at which (C) was taken. (E) Median ADC, shown as dots for each tube. Red lines indicate expected values.6,8
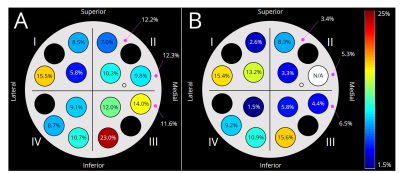
Figure 2. Coefficient of variation across scanners of (A) absolute ADC, and (B) ADC relative to water for each tube.
-
Evaluation of Lactating Breasts Using Diffusion Tensor Magnetic Resonance Imaging: A Feasibility Study.
Anabel M Scaranelo1, Hadassa Degani2, Dov Grobgeld3, Vivianne Freitas1, Shelley Westergard4, Christine Elser5, and Edna Furman-Haran3
1Medical Imaging, University of Toronto, Toronto, ON, Canada, 2DDE MRI Solutions Ltd., Tel Aviv, Israel, 3Weizmann Institute of Science, Rehovot, Israel, 4Princess Margaret Cancer Center, Toronto, ON, Canada, 5University of Toronto, Toronto, ON, Canada
A prospective feasibility study of breast DTI in high-risk lactating patients indicated high diagnostic sensitivity and specificity and a more accurate cancer detection rate than breast DCE imaging.
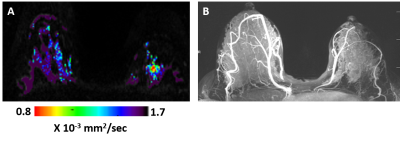
Figure 2: DTI λ1 parametric map (A) and maximum intensity projection (MIP) of the DCE images (B) in a lactating 33 years old BRCA-1 carrier woman. The λ1 parametric map depicted in the left breast a non-palpable invasive ductal carcinoma lesion (low λ1 values) that was detected by screening DTI but was not demonstrated by DCE because of the masking effect of marked background parenchymal enhancement (BIRADS 1 DCE and BIRADS 5 DTI).
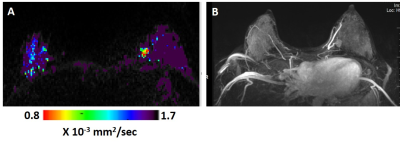
Figure 1: DTI λ1 parametric map (A) and maximum intensity projection (MIP) of the DCE images (B) in a lactating 33 years old breast cancer patient. The λ1 parametric map and the DCE images both show in the left breast a triple negative invasive ductal carcinoma mass lesion (low λ1 values ). The cancer lesion was diagnosed by both DCE (assigned BIRADS 4) and by DTI (assigned BIRADS 5).
-
Feasibility of Using a Deep Learning Reconstruction to Increase Protocol Flexibility for Breast MRI
Timothy Allen1,2, Leah C Henze Bancroft2, Lloyd Estkowski3, Ty A Cashen3, Frederick Kelcz2, Frank R Korosec1,2, Roberta M Strigel1,2,4, Orhan Unal1,2, and James H Holmes2
1Medical Physics, University of Wisconsin-Madison, Madison, WI, United States, 2Radiology, University of Wisconsin-Madison, Madison, WI, United States, 3Global MR Applications and Workflow, GE Healthcare, Madison, WI, United States, 4Carbone Cancer Center, University of Wisconsin-Madison, Madison, WI, United States
A deep
learning reconstruction was found to increase perceived signal-to-noise ratio,
sharpness, and overall image quality in T2w breast MRI. Preliminary results show that deep learning can help reverse image degradation associated with rapid high-resolution imaging.
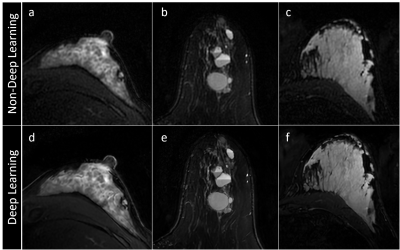
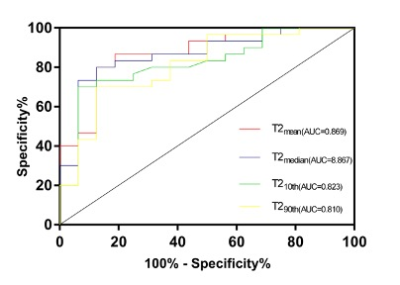
Figure 1: Axial T2w breast MR images reconstructed with deep learning scored significantly higher in SNR and image sharpness than those without deep learning. (a,d) A patient with substantial
fibroglandular tissue; (b,e) a patient with multiple simple and complicate cysts; and (c,f) a lactating
patient.
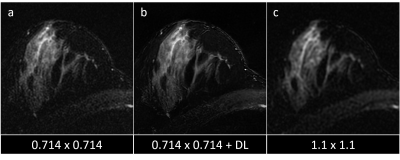
Figure 3: T2w images acquired at 0.714 x 0.714 mm2 resolution (a) appear noisier than those acquired at the standard 1.1 x 1.1 mm2 resolution (c). However, application of DL (b) increases SNR to achieve SNR more similar to the lower spatial resolution protocol.
-
Quantitative evaluation of different models of diffusion-weighted MRI for the correlation with molecular subtype of breast cancer
Muzhen He1, Huiping Ruan1, Mingping Ma2, Zhongshuai Zhang3, and Robert Grimm3
1Radiology, Provincial Clinical College of Fujian Medical University, Fujian Provincial Hospital, Fuzhou, China, 2Provincial Clinical College of Fujian Medical University, Fujian Provincial Hospital, Fuzhou, China, 3Siemens Healthcare Ltd, Shanghai, China
Quantitative evaluation of different models of diffusion-weighted magnetic resonance imaging for the correlation with molecular subtype of breast cancer
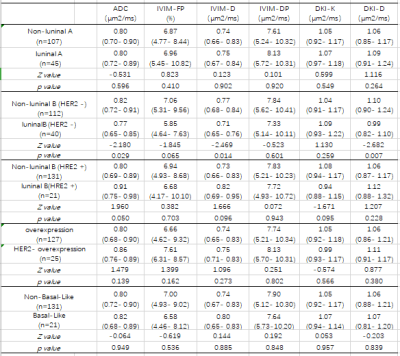
Table1: Diffusion Parameters of molecular subtype
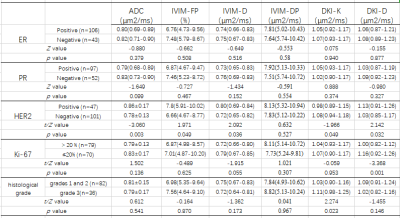
Table2: Diffusion Parameters of molecular prognostic factors
-
Differentiating breast adenosis and breast cancer lesions: Value of Synthetic MRI
Peiying Zhu1, Xiaoan Zhang1, Lin Lu1, Xin Zhao1, Qingna Xing1, Yafei Guo1, Kaiyu Wang2, Jinxia Guo2, Xueyuan Wang1, and Penghua Zhang1
1Department of Radiology, The Third Affiliated Hospital of Zhengzhou University, Zhengzhou, China, zhengzhou, China, 2GE Healthcare, MR Research China, Beijing, China, zhengzhou, China
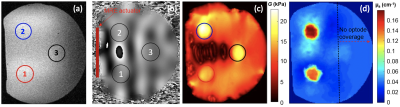
Synthetic MRI is able to obtain various image comtrasts and quantitative parameters.These parameters( T1, T2, and PD values) directly reflect the composition of the tissue.The objective of this study was to assess Synthetic magnetic resonance imaging (MRI) ability for differentiation between breast adenosis and breast cancer.Our results show that show that Synthetic MRI is a useful tool that can be utilised to discriminate between breast adenosis and breast cancer.
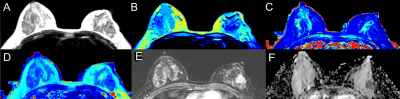
Figure.
1 Synthetic MR, DCE-MRI and DWI images of a 42-year-old woman with Invasive cancer in the left breast. the synthetic
images obtained 11 minutes after contrast agent injection. A T2WI (Synthetic),the position of the ROI is
outlined with a red circle; B T1 map (Synthetic); C T2 map (Synthetic); D
proton density map (Synthetic); E DCE-MRI (2 min
31s after contrast injection); F ADC map (DWI).
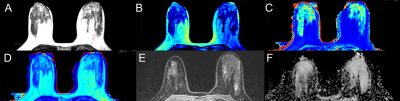
Figure. 2 Synthetic MR,
DCE-MRI and DWI images of
a 39-year-old woman with adenosis in the left breast. the synthetic images
obtained 11 minutes after contrast agent injection. A T2WI (Synthetic), the position of the ROI is outlined with a
red circle; B T1map (Synthetic); C T2map (Synthetic); D
proton density map (Synthetic); E DCE-MRI (2 min
31s after contrast injection); F ADC map (DWI).
-
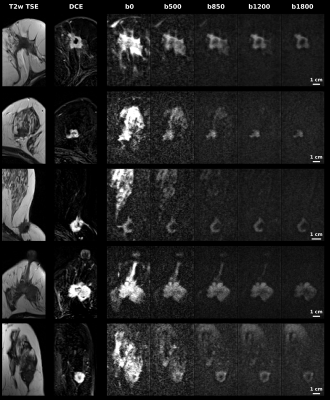
Clinical utility of breast DWI in the assessments of breast lesions using different b values
Mami Iima1,2, Maya Honda1, Rie Ota1, Masako Kataoka1, Masakazu Toi3, and Yuji Nakamoto1
1Diagnostic Imaging and Nuclear Medicine, Kyoto University Graduate School of Medicine, Kyoto, Japan, 2Clinical Innovative Medicine, Institute for Advancement of Clinical and Translational Science, Kyoto University Hospital, Kyoto, Japan, 3Breast Surgery, Kyoto University Graduate School of Medicine, Kyoto, Japan
Diagnostic performance based on b800 and b1500 DW images was not uniform
among 3 readers. Beside b values attention should be given to standardization
on reading protocols and experience from DWI readers.
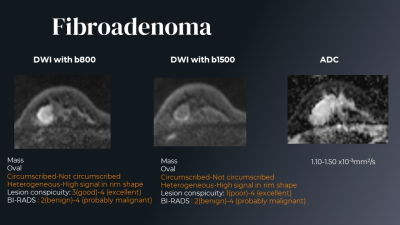
Figure 3. The DW image findings are different among 3 readers. Fibroadenoma.
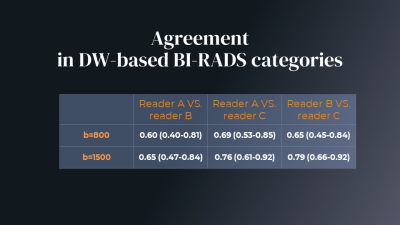
Table 1. Agreement
in DW-based BI-RADS categories. Agreement in DW-based BI-RADS categories tended to be higher in b1500 compared to b800 DW images. Mean and confidence intervals for kappa values are shown.