-
Robust and Generalizable Quality Control of Structural MRI images
Ben A Duffy1, Srivathsa Pasumarthi Venkata1, Long Wang1, Sara Dupont1, Lei Xiang1, Greg Zaharchuk1, and Tao Zhang1
1Subtle Medical Inc., Menlo Park, CA, United States
We
present a deep learning-based quality control system that generalizes to images
from different sites, different orientations and images with and without contrast.
Performance is enhanced using test-time augmentation. Robustness is ensured
using out-of-distribution detection.
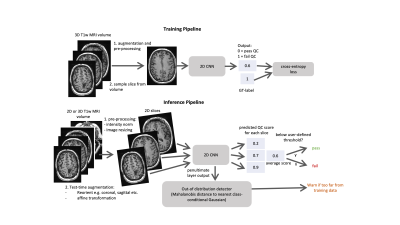
Figure 1: Training and Inference pipelines: 2D CNN predicts the probably of QC failure
for each 2D slice. At inference time, the mean QC score for each slice is used
for the volume-wise prediction. In addition, reorientations and affine
transformations are used as test-time augmentations. Robustness can be ensured
by outputting the penultimate layer from the 2D CNN and comparing it to the
nearest class-conditional Gaussian distribution of the training data.
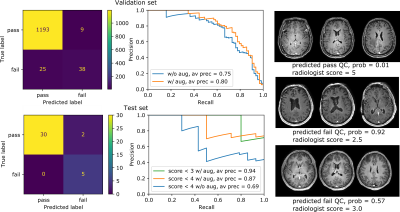
Figure 4: Performance evaluation for both the validation and test sets. From left to right:
confusion matrices, precision recall curves, example test-set images with QC
predictions and average radiologist scores. Performance improvements using
test-time augmentation are shown in the precision recall curves as an increase
in average precision from 0.75 to 0.8 (validation set) and 0.69 to 0.87 (test
set) (abbreviations: w/o aug - without test-time augmentation, w/ aug = with
test-time augmentation).
-
Longitudinal Registration of Knee MRI Based on Femoral and Tibial Alignment
Zhixuan Liang1, Yin Guo2, and Chun Yuan3
1Electrical Engineering, Zhejiang University, Hangzhou, China, 2Bioengineering, University of Washington, Seattle, WA, United States, 3Radiology, University of Washington, Seattle, WA, United States
In this work we developed an automatic and robust algorithm for longitudinal registration of knee MRI across a long time span, which firstly achieves rigid registration based on femoral segmentation, and then makes evaluations with tibial alignment.
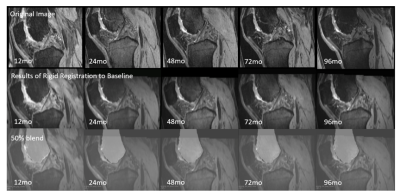
Fig 2. The sagittal view of rigid registration results based on femoral masks at following time points. The original MR images at following time points are shown in first row. The results of rigid registration and the blend of result and mask are shown in second and third rows. The mask shown is the femoral mask of baseline.
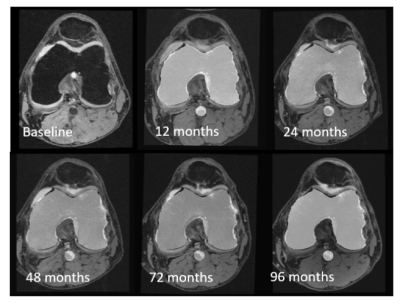
Fig 3. The transverse view of rigid registration results based on femoral masks at following time points. We also draw the popliteal artery mask of baseline on the registration results to confirm that as long as the longitudinal registration is good, there is only a small deviation of the vessel centerline.
-
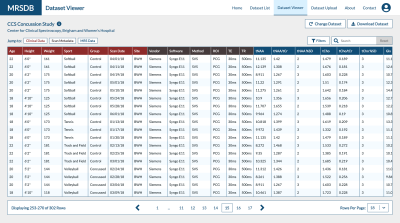
Automated reference tissue normalization of prostate T2-weighted MRI on a large, multicenter dataset
Kaia Ingerdatter Sørland1, Mohammed R. S. Sunoqrot1, Pål Erik Goa2,3, Elise Sandsmark3, Sverre Langørgen3, Helena Bertilsson4,5, Gigin Lin6, Tone F. Bathen1,3, and Mattijs Elschot1,3
1Department of Circulation and Medical Imaging, Norwegian University of Science and Technology, Trondheim, Norway, 2Department of Physics, Norwegian University of Science and Technology, Trondheim, Norway, 3Department of Radiology and Nuclear Medicine, St. Olavs University Hospital, Trondheim, Norway, 4Department of Cancer Research and Molecular Medicine, Norwegian University of Science and Technology, Trondheim, Norway, 5Department of Urology, St. Olavs University Hospital, Trondheim, Norway, 6Department of Medical Imaging and Intervention, Chang Gung Memorial Hospital at Linkou, Institute for Radiological Research, Chang Gung University, Taoyuan, Taiwan
The Autoref reference tissue normalization of T2-weighted (T2W) MR images of the prostate significantly reduced inter-scan variation in a large, multicenter dataset of 989 axial T2W. This may be important for quantitative analysis of prostate cancer of T2W images.
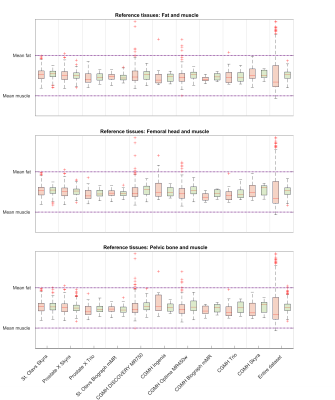
Figure 2: Box plots of the mean prostate intensities before and after normalization for all scanners and the entire test dataset. The red boxes are before normalization, and green are after. The dashed lines correspond to the mean fat and muscle intensity in each cohort, that have been aligned through scaling.
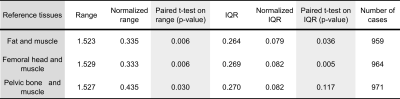
Table 3: The range and IQR in the scaled mean prostate intensities before and after normalization for the entire cohort. The variation in pre-normalization ranges comes from the exclusion of cases where the ROI detectors failed - leading to a slightly different dataset for each method.
-
qVision for the ELGAN-ECHO Study: An MS-qMRI Processing Pipeline Applied to Large-scale, Multi-site, and Multi-vendor Analyses.
Ryan McNaughton1, Hernan Jara1,2, Chris Pieper2, Laurie Douglass2, Rebecca Fry3, Karl Kuban2, and T. Michael O'Shea3
1Boston University, Boston, MA, United States, 2Boston University Medical Center, Boston, MA, United States, 3University of North Carolina at Chapel Hill School of Medicine, Chapel Hill, MA, United States
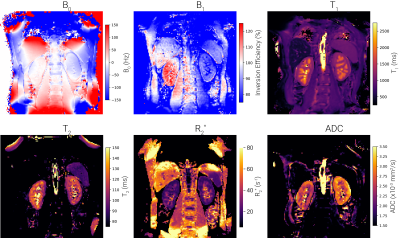
qVision, a semi-automated processing pipeline for MS-qMRI, was developed for the Tri-TSE and validated as part of the large-scale, multi-site, and multi-vendor ELGAN-ECHO study. Harmonized, high-resolution maps of T1, T2, PD, and SE, as well as heavily R1-weighted images were generated.
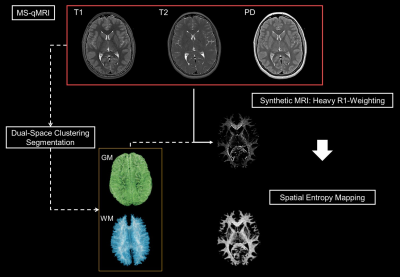
White matter spatial entropy mapping. qVision processing
pipeline for spatial entropy mapping, utilizing principles of MS-qMRI mapping
and Synthetic MRI.
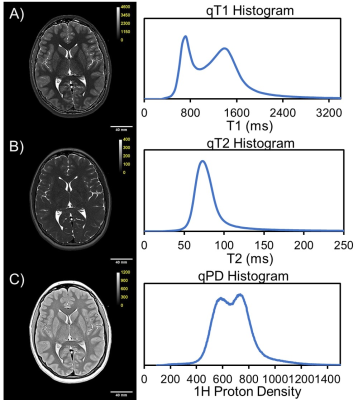
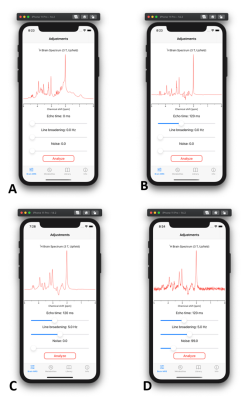
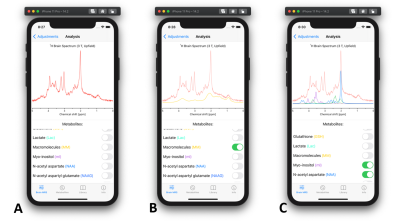
Example
MS-qMRI maps of A) T1, B) T2, and C) PD for a 15-year-old female. The
corresponding T1, T2, and PD histograms are provided.
-
YTTRIUM: QC algorithm for the processed diffusion maps in UK Biobank 18608 sample
Ivan I. Maximov1,2, Dennis van der Meer2, Ann-Marie de Lange2, Tobias Kaufmann2, Alexey Shadrin2, Oleksandr Frei2, Thomas Wolfers2, and Lars T Westlye2
1Western Norway University of Applied Sciences, Bergen, Norway, 2NORMENT, University of Oslo, Oslo, Norway
Quality control algorithm for diffusion scalar metrics in UK Biobank 18608 sample
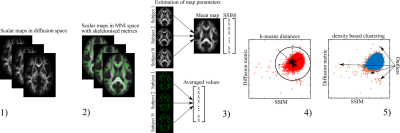
Figure 1 The developed QC
algorithm consists of 5 steps: 1) estimation of diffusion scalar
maps; 2) normalisation of scalar maps to MNI space by TBSS procedure;
3) estimation of SSIM and skeleton-averaged metrics for each subject;
4) application of k-means-derived distances for one cluster centroid;
5) data filtration using the density-based spatial clusterisation
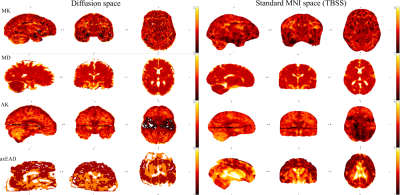
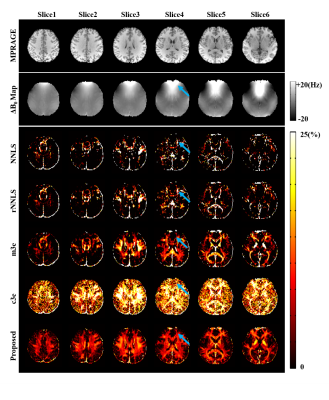
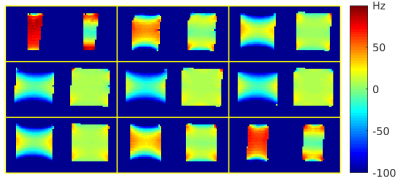
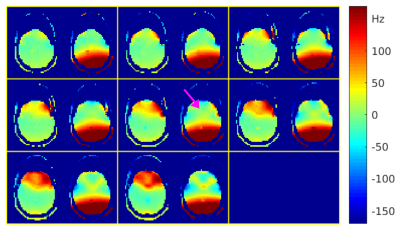
Figure 2 Examples of detected
outliers appeared in the data. Mean kurtosis (MK) map presents
problems with metric estimation. Mean diffusion (MD) map presents an
anatomical specificity of the subject. Axial krtosis (AK) map
presents the problem with a pair of slices misestimated by the
eddy/Matlab script. Axial extraaxonal diffusivity (axEAD) map
presents the problem with a flat contrast along the computations.
-
Semi-Automated 3D Cochlea Subregional Segmentation on T2-Weighted MRI Scans
William J Matloff1, Daniel J Matloff1, Arthur W Toga1, Taeuk Cheon2, Jangwook Gwak2, Yehree Kim2, Hong Ju Park2, and Hosung Kim1
1Laboratory of Neuro Imaging, USC Mark and Mary Stevens Neuroimaging and Informatics Institute, Keck School of Medicine, University of Southern California, Los Angeles, CA, United States, 2Department of Otorhinolaryngology-Head and Neck Surgery, Asan Medical Center, Seoul, Korea, Republic of
We show the accuracy and reliability of a semi-automated approach for segmenting the modiolus, cochlear basal turn, and cochlear mid-apical turn on T2-weighted MRI images.
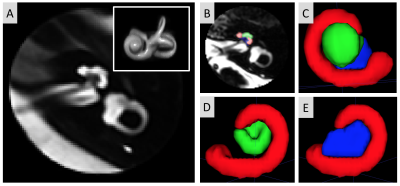
(A) Left cochlea template, with insert showing the 3D rendering of the inner ear specifically. (B) Slice of the spherical cochlea MRI region of one participant with manual segmentation overlaid. (C-E) 3D rendering of the manually segmented cochlea subregions and modiolus (red=cochlear basal turn, green=cochlear mid-apical turn, blue=modiolus) in different views.
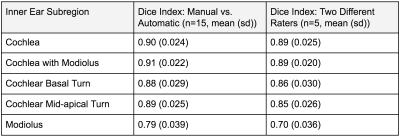
Table showing automatic segmentation agreement and inter-rater segmentation agreement.
-
Neuroimaging Pre-Processing and Quality Control for The European Prevention of Alzheimer’s Dementia (EPAD) Cohort Study
Luigi Lorenzini1, Silvia Ingala1, Alle Meije Wink1, Joost PA Kuijer1, Viktor Wottschel1, Carole Sudre2,3,4,5, Sven Haller6,7, José Luis Molinuevo8,9,10,11, Juan Domingo Gispert8,10,11,12, David M Cash13, David L Thomas14, Sjoerd B Vos14,15, Ferran Prados Carrasco16,17,18, Jan Petr19, Robin Wolz20,21, Alessandro Palombit20, Adam J Schwarz22, Gael Chételat23, Pierre Payoux24,25, Carol Di Perri21, Cyril Pernet26, Frisoni Giovanni27,28, Nick C Fox13, Craig Ritchie29, Joanna Wardlaw26,30, Adam Waldman26,31, Frederik Barkhof1,32, and Henk JMM Mutsaerts1,33
1VUmc Amsterdam, Amsterdam, Netherlands, 2MRC unit for Lifelong Health and Ageing at UCL, London, London, United Kingdom, 3Department of Neurodegenerative Disease, Dementia Research Centre, London, United Kingdom, 4Centre for Medical Image Computing UCL, London, United Kingdom, 5School of Biomedical Engineering & Imaging Sciences, King’s College London, London, United Kingdom, 6CIRD Centre d’Imagerie Rive Droite, Geneva, Switzerland, 7Department of Surgical Sciences, Radiology, Uppsala University, Uppsala, Sweden, 8Barcelonaβeta Brain Research Center (BBRC), Pasqual Maragall Foundation, Barcelona, Spain, 9CIBER Fragilidad y Envejecimiento Saludable (CIBERFES), Madrid, Spain, 10IMIM (Hospital del Mar Medical Research Institute), Barcelona, Spain, 11Universitat Pompeu Fabra, Barcelona, Spain, 12CIBER Bioingeniería, Biomateriales y Nanomedicina (CIBER-BBN), Madrid, Spain, 13Department of Neurodegenerative Disease, Dementia Research Centre, UCL, London, United Kingdom, 14Neuroradiological Academic Unit, UCL Queen Square Institute of Neurology, London, United Kingdom, 15Centre for Medical Image Computing, University College London, London, United Kingdom, 16Nuclear Magnetic Resonance Research Unit, Queen Square Multiple Sclerosis Centre, University College London Institute of Neurology, London, United Kingdom, 17Department of Medical Physics and Biomedical Engineering, Centre for Medical Image Computing, University College London, London, United Kingdom, 18e-Health Centre, Open University of Catalonia, Barcelona, Spain, 19Helmholtz‐Zentrum Dresden‐Rossendorf, Institute of Radiopharmaceutical Cancer Research, Dresden, Germany, 20IXICO, London, United Kingdom, 21Imperial College London, London, United Kingdom, 22Takeda Pharmaceuticals Ltd., Cambridge, MA, United States, 23Université de Normandie, Unicaen, Inserm, U1237, PhIND "Physiopathology and Imaging of Neurological Disorders", institut Blood-and-Brain @ Caen-Normandie, Cyceron, Caen, France, 24Department of Nuclear Medicine, Toulouse CHU, Purpan University Hospital, Toulouse, France, 25Toulouse NeuroImaging Center, University of Toulouse, INSERM, UPS, Toulouse, France, 26Centre for Clinical Brain Sciences, The University of Edinburgh, Edinburgh, Scotland, 27Laboratory Alzheimer’s Neuroimaging & Epidemiology, IRCCS Istituto Centro San Giovanni di Dio Fatebenefratelli, Brescia, Italy, 28University Hospitals and University of Geneva, Geneva, Switzerland, 29Centre for Dementia Prevention, The University of Edinburgh, Edinburgh, Scotland, 30UK Dementia Research Institute at Edinburgh, University of Edinburg, Edinburgh, Scotland, 31Department of Medicine, Imperial College London, London, United Kingdom, 32Institute of Neurology and Healthcare Engineering, University College London, London, United Kingdom, 33Ghent Institute for Functional and Metabolic Imaging (GIfMI), Ghent University, Ghent, Belgium
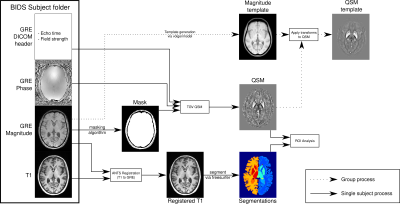
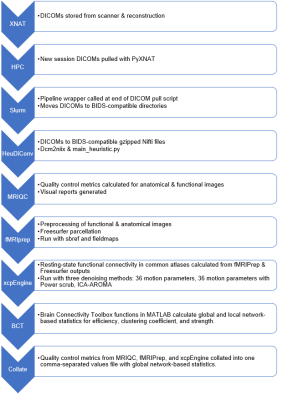
We developed a
semi-automated pipeline for the management of multi-modal MRI data acquired in
mutli-center research studies, including processing, quality control of raw MRI
data and computation of image-derived phenotypes.
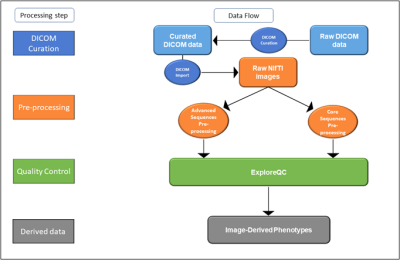
Figure
1. Magnetic Resonance Imaging (MRI) data flow in the EPAD study
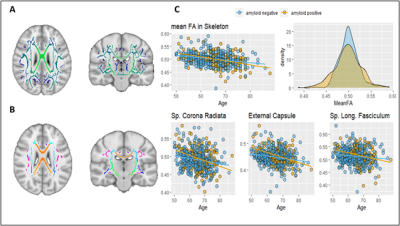
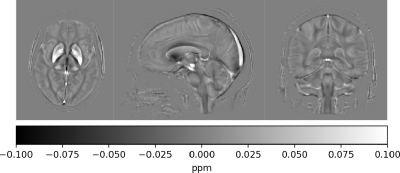
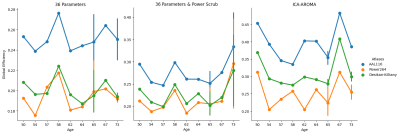
Figure 4. Association of global and local tbss values with age and amyloid
status. A) FA skeleton as computed in the tbss pipeline; B) Skeletonised
white matter atlas used to extract local FA values; C) Association of global
and regional FA values with age and amyloid status. Abbreviations: FA=Fractional Anisotropy; tbss = tract-based spatial statistics
-
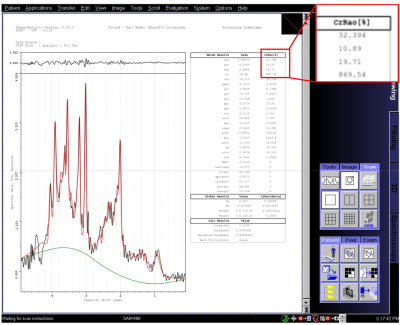
Algorithm for Automated Identification of Spectral Characteristics
Venkata Veerendranadh Chebrolu1, Michael Wullenweber2, Andreas Schaefer2, Johann Sukkau2, and Peter Kollasch1
1Siemens Medical Solutions USA, Inc., Rochester, MN, United States, 2Siemens Healthcare GmbH, Erlangen, Germany
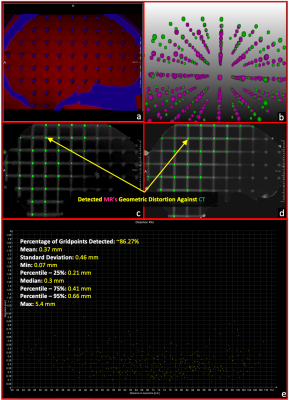
In this work, we present an algorithm for
automated identification of fat and water proton spectral characteristics and
evaluate its performance in 30 proton spectra from breast (number of subjects: n=20), ankle (n=11), and knee (n=9)
anatomical regions.

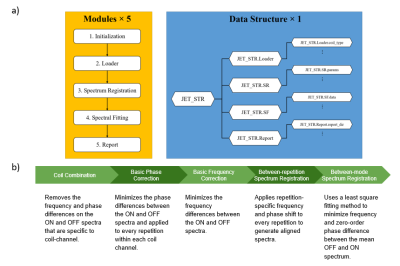
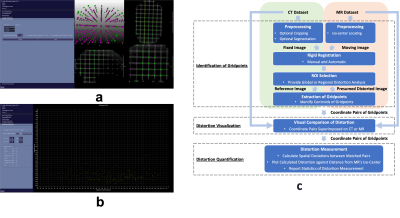
Figure 1: Flowchart of the proposed algorithm for
automated identification of spectral characteristics.
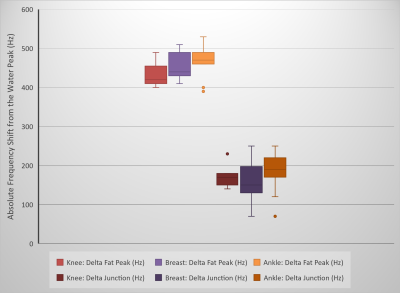
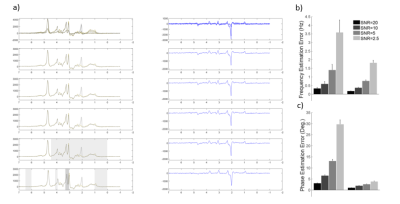
Figure 3: Box-and-whisker
plots of the frequency difference between water and (main) fat peak (Delta Fat Peak) for the complete imaging
volume proton spectra from the knee (number of subjects: n=9), breast (n=20),
and ankle (n=11) regions. Box-and-whisker
plots of the frequency difference between the water peak and the “junction”
frequency (Delta Junction) are also shown. The results show the impact of field
homogeneity on the spectra in different anatomical regions.
-
Assessment of Uncertainty in Brain MRI Deformable Registration
Samah Khawaled1 and Moti Freiman2
1Applied Mathematics, Technion, Haifa, Israel, 2Biomedical Engineering, Technion, Haifa, Israel
Bayesian deep learning models enable safer utilization in MRI, improve generalization and assess the uncertainty of the predictions. We propose a non-parametric Bayesian method to estimate the uncertainty in MRI registration and assess its correlation with the out-of-distribution data.
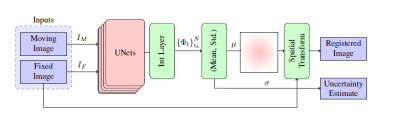
Fig. 1: Block diagram of
the proposed Bayesian registration system. μ and σ are the mean and standard deviation of the deformation.
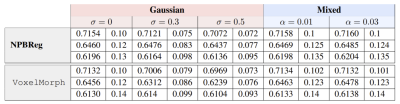
Table 1: Registration evaluation results. The added noise
levels are denoted by σ and α, respectively. The mean and std, calculated over
the test set, are presented for three different anatomical structures (from top
to bottom: R inferior frontal gyrus, L precentral gyrus, L lateral
orbitofrontal gyrus).
-
Temporal Frame Alignment for Speech Atlas Construction Using High Speed Dynamic MRI
Fangxu Xing1, Riwei Jin2, Imani Gilbert3, Xiaofeng Liu1, Georges El Fakhri1, Jamie Perry3, Bradley Sutton2, and Jonghye Woo1
1Department of Radiology, Massachusetts General Hospital, Boston, MA, United States, 2Department of Bioengineering, University of Illinois at Urbana-Champaign, Champaign, IL, United States, 3Department of Communication Sciences and Disorders, East Carolina University, Greenville, NC, United States
Temporal alignment on a total number of 93 image volumes
showed an increased normalized cross-correlation score on average, indicating
improved similarity between the reference target sequence and source subject
sequences after processed by the proposed pipeline.
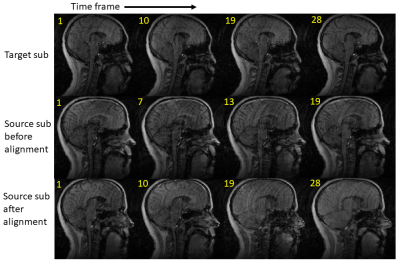
Figure 2. Mid-sagittal
slices at four selected time frames from the reference subject and one test
subject (before and after time alignment) during the pronunciation of “hamper”.
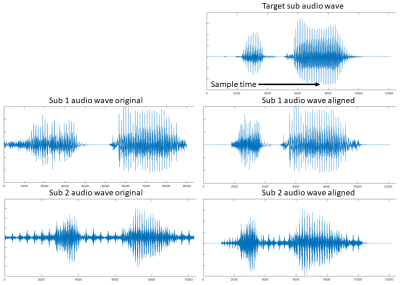
Figure 1. Wave
form matching of two test subjects to the target reference subject.
-
Reproducibility of White Matter Parcellation on Multi-Acquisition Diffusion Weighted Imaging
Stefan Winzeck1,2, Ben Glocker1, Virginia F. J. Newcombe2, David K. Menon2, and Marta M. Correia3
1BioMedIA, Department of Computing, Imperial College London, London, United Kingdom, 2Division of Anaesthesia, Department of Medicine, University of Cambridge, Cambridge, United Kingdom, 3MRC Cognition and Brain Sciences Unit, University of Cambridge, Cambridge, United Kingdom
Fibre tract segmentation with TractSeg is more precise but less robust than an atlas-based registration approach. FA and MD showed higher variation when data with different acquisition schemes were combined compared to single-scheme data.
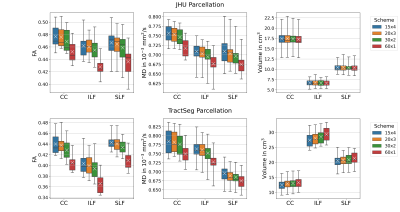
Figure 1. Variation in WM Parcellations. JHU: Forceps minor (CC, ROI #9), left inferior longitudinal fascicle (ILF, ROI #12) and superior longitudinal fascicle (SLF, ROI #14); TractSeg: Rostrum (CC, ROI#5), left inferior longitudinal fascicle (ILF, ROI #26) and superior longitudinal fascicle III (SLF, ROI #39). FA and MD were lowest for single-shell acquisition (60x1). Volumes were consistent for JHU, but varied for TractSeg. Note: Atlases do not exactly segment the same volumes.
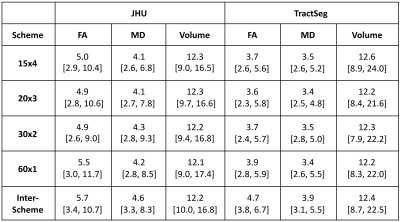
Table 1. Coefficient of Variation of ROI Means Within and Across Acquisition Schemes. All CV values displayed as mean [min, max] in %.
-
Performance evaluation of a Compressed Sensing SWI technique on a clinical 7T MRI system
Emily Koons1, Eric G Stinson2, Patrick Liebig3, Peter Speier3, Krystal Kirby1, Kirk M Welker1, and Andrew J Fagan1
1Radiology, Mayo Clinic, Rochester, MN, United States, 2Siemens Medical Solutions USA, Inc., Rochester, MN, United States, 3Siemens Healthcare GmbH, Erlangen, Germany
A
compressed sensing technique adapted for acquiring 3D-SWI data at 7T revealed
enhanced CNR and vein detectability with 48% scan time reduction relative to a
clinical protocol, although some residual image artifacts persisted despite
regularization parameter optimization.
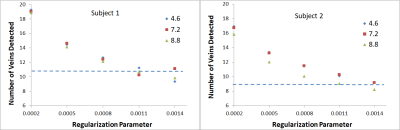
Plot of the number of veins counted as a
function of the regularization parameter for both subjects. Data for the clinical protocol (horizontal
blue dotted line) is compared to that obtained for three CS accelerations
factors (4.6, 7.2 and 8.8).
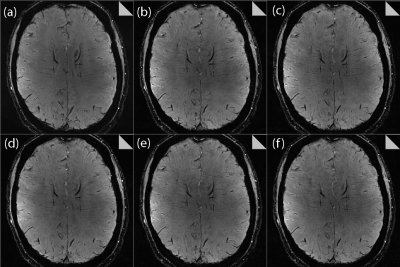
Effect of increasing CS acceleration factor on
the image quality, comparing: (a) clinical protocol, (b) 4.6, (c) 5.5, (d) 6.3,
(e) 7.2 and (f) 8.8. SSI values,
comparing to the clinical protocol in (a), were 0.45, 0.46, 0.46, 0.47, 0.46,
respectively. Some
residual aliasing is evident in the CS-reconstructed images, but nevertheless good
overall anatomical visibility is maintained up to an acceleration factor of
7.2.
-
Openly available sMall vEsseL sEgmenTaTion pipelinE (OMELETTE)
Hendrik Mattern1
1Biomedical Magnetic Resonance, Otto-von-Guericke-University Magdeburg, Magdeburg, Germany
An easy-to-use and Openly available sMall vEsseL sEgmenTa-Tion pipelinE (OMELETTE) was developed.
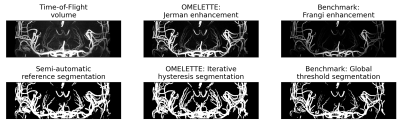
Figure 4: Comparison of coronal maximum intensity projection over the basal ganglia of the original ToF volume, vesselness-filtering and segmentation output for the proposed OMELETTE and benchmark pipeline. Additionally, the semi-automatically segmented reference is shown. OMELETTE enables better segmentation of the lenticulostriate arteries than the benchmark and reference segmentation. Note that all images were normalized.
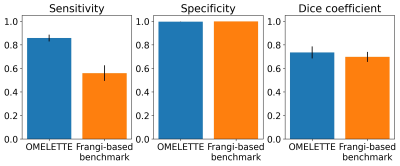
Figure 2: Sensitivity, specificity, and Dice coefficient of OMELETTE and benchmark pipeline for 20 high resolution, publicly available ToF angiographies acquired at 7T. A semi-automatic segmentation (with ilastik) was used as a reference.
-
A Multicomponent Image Registration Technique for Largely Deformed Ventricles in Mouse Brain After Stroke
Warda T. Syeda1, Vanessa Brait2, Alex Oman2, Charlotte Ermine 2, Jess Nithianantharajah 2, Lachlan Thompson2, Leigh A. Johnston3,4, David K. Wright5, and Amy Brodtmann2
1Melbourne Neuropsychiatry Centre, The University of Melbourne, Parkville, Australia, 2The Florey Institute of Neuroscience and Mental Health, The University of Melbourne, Parkville, Australia, 3Department of Biomedical Engineering, The University of Melbourne, Melbourne, Australia, 4Melbourne Brain Centre Imaging Unit, The University of Melbourne, Parkville, Australia, 5Department of Neuroscience, Central Clinical School, Monash University, Melbourne, Australia
- A multicomponent registration technique to perform non-linear registration in the presence of largely deformed ventricles in the mouse brain.
- The proposed method outperforms the single-component registration process in registering stroke data to a healthy mouse brain template.
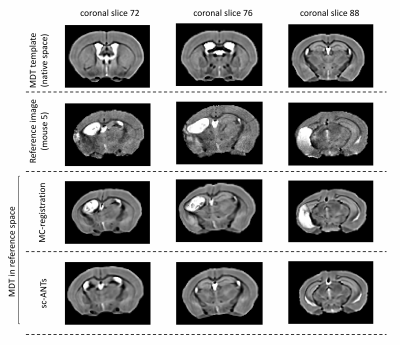
Figure 2: Exemplar coronal slices in a single mouse. Top row: MDT template (healthy template) in native space. Second row: Reference image. MDT transformed to reference image using multicomponent-ANTs (third row) and single component ANTs (last row) techniques. Multicomponent ANTs matched neuro-anatomical landmarks between MDT and individual mouse brain more robustly, with a slight overestimation of ipsilesional hippocampal boundaries.
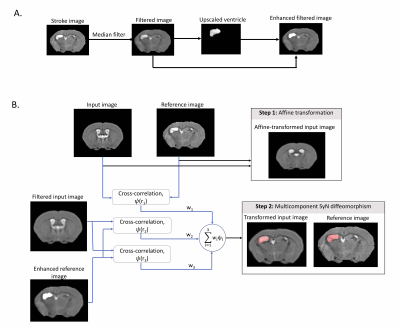
Figure 1: A) Ipsilesional ventricle contrast enhancement. A median filter is applied to stroke images. Ipsilesional ventricle intensities are upscaled 2.5x to reconstruct an enhanced image. B) MC-registration framework. Input (MDT) and reference images are affinely registered. Images are non-linearly registered using a weighted 3-component SyN transformation. Component1: cross-correlation (CC) metric (radius:r1), between MDT and reference images. Components2-3: CC metrics with radii r2 and r3, between median-filtered MDT and ventricle enhanced reference image.
-
Synthetic MRI-assisted Multi-Wavelet Segmentation Framework for Organs-at-Risk Delineation on CT for Radiotherapy Planning
Reza Kalantar1, Susan Lalondrelle2, Jessica M Winfield1,3, Christina Messiou1,3, Dow-Mu Koh1,3, and Matthew D Blackledge1
1Division of Radiotherapy and Imaging, The Institute of Cancer Research, London, United Kingdom, 2Gynaecological Unit, The Royal Marsden Hospital, London, United Kingdom, 3Department of Radiology, The Royal Marsden Hospital, London, United Kingdom
This study introduced a novel framework to segment OARs on CT by dual-channel synthetic MRI/CT training of a multi-wavelet UNet. The results showed improved soft-tissue segmentations against a conventional UNet model.
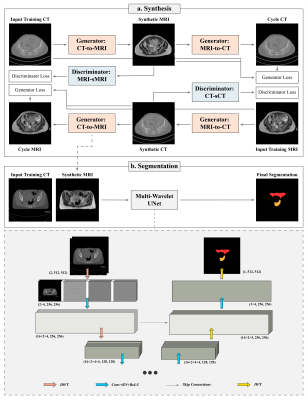
Figure 1: The proposed framework consisting of synthesis and segmentation components. (a) Synthesis: The input images in cohort A are translated to synthetic images and reconstructed back to the input domain for adversarial training. (b) Segmentation: the sMRI is generated from the input CT in cohort B to provide dual-channel input for MWUNet training. In MWUNet, DWT leads to four-fold increase in the receptive field whilst reducing the dimensionality, and IWT allows loss-less feature map reconstruction.
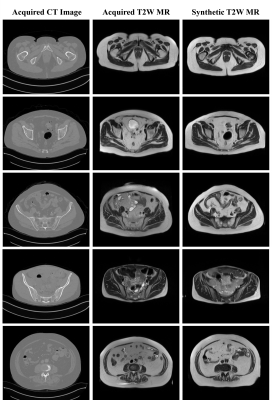
Figure 2: The synthetic T2W MRI generated from the test patients in cohort A through unpaired Cycle-GAN training. Whilst the texture and contrast were realistically predicted for structures with fixed geometries, soft-tissues with large variabilities in training images were challenging to reproduce in test sMRI. White arrow: rectum and bowel. Cyan arrow: muscle lining (fascia). Yellow arrow: examples of contrast disparity in femur and sacrum.
-
Automated scan plane planning for multiple examination parts by modular algorithm developing method
Suguru Yokosawa1, Toru Shirai1, Hisako Nagao1, and Hisaaki Ochi1
1Healthcare Business Unit, Hitachi, Ltd, Tokyo, Japan
We have
proposed a modular algorithm developing method for automatic scan plane planning and developed the
algorithms for different examination parts (shoulder and knee) by changing the combination of common
processes.
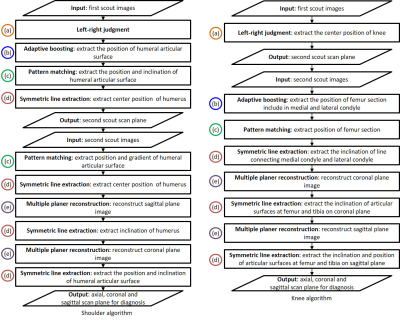
Figure 1 Flow chart of the proposed algorithms
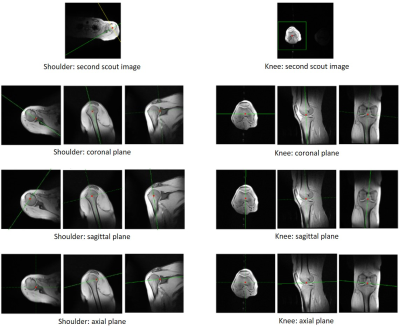
Figure 2 Automated scan planes by using propose method
-
Brain Tumor Characterization and Assessment using Automatic Detection of Extracellular pH Change
Yuki Matsumoto1, Masafumi Harada1, Yuki Kanazawa1, Nagomi Fukuda2, Syun Kitano2, Yo Taniguchi3, Masaharu Ono3, and Yoshitaka Bito3
1Graduate School of Biomedical Sciences, Tokushima University, Tokushima-city, Japan, 2School of Health Sciences, Tokushima University, Tokushima-city, Japan, 3Healthcare Business Unit, Hitachi, Ltd., Tokyo, Japan
1. The pHe map can identify tumor malignancy from QPM.
2. In addition, deep learning can lead to automated segmentation of contrast-enhanced areas and automatic identification of the tumor characterization.
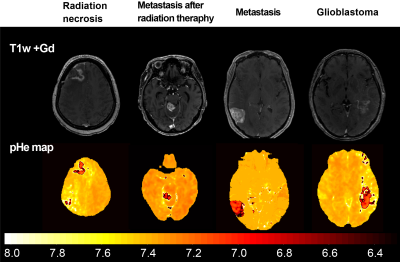
Fig3. Synthetic T1w post contrast derived from QPM and the pHe maps
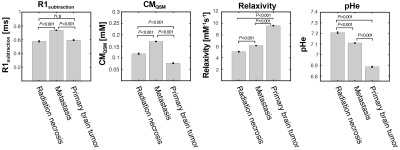
Fig2. Mean values of R1subtraction, CM, relaxivity, and pHe
-
Adding an absolute chest position regressor to RETROICOR for spinal cord fMRI during atypical breathing patterns
Neha A Reddy1,2, Andrew D Vigotsky1,3, Rachael C Stickland2, and Molly G Bright1,2
1Department of Biomedical Engineering, Northwestern University, Evanston, IL, United States, 2Department of Physical Therapy and Human Movement Sciences, Feinberg School of Medicine, Northwestern University, Chicago, IL, United States, 3Department of Statistics, Northwestern University, Evanston, IL, United States
Adding an absolute chest position regressor to RETROICOR for physiological noise correction may explain additional variance in spinal cord fMRI data during breath-hold tasks.
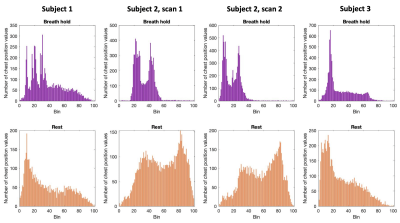
Figure 1. Respiratory cycle histogram created from respiration belt trace of chest position, plotted for each scan. Histograms created from chest position data during breath-hold task scans (top row) and resting-state scans (bottom row). In breath-hold scans, extra peaks at lower bins are due to prolonged low chest position during end-expiratory breath holds. Long tails at higher bins are due to large inhalations during recovery breaths post-breath hold.
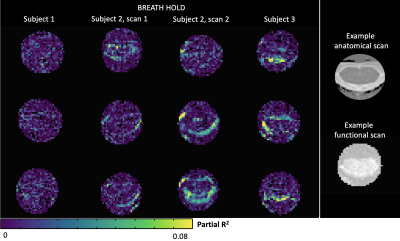
Figure 2. Maps of partial R2 values from adding a chest position regressor compared to RETROICOR alone during breath-hold scans. Three cervical spinal cord transverse slices are shown at approximately the same levels for each subject. Example anatomical and functional scans of the spinal cord are shown in the rightmost column for context.
-
Automatic 3D PC-MRI atlas-based segmentation of the aorta
Diana M. Marin-Castrillon1, Arnaud Boucher1, Siyu Lin1, Chloe Bernard2, Marie-Catherine Morgant1,2, Alexandre Cochet1,3, Alain Lalande 1,3, Benoit Presles 1, and Olivier Bouchot 1,2
1ImViA Laboratory, University of Burgundy, Dijon, France, 2Department of Cardio-Vascular and Thoracic Surgery, University Hospital of Dijon, Dijon, France, 3Department of Medical Imaging, University Hospital of Dijon, Dijon, France
In this work, we propose an automatic 3D PC-MRI segmentation of the
aorta in systole using a multi-atlas approach. The evaluation done on 16
patients provide accurate automatic segmentations compared to the manual ones.
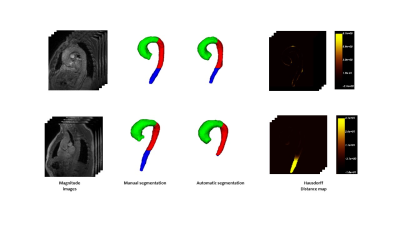
Figure 2. Cases with the highest
(top) and the lowest
(bottom) performance. Hausdorff
map is represented as a heat map in which the regions with intense yellows
represent high errors and dark or black represent errors close to or equal to
zero.
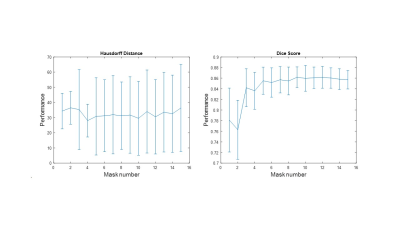
Figure
1. Average performance of the method during the
atlas selection process with respect to the normalized
correlation coefficient
metric. The similarities obtained between the target image and the warped
images are ordered from the highest to the lowest, to perform the majority
voting process with the best mask and add one by one the next best ones until
all the images in the atlas are used.
-
A flexible open-source Python package for de-identification of medical images and related data
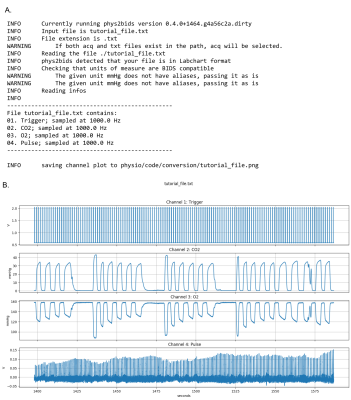
Nicolas Pannetier1, Kaleb Fischer1, Justin Elhert1, Ambrus Simon1, Gunnar Schaefer1, and Michael Perry1
1Flywheel Exchange, Inc, Minneapolis, MN, United States
An open-source Python package for de-identification using a unified YAML de-identification profile.
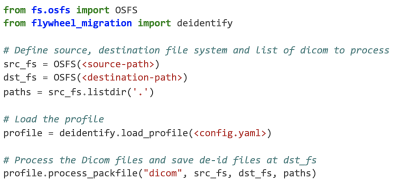
Figure 1. Code example for de-identifying DICOM files.
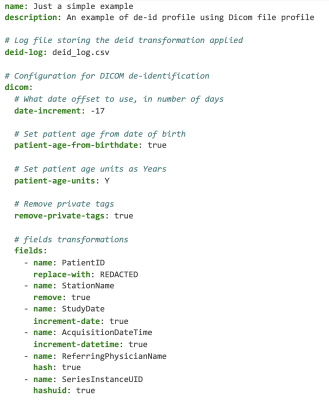
Figure 2. Example of a YAML de-identification profile.