-
Highly accelerated fMRI of awake behaving non-human primates via model-based dynamic off-resonance correction
Mo Shahdloo1, Daniel Papp2, Urs Schüffelgen1, Karla L. Miller2, Matthew Rushworth1, and Mark Chiew2
1Wellcome Centre for Integrative Neuroimaging, Department of Experimental Psychology, University of Oxford, Oxford, United Kingdom, 2Wellcome Centre for Integrative Neuroimaging, FMRIB, Nuffield Department of Clinical Neurosciences, University of Oxford, Oxford, United Kingdom
B0 field fluctuations cause significant unaliasing artefacts when imaging awake behaving non-human primates. We proposed a method to estimate these fluctuations, effectively reducing the artefacts, without the need for extra scans or sequence modification.
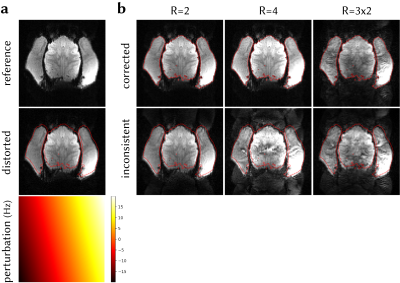
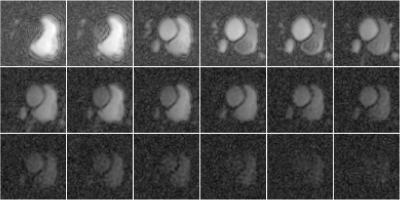
Figure 4. (a) Distortion due to a simulated linear field perturbation was applied on the fully-sampled reference frame from in vivo data. (b) In-plane accelerated data were synthesised by retrospectively undersampling at R=2, 4. Multiband data were synthesised by adding the data across two slices (R=3x2). Field perturbation leads to calibration inconsistency, manifested as strong unaliasing artefacts. The perturbation was estimated and the data were corrected, yielding a reconstructions that have significant reduced unaliasing artefacts and corrected geometric distortion.
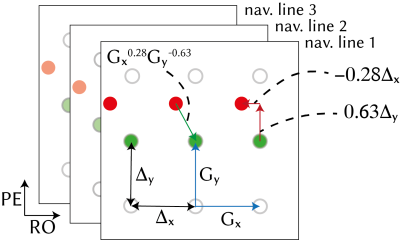
Figure 1. Linear magnetic field perturbation is cast as a linear shift of the k-space data for each navigator line at the reference frame (green dots), yielding shifted navigator lines (red dots). Separate GRAPPA operators (Gx, Gy) trained on calibration data to map each k-space point to their adjacent point across the orthogonal Cartesian grid can shift points on the grid (blue arrows). Partial shifts (red arrows) can be cast as fractional powers of the operators. Field perturbations were estimated by finding the shifts between navigators at each frame and those at the reference frame.
-
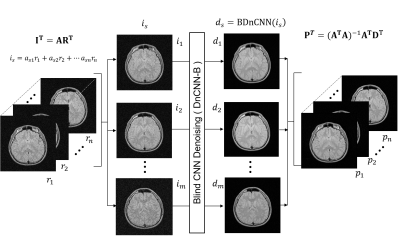
Efficient DCE-MR Image reconstruction with feasible temporal resolution in L+S Decomposition model
Faisal Najeeb1, Jichang Zhang2, Xinpei Wang2, Chengbo Wang2, Hammad Omer1, Penny Gowland3, Sue Francis3, and Paul Glover3
1MIPRG,Comsats University, Islamabad, Pakistan, 2SPMIC, The University of Nottingham Ningbo China, Ningbo, China, 3SPMIC, The University of Nottingham, Nottingham, United Kingdom
We
have developed a new reconstruction framework which provides higher time
efficiency and better image quality for DCE-MRI. Improved temporal resolution
and dynamic contrast was also achieved simultaneously by proposed method.
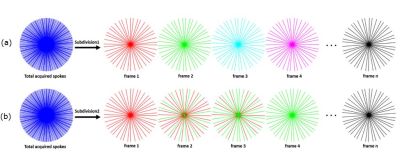
Figure 1: Data
Sorting/Temporal subdivision methods for golden angle radial sampled pattern:
(a) GRASP based method subdivides the acquired spokes into multiple frames
according to the temporal order while there are no repeated spokes among
frames; (b) proposed method subdivides the acquired spokes with a temporal
windowing function. In the example above, frames 4 in the proposed method
contains the similar pattern as frame 2 in general method while the number of
frames has been increased 2 times.
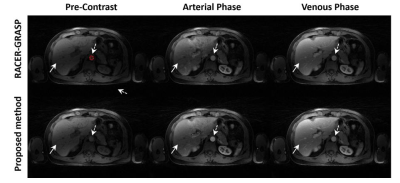
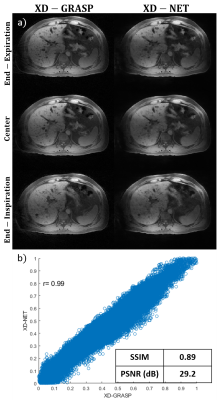
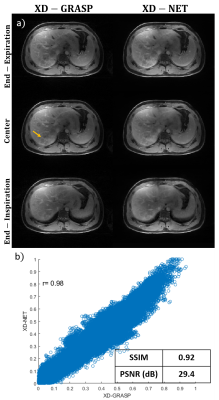
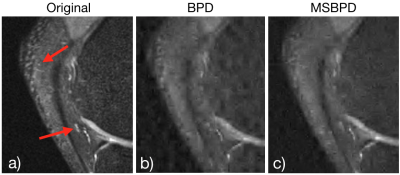
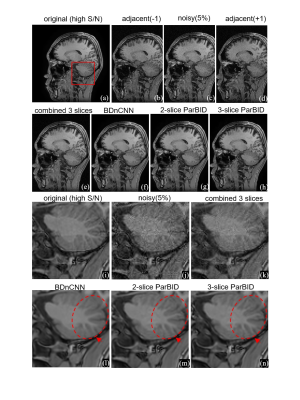
Figure
3: Three contrast phases of DCE-MRI liver images reconstructed by Racer-GRASP
and the Proposed Method. Our method provides better reconstruction
quality about tissue details (straight-line arrows) with less artefacts.
Meanwhile, L+S decomposition is able to present the dynamic MRI naturally while
better dynamic contrast was observed in the proposed method. The dynamic
contrast in arterial region is better than RACER-GRASP (dashed-line arrows). The
signal intensity of the arterial region signed by red circle was selected as
the standard for evaluating dynamic contrast.
-
Accelerated Chemical Exchange Saturation Transfer Acquisition by Joint K-space and Image-space Parallel Imaging (KIPI)
Zu Tao1, Sun Yi2, Wu Dan1, and Zhang Yi1
1Key Laboratory for Biomedical Engineering of Ministry of Education, Department of Biomedical Engineering, College of Biomedical Engineering & Instrument Science, Zhejiang University, Hangzhou, China, 2MR Collaboration, Siemens Healthcare Ltd., Shanghai, China
An auto-calibrated reconstruction method by joint
k-space and image-space parallel imaging (KIPI) is proposed for faster CEST
acquisition. KIPI allows an acceleration factor of up to 8-fold for acquiring
source images and produces image quality close to that of the ground truth.
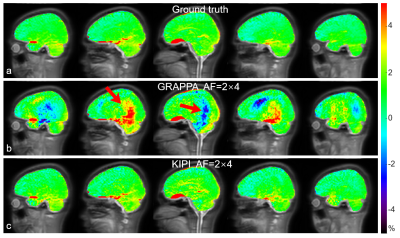
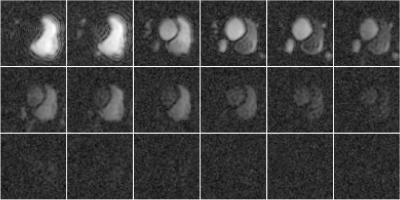
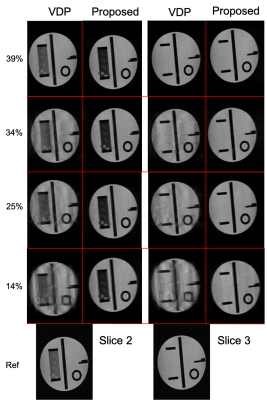
Figure 4. APTw images of a healthy volunteer
calculated from the source images in Figure 3. a: The APTw images using data acquired with AF=2×2 and ACS data for
all frames were treated as ground truth. b-c:
APTw images reconstructed from GRAPPA (b)
and KIPI (c) using
variably-accelerated data, i.e. AF=2×2
for the +3.5-ppm frame with ACS data and AF=2×4 for the other frames without ACS data. Red arrows indicate severe
artifacts in GRAPPA APTw images (b).
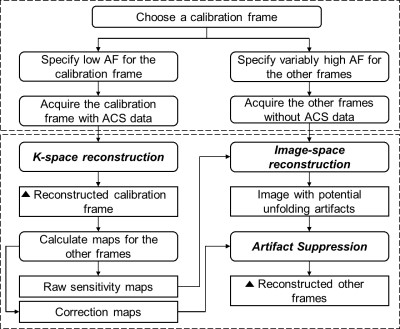
Figure 2. Flowchart for implementing
the KIPI method with variably-sampled frames. A solid rectangle represents
an operation, and a solid rounded rectangle means the input or output data to an
operation. The black triangles highlight the steps of reconstruction results. The
dashed contour above explains the sampling strategy, and the one below shows the
reconstruction pipeline. The k-space reconstruction can use GRAPPA, and the
image-space reconstruction can use SENSE. AF stands for acceleration factor,
and ACS refers to auto-calibration signal.
-
MEDI-d: Downsampled Morphological Priors for Shadow Reduction in Quantitative Susceptibility Mapping
Alexandra Grace Roberts1,2, Pascal Spincemaille2, Thanh Nguyen2, and Yi Wang2,3
1Electrical and Computer Engineering, Cornell University, Ithaca, NY, United States, 2Radiology, Weill Cornell, New York, NY, United States, 3Biomedical Engineering, Cornell University, Ithaca, NY, United States
Morphology Enabled Dipole Inversion
(MEDI-d) is an iterative reconstruction algorithm for Quantitative Susceptibility
Mapping (QSM) that is effective in suppressing shadow artifacts by exploiting
the downsampled magnitude image as a morphological prior.
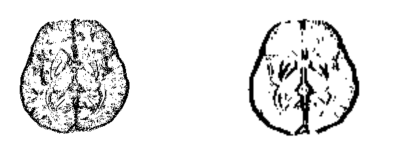
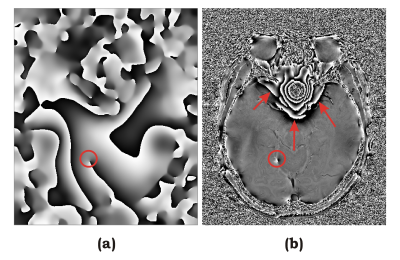
Figure 1. Original structural weighting matrix
(left) and downsampled structural weighting matrix (right) in the $$$x$$$-direction. Note
that the white regions (equal to 1) enforce edge requirements on the
susceptibility solution while the black regions (equal to 0) do not.
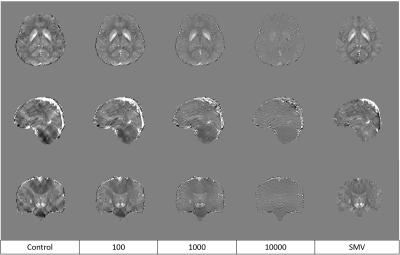
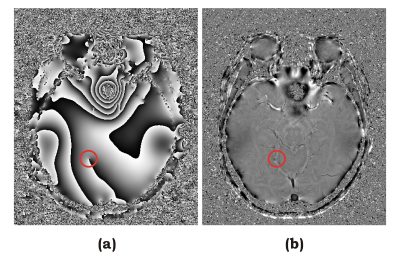
Figure 2. Central slice of control MEDI, MEDI-d with a downsampling factor of 2 and 3 different
regularization parameters, and MEDI-SMV. Note the reduction of shadowing causes
loss of detail that occurs beyond $$$\lambda_2$$$ = 1000.
-
Enhancing diffusion tensor distribution imaging via denoising of tensor-valued diffusion MRI data
Jan Martin1, Patrik Brynolfsson2,3, Michael Uder4, Frederik Bernd Laun4, Daniel Topgaard1, and Alexis Reymbaut2
1Physical Chemistry, Lund University, Lund, Sweden, 2Random Walk Imaging AB, Lund, Sweden, 3NONPI Medical AB, Umeå, Sweden, 4Institute of Radiology, University Hospital Erlangen, Friedrich-Alexander-Universität Erlangen-Nürnberg (FAU), Erlangen, Germany
Diffusion tensor distribution imaging (DTD) is a versatile inversion technique for tensor-valued diffusion data that suffers from a high noise-sensitivity (significant estimation biases). We show in silico that denoising of the data prior to analysis drastically improves DTD's accuracy.
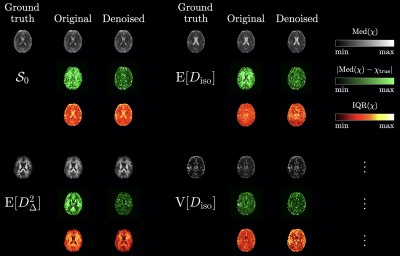
Fig.4: Typical axial maps of the ground-truth statistical descriptors of interest, $$$\chi=\mathcal{S}_0,\mathrm{E}[D_\mathrm{iso}],\mathrm{E}[D_\Delta^2],\mathrm{V}[D_\mathrm{iso}]$$$, along with the corresponding median (greyscale), bias (black-to-green) and uncertainty (black-to-red-to-yellow) parameter maps estimated across noise realizations in the original and denoised datasets. For a given statistical descriptors, all maps of a given colormap type share identically bounded color bar limits, for comparison.
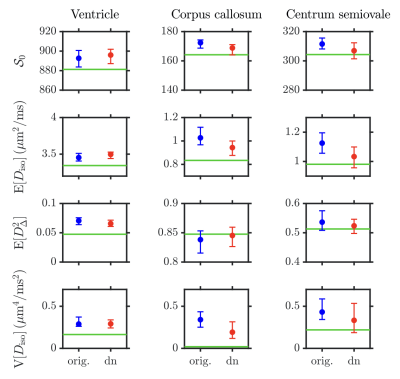
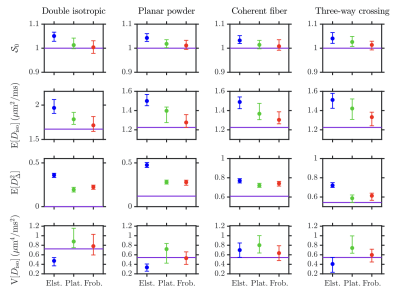
Fig.3: Histograms showing the median and interquartile range of the following DTD statistical descriptors estimated in the voxels of interest of Fig.2 in the "original" and "denoised" (dn) datasets: $$$\mathcal{S}_0$$$, mean diffusivity $$$\mathrm{E}[D_\mathrm{iso}]$$$, squared normalized anisotropy $$$\mathrm{E}[D_\Delta^2]$$$, and the variance of isotropic diffusivities $$$\mathrm{V}[D_\mathrm{iso}]$$$. While $$$D_\mathrm{iso}$$$ denotes the isotropic diffusivity, $$$D_\Delta$$$ is the normalized anisotropy.26 Green lines: ground-truth values.
-
Simultaneous Myelin Water, Magnetic Susceptibility, and Morphometry Analyses Using Magnetization-prepared Multiple Spoiled Gradient Echo
Hirohito Kan1,2, Yuto Uchida3, Yoshino Ueki4, Satoshi Tsubokura5, Hiroshi Kunitomo5, Harumasa Kasai5, Noriyuki Matsukawa3, and Yuta Shibamoto2
1Department of Integrated Health Sciences, Nagoya University Graduate School of Medicine, Nagoya, Japan, 2Department of Radiology, Nagoya City University Graduate School of Medical Sciences, Nagoya, Japan, 3Department of Neurology, Nagoya City University Graduate School of Medical Sciences, Nagoya, Japan, 4Department of Rehabilitation Medicine, Nagoya City University Graduate School of Medical Sciences, Nagoya, Japan, 5Department of Radiology, Nagoya City University Hospital, Nagoya, Japan
1. MP-mSPGR
sequence is feasible for simultaneous voxel-based MWF, magnetic susceptibility,
and morphometry on a single scan.
2. By
using MP-mSPGR sequence, it is possible to accurately estimate the effect of
iron deposition against MWF.
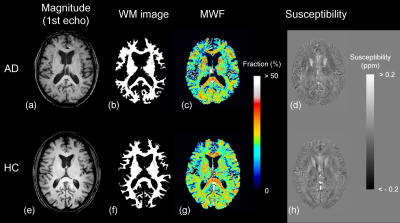
Figure 2 Representative images of (a, e) magnitude image of the first echo in
magnetization-prepared multiple spoiled gradient echo sequence, (b, f) white
matter image, (c, g) myelin water fraction map, and (d, h) susceptibility map
in patients with Alzheimer’s disease and healthy control groups.
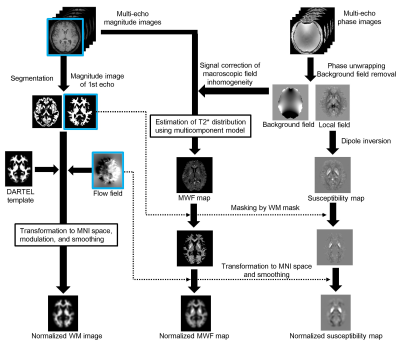
Figure 1 Schematic flowchart of preprocessing for simultaneous voxel-based myelin
water, magnetic susceptibility, and morphometry analysis. The magnitude image
of the first echo in MP-mSPGR, which has strong T1 contrast, is segmented and
normalized for voxel-based morphometry (VBM). Myelin water fraction map is
estimated from the magnitude image corrected macroscopic field inhomogeneity. The
susceptibility map is estimated from multiple phase images. The MWF and
susceptibility maps were spatially normalized using the same transformation
parameter for VBM.
-
The impact of undersampling on the accuracy of the T2 maps reconstructed using CAMP
Nahla M H Elsaid1, Nadine L Dispenza2, R Todd Constable1,3, Hemant D Tagare1,2, and Gigi Galiana1
1Radiology and Biomedical Imaging, Yale School of Medicine, New Haven, CT, United States, 2Department of Biomedical Engineering, Yale University, New Haven, CT, United States, 3Neurosurgery, Yale University, New Haven, CT, United States
Constrained alternating minimization
for parameter mapping (CAMP) improves the image quality in highly accelerated
parameter mapping by incorporating a linear constraint that relates consecutive
images.
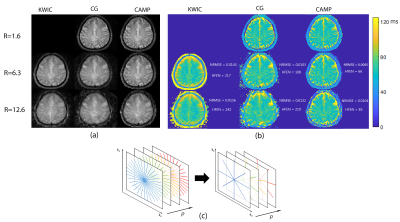
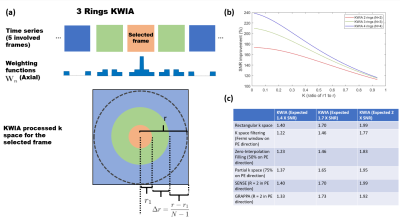
Figure 1. (a) Radial turbo-spin echo T2w
in-vivo brain image quality improvements with CAMP (rightmost column) compared
to CG (middle column) and KWIC (leftmost column) reconstructions shown at an
example echo time of 75 ms with undersampling factors 6.3, and 12.6 (rows 2 and
3) respectively. Panel (b) shows T2-maps generated from KWIC, CG, and CAMP. NRMSE and HFEN 5
values are shown for the undersampled maps. Panel (c) shows an example of the
undersampling pattern used in (a) and (b).
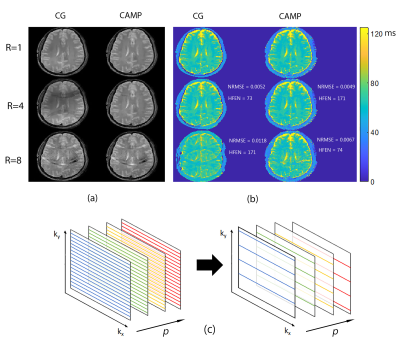
Figure2. (a) Cartesian spin-echo brain
data shows image quality improvements when T2w-images are
reconstructed with CAMP (right column) compared to regularized CG (left column)
at undersampling factors 4 and 8 (middle and bottom rows). (b) Exponential fits of undersampled images
propagate the undersampling artifacts of the image series, but these are
reduced in T2-maps generated by CAMP reconstruction as evidenced by the halving
of NRMSE at R=8. Panel (c) shows an example of the undersampling pattern used
in (a) and (b).
-
Extracting information from diffusion MRI models to visualize the adequacy of acquisition protocols
Samuel St-Jean1,2, Filip Szczepankiewicz2, Christian Beaulieu1, and Markus Nilsson2
1University of Alberta, Edmonton, AB, Canada, 2Clinical Sciences Lund, Lund University, Lund, Sweden
A method is presented to efficiently compute and visualize how well a given diffusion MRI model is represented by a given acquisition scheme. Results with tensor-valued diffusion encoding literally show the dimensions accessible by a given protocol.
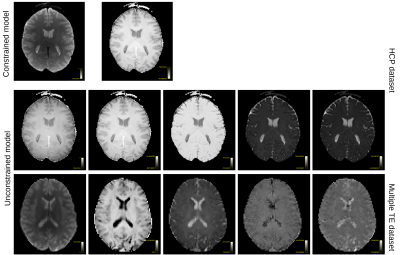
Figure 3: The first eigenvectors for the HCP dataset and for the multiple TE dataset. The constrained model is described by 2 components, despite being a four-parameter model. The first 5 eigenvectors of the unconstrained model show little contrast among themselves, suggesting that the acquisition cannot disentangle all model parameters. Bottom row shows the eigenvectors for data with varying b-tensors and TE. The contrast between images shows that additional information is captured by the acquisition.
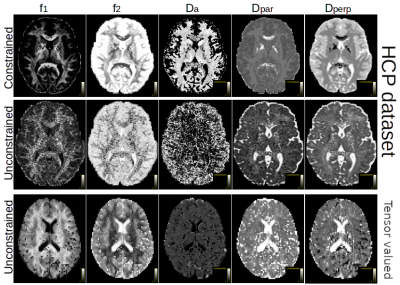
Figure 1: Parameter maps (diffusivities in mm2/s) obtained with maximizing the inner product for the two HCP datasets (top and middle row) and for the b-tensor dataset (bottom row). The constrained estimation (top row) enforces Dpar > Dperp, leading to coherent-looking parameter maps by forcing the model into a lower dimensional space, which is not supported as well by the unconstrained version. The b-tensor encoded dataset suffers less from this degeneracy by providing an additional sample dimension.
-
Towards analytical $$$T_2$$$ mapping using the bSSFP elliptical signal model
Yiyun Dong1, Qing-San Xiang2,3, and Michael Nicholas Hoff4
1Physics, University of Washington, Seattle, WA, United States, 2Physics, University of British Columbia, Vancouver, BC, Canada, 3Radiology, University of British Columbia, Vancouver, BC, Canada, 4Radiology, University of Washington, Seattle, WA, United States
The first analytical solution to relaxation parameter T2 mapping based on the bSSFP elliptical formulation is proposed. It is robust to variation in other imaging parameters, and gives rise to exact T2 quantification to complement artifact-free bSSFP.
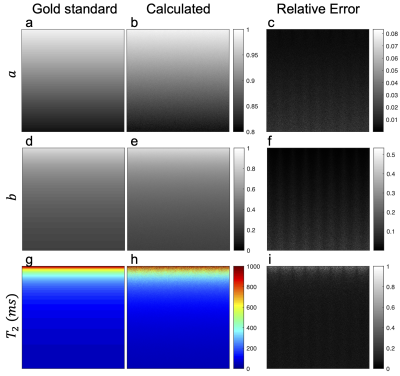
Figure 3: ESM parameter $$$a,b$$$ maps and relaxation parameter $$$T_2$$$ maps. Gold standard, calculated and relative error for $$$a$$$ solution (a-c), $$$b$$$ solution (d-f), and $$$T_2$$$ (g-i) depicted in columns from left to right respectively. Color is applied for better visibility of different $$$T_2$$$ values.
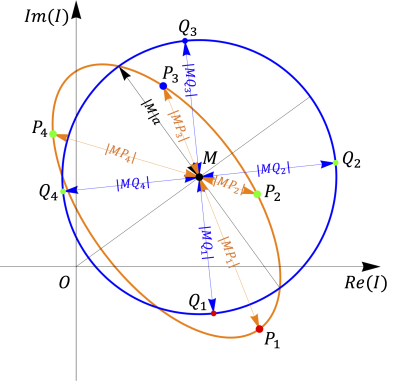
Figure 1: A example of the signal ellipse. The orange curve represents the signal ellipse. The blue curve represents the transformation of the signal ellipse $$$I_i$$$ with points $$$P_i$$$ to a circle with points $$$Q_i$$$. The blue curve center is indicated by the geometric cross-point $$$M$$$, and its radius by $$$|M|a=|MQ_i|$$$.
-
Quantitative T2 mapping from a single-contrast TSE scan using g-CAMP
Nahla M H Elsaid1, Nadine L Dispenza2, R Todd Constable1,3, Hemant D Tagare1,2, and Gigi Galiana1
1Radiology and Biomedical Imaging, Yale School of Medicine, New Haven, CT, United States, 2Department of Biomedical Engineering, Yale University, New Haven, CT, United States, 3Neurosurgery, Yale University, New Haven, CT, United States
This work presents quantitative T2-maps
and a full T2w-image series generated from an ordinary single contrast T2w-dataset
using the growing Constrained Alternating Minimization for Parameter mapping (g-CAMP)
reconstruction method.
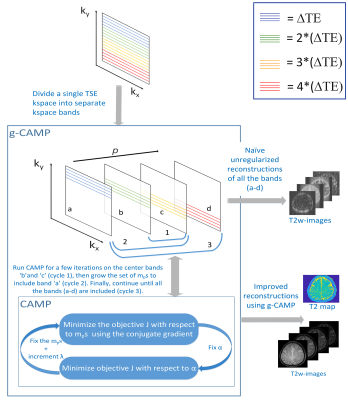
Figure 1. A framework of g-CAMP algorithm with four
mps, where the color of the k-space-lines represents acquisition at a
different
∆TE.
g-CAMP applies the CAMP algorithm to the center bands first (cycle 1) until it converges. Then g-CAMP grows the number of mps to include band 'a' (cycle 2) and finally, it includes all the bands (cycle 3).
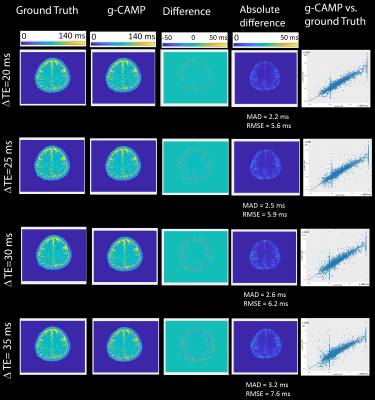
Figure 2. Simulation results showing the ground truth
T2 maps versus the maps reconstructed using g-CAMP, with the
difference images and the masked absolute differences (showing errors inside the
brain). In addition, regression analyses are plotted between pixel values of the g-CAMP T2
maps versus those of the ground truth.
-
Augmented T1 weighted (aT1W) contrast imaging
Yongquan Ye1, Jingyuan Lv1, Yichen Hu1, Zhongqi Zhang2, Jian Xu1, and Weiguo Zhang1
1UIH America, Inc., Houston, TX, United States, 2United Imaging Healthcare, Shanghai, China
A computational image processing method was proposed for improved T1 contrast on GRE signals acquired with dual-flip angles. The proposed augmented T1W (aT1W) method features in pure T1 weightings and high SNR in resultant images.
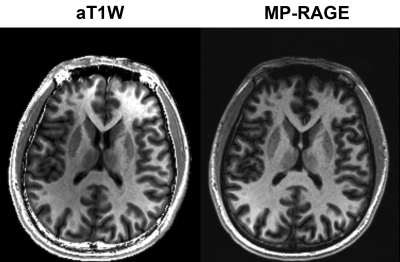
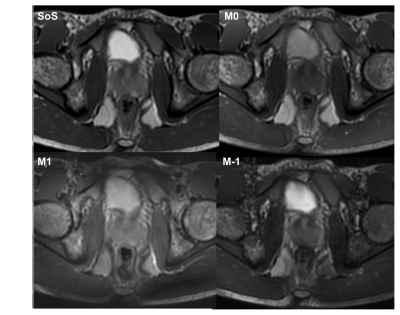
Figure.4 Comparison between aT1W images and T1 FLAIR images with TI=750ms.
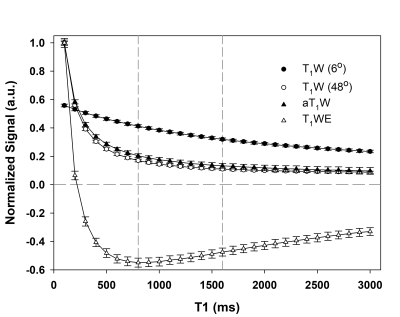
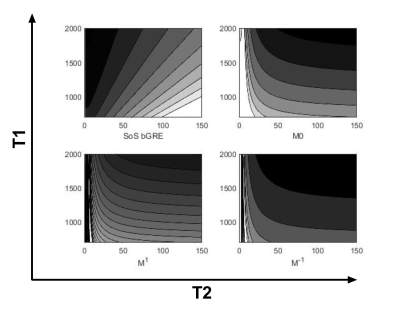
Figure.1 Simulated
signal changes as a function of T1 values, based on simplified Eq.1 with M0, E2
set as 1, TR=10ms, and α1/α2=6°/48°. All signals are normalized by their
respective values at T1=100ms. The two vertical reference lines indicate the
assumed T1 values for WM (800ms) and GM (1600ms). Note that T1WE signal curve
is non-monotonic.
-
Accelerating 3D variable-flip-angle T1 mapping: a prospective study based on SUPER-CAIPIRINHA
Fan Yang1, Jian Zhang2, Guobin Li2, Jiayu Zhu2, Xin Tang1, and Chenxi Hu1
1Institute of Medical Imaging Technology, School of Biomedical Engineering, Shanghai Jiao Tong University, Shanghai, China, 2United Imaging Healthcare Co., Ltd, Shanghai, China
Prospective SUPER-CAIPIRINHA
shows consistent image quality and accurate T1 quantification compared with
retrospective SUPER-CAPIRINHA and the gold standard. The scan time over the
entire cerebrum is reduced from more than 6 minutes to 1.5 mintues.
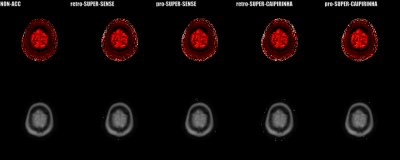
Figure
2. Reconstructed 3D T1 and M0 maps of whole cerebrum
for 1 healthy subject. Image quality was
similar
between SUPER-SENSE and SUPER-CAIPIRINHA and between retrospective and
prospective reconstruction. Image
fine details were truthfully
preserved even for 5-fold acceleration. SUPER-SENSE
and SUPER-CAIPIRINHA reduced the scan time from 6:11 minutes to 2:09 minutes
and 1:29 minutes, respectively.
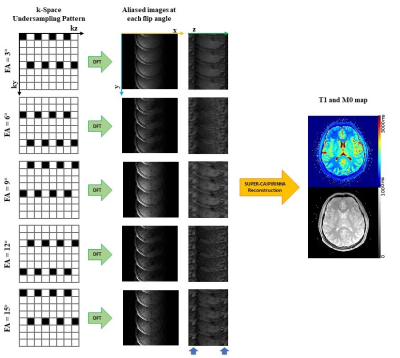
Figure
1. Acceleration pipeline of SUPER-CAIPIRINHA for 5-fold acceleration.
Column
1 shows k-Space undersampling
pattern of SUPER-CAIPIRINHA, black blocks represent points to be sampled while
white blocks represent undersampled
points in k-space.
Severe aliasing was caused by high undersampling
rate (column 2&3). Parametric maps
without aliasing artifact
were reconstructed by blockwise
curve-fitting method of SUPER (column
4).
-
Discriminative Ensemble Average Propagator radial profiles along fixels of the centrum semiovale
Gabrielle Grenier1, François Rheault1,2, and Maxime Descoteaux1
1Sherbrooke Connectivity Imaging Lab (SCIL), Université de Sherbrooke, Sherbrooke, QC, Canada, 2Electrical Engineering, Vanderbilt University, Nashville, TN, United States
The orientations of the corticospinal tracts are discriminated from the arcuate fasciculus and the corpus callosum by a sample of Ensemble Average Propagator values along different radii of the fixels in the 3-way crossing centrum semiovale region.
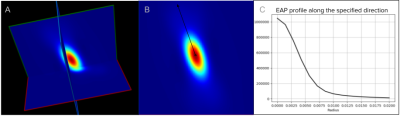
Figure 3 - Example of EAP reconstruction with MAP MRI of a single fiber population voxel of one subject from the HCP dataset. (A) 3D of the EAP reconstruction. (B) A 2D slice of the EAP. The black axis represents the orientation of the fiber population in the voxel (fixel). (C) Graph of the EAP profile computed from the angles of the fixels’ orientation at different radii in mm starting at 0mm to 0.020mm in this example.
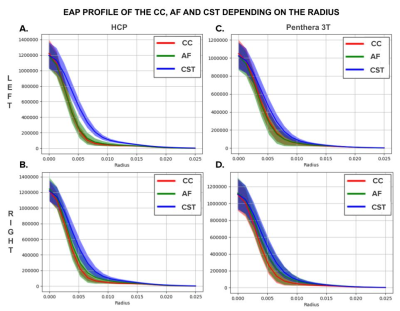
Figure 4 - Columns: EAP profiles of the three bundles depending on the database (HCP and Penthera 3T). Rows: EAP profiles depending on the region of interest (left or right).
-
Uniform Combined Reconstruction for Improving Receive Intensity Homogeneity of N-dimensional 7T MRI
Venkata Veerendranadh Chebrolu1, Xiaodong Zhong2, Patrick Liebig3, and Robin Heidemann3
1Siemens Medical Solutions USA, Inc., Rochester, MN, United States, 2Siemens Medical Solutions USA, Inc., Los Angeles, CA, United States, 3Siemens Healthcare GmbH, Erlangen, Germany
In this work, we extend the Uniform combined reconstruction (UNICORN) algorithm to improve receive uniformity of two-, three-, or more-dimensional (N-dimensional or ND) MRI. We also demonstrate UNICORN results using L1-based optimal combination of the multi-channel data.
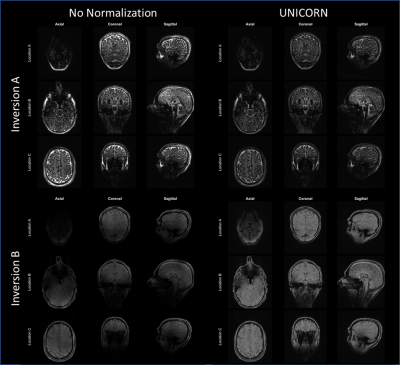
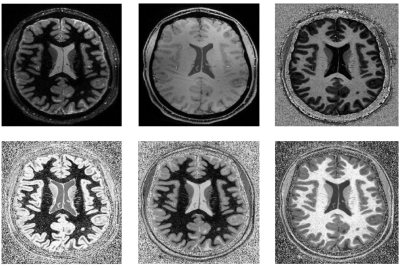
Figure 3: Comparison of uniformity between 7T brain MP2RAGE
MRI images with and without UNICORN (L1-based) normalization. UNICORN results for
both the inversion volumes from the 4D MP2RAGE data are shown. Images before and after normalization have
the same window-width (WW) and window-level (WL). It can be observed that
UNICORN reduced the hyper-intensity near the surface of the brain and improved
the conspicuity of the inferior regions of the brain.
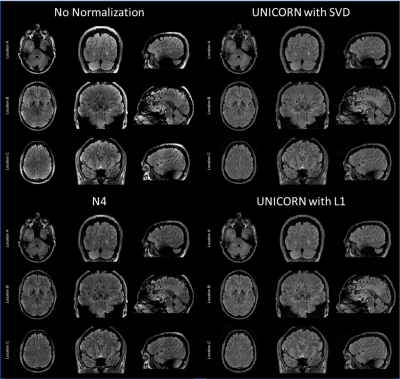
Figure 2: Comparison of 7T brain dark-fluid TSE MRI
images without normalization, with UNICORN normalization, and N4 normalization. UNICORN results
from both SVD- and L1-based optimal coil combination are shown. Same window-width
(WW) and window-level (WL) were used for all the images. It can be observed
that both UNICORN options reduced the hyper-intensity
near the surface of the brain. Improved intensity and uniformity in the
interior regions of the brain (relatively better than the N4 normalization
method) can also be observed.
-
QTI+: a constrained estimation framework for q-space trajectory imaging
Magnus Herberthson1, Tom Dela Haije2, Deneb Boito3,4, Aasa Feragen5, Carl-Fredrik Westin6, and Evren Özarslan3,4
1Dept. of Mathematics, Linköping University, Linköping, Sweden, 2Dept.of Computer Science, University of Copenhagen, Copenhagen, Denmark, 3Dept. of Biomedical Engineering, Linköping University, Linköping, Sweden, 4Center for Medical Image Science and Visualization, Linköping University, Linköping, Sweden, 5Department of Applied Mathematics and Computer Science, Technical University of Denmark, Lyngby, Denmark, 6Laboratory for Mathematics in Imaging, Department of Radiology, Brigham and Women’s Hospital, Harvard Medical School, Boston, Boston, MA, United States
We introduce
the QTI+ framework, which guarantees that the two first moments of
a diffusion tensor distribution characterizing tissue
fulfill appropriate mathematical conditions. QTI+
exhibits improved accuracy and precision under noisy conditions.
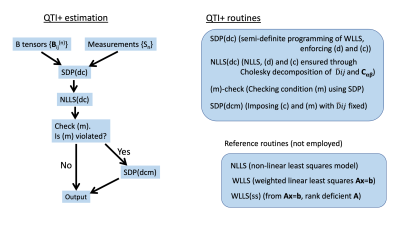
Figure 1. The estimation framework used in QTI+.
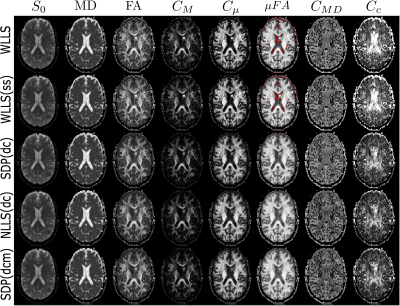
Figure 5. Maps of parameters estimated through all conventional (top two rows) and QTI+ methods. Red voxels in $$$\mu$$$FA depict complex values.
-
Complex-Valued Spatial-Temporal Super-Resolution Combined with Multi-Band Technique on MRI temperature mapping
Duohua Sun1, Jean-Philippe Galons2, Chidi Ugonna1, Silu Han1, and Nan-kuei Chen1
1Biomedical Engineering, The University of Arizona, Tucson, AZ, United States, 2Medical Imaging, The University of Arizona, Tucson, AZ, United States
Phase information can be utilized to significantly reduce the susceptibility
artifact, benefiting applications relying on phase mapping.
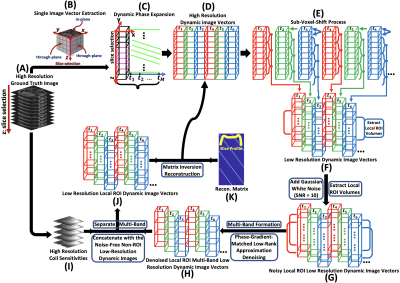
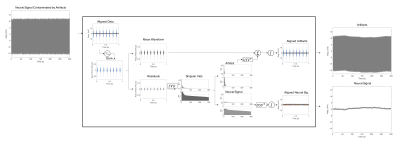
Fig. 1. (A): High-resolution
ground truth image; (B): Single image
vector extraction; (C): Temporal phase
expansion; (E-F): Forming low-resolution dynamic images; (G): Adding Gaussian noise, extracting local ROI; (H): Forming a denoised local ROI multi-band-low-resolution dynamic
images; (I): Coil sensitivities; (J): Separating
multi-band and concatenating with the noise-free non-ROI low-resolution dynamic
images to form low-resolution local ROI dynamic images; (K): The reconstruction matrix.
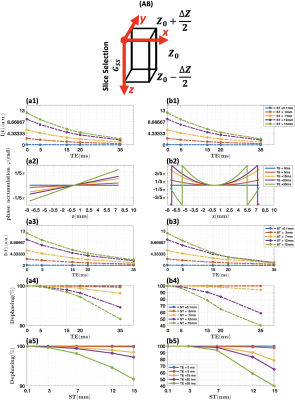
Fig. 2. Simulation results on through-plane
susceptibility effect on a single voxel. (AB):
Demonstration of the geometry of single voxel; ((a1), (b1)): Signal intensity with T2* decay without the present
of susceptibility gradient; Linear (a2)
and nonlinear (b2) susceptibility
gradients along the slice selection direction; ((a3), (b3)): Signal intensity with both T2* decay and
susceptibility gradient; ((a4), (b4)): Dephasing
effect vs echo time; ((a5), (b5)): Dephasing
effect vs slice thickness.
-
Deep Generalization of Signal Compensation for Fast Parameter Mapping in k-Space
Zhuo-Xu Cui1, Yuanyuan Liu2, Qingyong Zhu1, Jing Cheng2, and Dong Liang1,2
1Research center for Medical AI, Shenzhen Institutes of Advanced Technology, Chinese Academy of Sciences, Shenzhen, China, 2Paul C. Lauterbur Research Center for Biomedical Imaging, Shenzhen Institutes of Advanced Technology, Chinese Academy of Sciences, Shenzhen, China
In this paper, a physical decayed annihilation relation is proposed for MR parameter mapping, and a CNN based k-space interpolation method is further proposed via generalization.
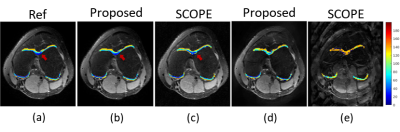
Figure 4. The estimated T1ρ parameter
maps for selected cartilage ROIs with axial view overlaid on the reconstructed T1ρ-weighted images at TSL=5 ms with 6x
accelerated Possion sampling pattern ((b) and (c)) and with 7.6x accelerated
uniform sampling pattern ((d) and (e)). Visually, as can be seen from the
direction of the arrow, our proposed method is more accurate in estimating the T1ρ parameter
maps than SCOPE.
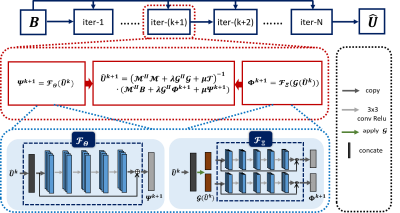
Figure 2. The framework of the
proposed k-space
interpolation network.
It consists of several stages and each stage is a component of three modules: learned k-space
interpolation module, data consistency module and learned joint TV module (from left to right in red box).
-
Faster and better HARDI using FSE and holistic reconstruction
Maarten Naeyaert1, Vladimir Golkov2, Daniel Cremers2, Jan Sijbers3, and Marleen Verhoye4
1Radiology, Universitair Ziekenhuis Brussel, Brussels, Belgium, 2Department of Computer Science, Technical University of Munich, Garching, Germany, 3Imec-Vision Lab, University of Antwerp, Wilrijk, Belgium, 4Bio-Imaging Lab, University of Antwerp, Wilrijk, Belgium
Simultaneous
subsampling of k- and q-space of FSE-HARDI data can improve the reconstruction
quality over only q-space subsampling for a given subsampling
factor. Alternating the phase-encoding direction for each volume improves the
results.
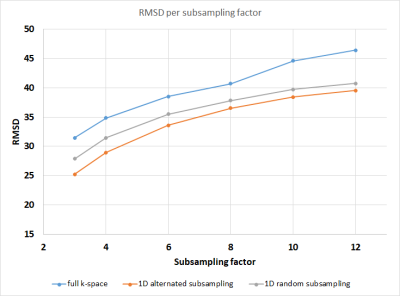
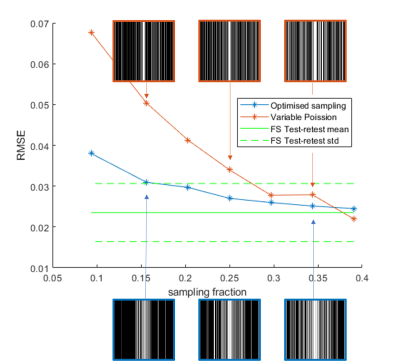
Figure 1:
RMSD values for all subsampling factors and subsampling
strategies. Blue: full k-space, orange: 1D alternated subsampling, grey: 1D random
subsampling. Higher subsampling
factors lead to a larger error, but for all factors 1D
alternated subsampling performs best, indicating the enhanced performance
of subsampling in q-space and 2
k-space dimensions.
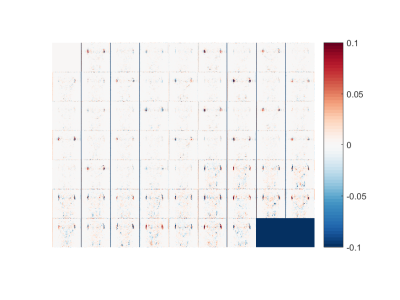
Figure 2:
Normalized reconstruction error of a single slice for b0 (top, left) and all 60
diffusion direction, for the best case results, using 1/3 of the original data
by using 40 q-space coordinates and 1d alternated subsampling.
Most errors are
near the ears, whereas in the
brain errors are very small.
-
Simultaneous multi-slice 3D Spatiotemporal Encoding (SPEN) Imaging: Emulation study
Jaeyong Yu1,2, Sugil Kim3, Jae-Kyun Ryu4, and Jang-Yeon Park1,2,4
1Department of Biomedical Engineering, Sungkyunkwan University, Suwon, Korea, Republic of, 2Department of Intelligent Precision Healthcare Convergence, Sungkyunkwan University, Suwon, Korea, Republic of, 3Siemens Healthineers, Seoul, Korea, Republic of, 4Biomedical Institute for Convergence at SKKU, Sungkyunkwan University, Suwon, Korea, Republic of
In this work, we propose a 3D
spatiotemporal encoding (SPEN) SMS imaging with controlled aliasing
for parallel imaging results in higher acceleration (CAIPIRINHA) and split
slice generalized auto-calibrating partially parallel acquisitions (Split
Slice-GRAPPA).
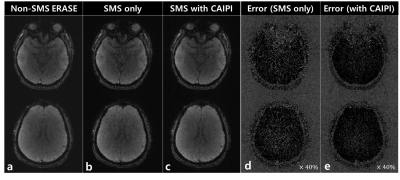
Figure 4: Illustrating the comparison of
reference non-SMS ERASE images, SMS-ERASE images with no CAIPI, and SMS-ERASE
images with CAIPI. (a) Two slices of non-SMS ERASE, (b) Unfolded images of
SMS-ERASE with no CAIPI, (c) Unfolded images of SMS-ERASE with CAIPI, (d) Error
maps obtained by subtracting SMS-ERASE images with no CAIPI from non-SMS ERASE
images, (e) Error maps obtained by subtracting SMS-ERASE images with CAIPI from
non-SMS ERASE images.
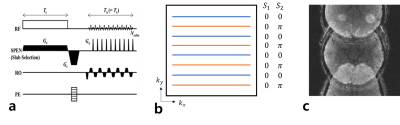
Figure 1: (a) Pulse sequence diagram of
the original non-SMS ERASE, (b) Schematic representation of CAIPI in case of
two-banded SMS ERASE, (c) Aliased images of SMS-ERASE with reduction of aliased
regions by CAIPI.
-
Simultaneous T1- and T2-weighted imaging using RF phase modulated gradient echo imaging
Daiki Tamada1 and Scott B. Reeder1,2,3,4,5
1Radiology, University of Wisconsin-Madison, Madison, WI, United States, 2Medical Physics, University of Wisconsin-Madison, Madison, WI, United States, 3Biomedical Engineering, University of Wisconsin-Madison, Madison, WI, United States, 4Medicine, University of Wisconsin-Madison, Madison, WI, United States, 5Emergency Medicine, University of Wisconsin-Madison, Madison, WI, United States
A novel method for simultaneous T1 and T2-weighted imaging using RF
phase-modulated GRE with small RF phase increments is presented. Phantom and in vivo experiments suggested the proposed method enables faster imaging
compared to conventional FSE imaging.
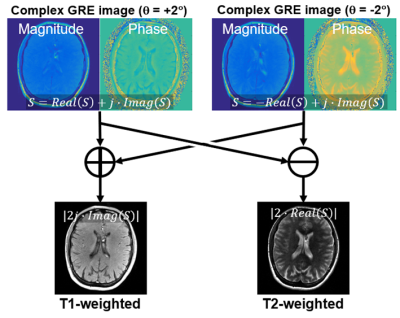
Figure
1 Proposed
reconstruction scheme used in this study. To remove the background phase, two
acquisitions with opposite RF phase increments are acquired. T1w and T2w images
were calculated through the addition and subtraction of these images.
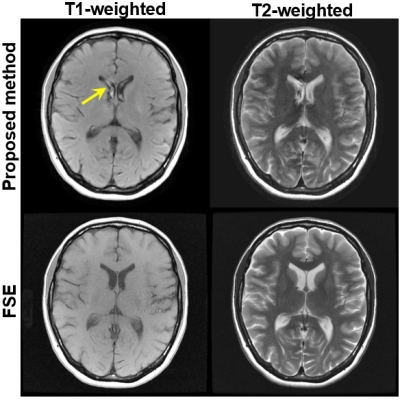
Figure
4 T1w and T2w
images produced using the proposed method, compared with T1w and T2w FSE. Both
images using the proposed method showed similar contrast to those using FSE
imaging. The proposed method exhibited slightly weaker gray-white matter T1w
contrast and slightly weaker T2w contrast in the basal ganglia. Mild flow-related
artifacts were also observed in the CSF (arrow). Scan time for the proposed
method was 1:02 min, compared to 2:23 min for T1w and T2w FSE.