-
Effect of the training set on supervised-learning parameter estimation: Application to the Standard Model of diffusion in white matter
Ying Liao1, Santiago Coelho1, Jelle Veraart1, Els Fieremans1, and Dmitry S. Novikov1
1Radiology, NYU School of Medicine, New York, NY, United States
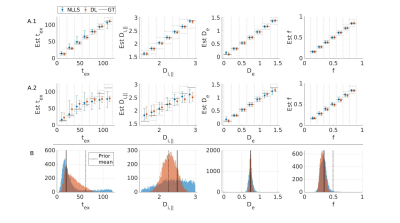
Here we quantify the effect of the training set on the popular diffusion model, the Standard Model of diffusion in the white matter, as function of signal-to-noise ratio, in simulations and in vivo.
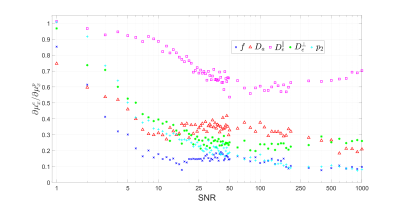
Figure.
3. Effect of prior distribution on parameter estimation of synthetic data.
The slope $$$\partial \mu_{x}^{e}/\partial\mu_{x}^{p}$$$ of linear regression
of parameter estimate mean $$$\mu_{x}^{e}$$$ with respect to the mean of prior distribution $$$\mu_{x}^{p}$$$ is plotted against SNR for each SM parameter. We see that the diffusivities are notably more sensitive to prior (and less to measurement) than $$$f$$$ and $$$p_2$$$.
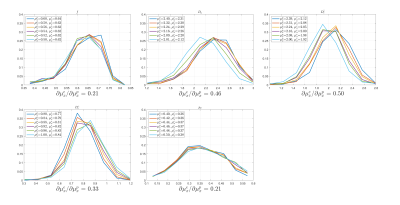
Figure.
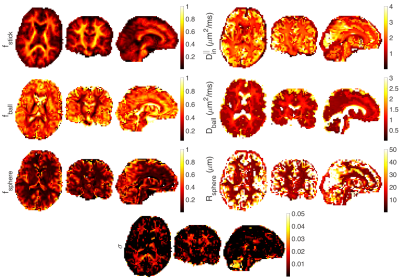
4. Histogram of estimated parameters with different prior distributions for in-vivo data.
Histograms of each parameter estimated by polynomial regression trained by
different prior distributions are plotted for in-vivo data. Mean of the prior
distribution $$$\mu_{x}^{p}$$$ and the estimate mean $$$\mu_{x}^{e}$$$ of the
same parameter are provided in the legend for every SM parameter, while the slope $$$\partial\mu_{x}^{e}/\partial\mu_{x}^{p}$$$
is written under each subfigure.
-
Feasibility of white matter Standard Model parameter estimation in clinical settings
Santiago Coelho1, Steven Baete1, Gregory Lemberskiy1, Benjamin Ades-aron1, Jelle Veraart1, Dmitry S. Novikov1, and Els Fieremans1
1Radiology, NYU School of Medicine, New York, NY, United States
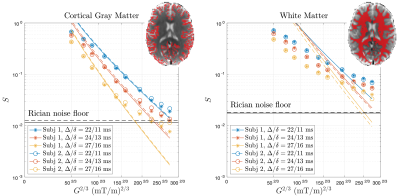
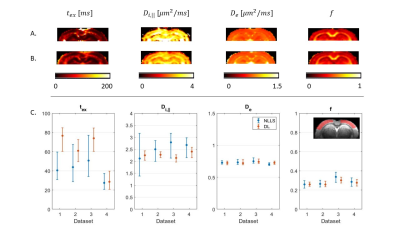
We apply optimal scanner-specific diffusion protocols to estimate microstructural parameters in 15 minutes with clinical scanners. We show reproducible scan-rescan results and assess inter-scanner variability.
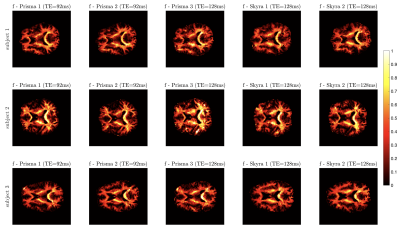
Parametric maps of f shown for all protocols and scanners.
Standard model parametric maps for one of the subjects. A WM ROI extracted from the JHU WM atlas is drawn on top of the map. Bottom row shows the corresponding parametric histograms for the plotted ROI.
-
Estimating cortical soma and neurite densities from diffusion MRI measures using a machine learning approach
Tianjia Zhu1,2, Minhui Ouyang1, Nikou Lei3, David Wolk4, Paul Yushkevich5, and Hao Huang1,5
1Department of Radiology, Children's Hospital of Philadelphia, Philadelphia, PA, United States, 2Department of Bioengineering, University of Pennsylvania, Philadelphia, PA, United States, 3Department of Physics, University of Washington Seattle, Seattle, WA, United States, 4Department of Neurology, University of Pennsylvania, Philadelphia, PA, United States, 5Department of Radiology, University of Pennsylvania, Philadelphia, PA, United States
We
show that a data-driven machine learning approach developed using registered high-resolution
dMRI and histological data of the macaque brain can predict soma and neurite
densities from DTI and DKI metrics.
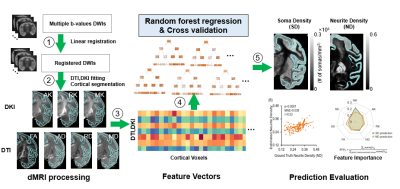
Fig.1 Soma
and neurite densities (SD and ND) estimation from diffusion MRI metrics. Left:
Diffusion weight images registration and DTI, DKI fitting. Cortical
segmentation and overlay on fitted parameter maps. axial kurtosis (AK), radial kurtosis (RK), mean kurtosis (MK),
fractional anisotropy (FA), axial diffusivity (AD), radial diffusivity (RD),
mean diffusivity (MD). Middle: Each voxel in the cortex served as a training
sample in random forest regressor. Right: Estimated SD and ND values. Estimation
evaluation and extraction of feature importance from model.
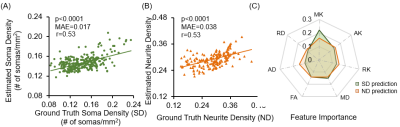
Fig.4 Soma
and neurite densities (SD and ND) estimation results and feature importance. A: Significant linear correlation between ground truth SD and estimated SD on validation set. (P<0.0001, mean absolute error (MAE)=0.017, Pearson
correlation coefficient r=0.53). B: Significant linear correlation between ground
truth ND and estimated ND on validation set. (P<0.0001, MAE= 0.038, Pearson
correlation coefficient r=0.53). Panel C: Feature importance for each metric.
MK ranks firsts for both SD and ND estimation.
-
Mapping apparent soma and neurite density in the in-vivo mouse brain using SANDI
Andrada Ianus1, Francisca F. Fernandes1, Joana Carvalho1, Cristina Chavarrias1, Marco Palombo2, and Noam Shemesh1
1Champalimaud Centre for the Unknown, Lisbon, Portugal, 2University College London, London, United Kingdom
Measuring
micro-architectural features is emerging as a frontier of diffusion MRI. This
work maps apparent soma and neurite density via the SANDI methodology in
the mouse brain in-vivo at 9.4T, showing consistency between animals,
and the feasibility of shortening the acquisition protocol.
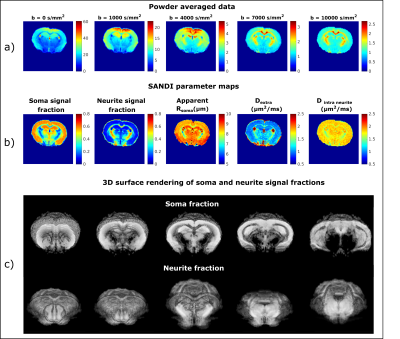
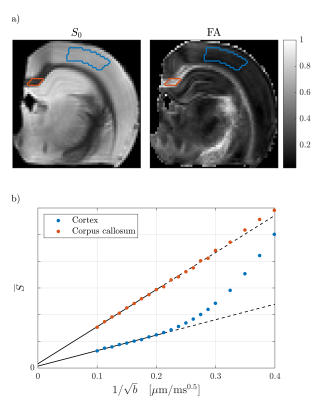
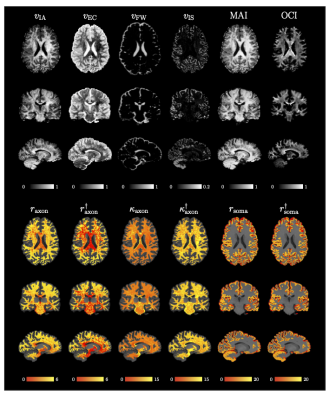
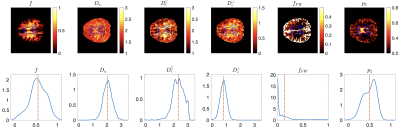
Figure 1a) b0 images and powder averaged data for
different b-values (increasing from left to right) from one representative
mouse. The SNR of b0 images is 15-25 in WM and 20-50 in GM. b) SANDI parameter maps revealing high soma signal fraction in GM,
high neurite signal fraction in WM and high extracellular diffusivity (and signal
fraction, not shown) in CSF. Apparent soma radius and intra neurite diffusivity
show less contrast between WM and GM. c) 3D surface rendering of
soma and neurite fraction obtained in ImageJ using a visualisation threshold of
0.4 and 0.2, respectively.
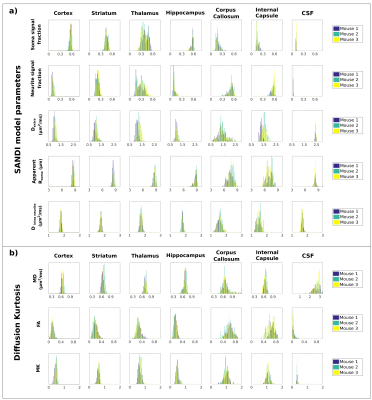
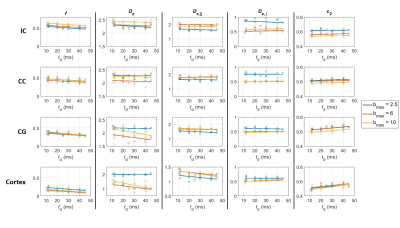
Figure 3 Histograms of a) SANDI and b) DKI parameters in
different ROIs (left to right: cortex, striatum, thalamus, hippocampus, corpus
callosum, internal capsule and CSF). Different rows represent different model
parameters, and the colours reflect the 3 mice. An overlap of the parameter
histograms is observed for most parameters and ROIs.
-
Not all voxels are created equal: reducing estimation bias in regional NODDI metrics using tissue-weighted mean
Christopher S Parker1, Thomas Veale2, Martina Bocchetta2, Catherine F Slattery2, Nick Fox2, Jonathan M Schott2, Dave M Cash1,2, and Hui Zhang1
1Centre for Medical Image Computing, Department of Computer Science, UCL, London, United Kingdom, 2Dementia Research Centre, Department of Neurodegenerative Disease, UCL Queen Square, Institute of Neurology, UCL, London, United Kingdom
Tissue-weighted means utilise the tissue fraction from NODDI to calculate the average microstructural property of the tissue compartments within a region. This provides unbiased estimates of region tissue microstructure when microstructure spatially covaries with tissue fraction.
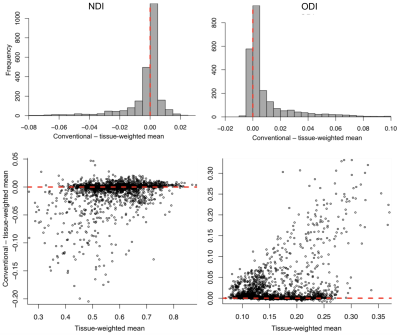
Figure 1. Upper: Histogram of difference between conventional and tissue-weighted means for NDI (left) and ODI (right). The heavy tails of the distributions demonstrate how the conventional mean was in general a biased estimate of the tissue mean, under- and over-estimating NDI and ODI, respectively. Lower: Bland-Altmann style plot of the difference between the conventional and tissue-weighted means across all ROIs and subjects (2448 ROIs). The difference tends to decrease and increase as a function of tissue-weighted mean for NDI and ODI, respectively.
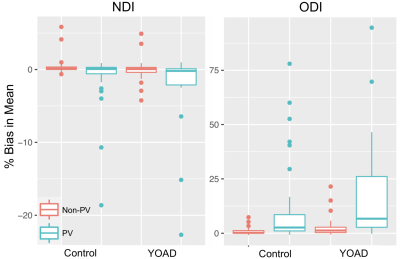
Figure 2. Percentage bias in the ROI between-subject averaged conventional means, for NDI (left) and ODI (right). Each boxplot shows the distribution across ROIs of the percentage difference in the between-subject average conventional and tissue-weighted mean for PV and non-PV ROIs in control and YOAD subjects. NDI tended to be under-estimated, apart from control subjects non-PV ROIs, which were over-estimated. ODI was over-estimated in PV and non-PV ROIs for control and YOAD subjects.
-
Relevance of NODDI to Characterise In Vivo the Microstructural Abnormalities of Multiple Sclerosis Cortex and Cortical Lesions: A 3T Study
Elisabetta Pagani1, Paolo Preziosa1,2, Raffaello Bonacchi1,2, Laura Cacciaguerra1,2,3, Massimo Filippi1,2,3,4,5, and Maria A. Rocca1,2,3
1Neuroimaging Research Unit, Division of Neuroscience, IRCCS San Raffaele Scientific Institute, Milan, Italy, 2Neurology Unit, IRCCS San Raffaele Scientific Institute, Milan, Italy, 3Vita-Salute San Raffaele Unversity, Milan, Italy, 4Neurorehabilitation Unit, IRCCS San Raffaele Scientific Institute, Milan, Italy, 5Neurophysiology Service, IRCCS San Raffaele Scientific Institute, Milan, Italy
A significant neurite loss occurs in the cortex
of multiple sclerosis patients, being more severe with longer disease duration
and more severe disability. Cortical lesions show a further reduction, with
increased inflammation, gliosis, and
simplification of neurite complexity.
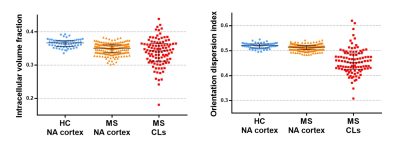
Figure 2. Scatter plots of NODDI
indexes obtained within the normal-appearing cortex (NA-cortex) and cortical
lesions (CLs) of MS patients and healthy controls.
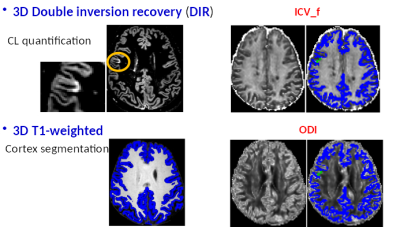
Figure 1. The postprocessing is
shown for a representative MS patient: after the segmentation of cortical
lesions and gray matter, masks are overlapped on the maps of intracellular
volume fraction (ICV_f) and orientation dispersion (ODI).
-
Deep Learner estimated isotropic volume fraction enables reliable single-shell NODDI reconstruction
Abrar Faiyaz1, Marvin M Doyley1,2,3, Giovanni Schifitto2,4, Jianhui Zhong2,3,5, and Md Nasir Uddin4
1Department of Electrical and Computer Engineering, University of Rochester, Rochester, NY, United States, 2Department of Imaging Sciences, University of Rochester, Rochester, NY, United States, 3Department of Biomedical Engineering, University of Rochester, Rochester, NY, United States, 4Department of Neurology, University of Rochester, Rochester, NY, United States, 5Department of Physics and Astronomy, University of Rochester, Rochester, NY, United States
The study enables single-shell fISO estimation with FA and T2 weighted non-diffusion signal-based sparse dictionary, and utilizes a Deep Learner-based NODDI framework for single-shell NDI and ODI estimation comparable with multi-shell NODDI (error <5%).
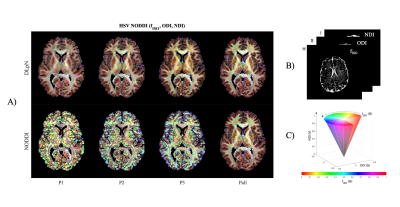
Figure 2: A) HSV (Hue, Saturation, Value) maps generated with fISO, ODI and NDI in respective channels- H, S and V shows single- and multi-shell maps generated with DLpN and NODDI. B) shows HSV channels and C) shows colormap for fISO and overall HSV space.
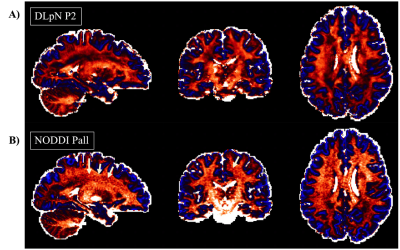
Figure 5: Comparison of single-shell DLpN with P2 (DLpNP2) and multi-shell NODDI (NODDIPall) that reported minimum error, shows noisy estimation from multi-shell could be addressed with DLpN single-shell reconstructed NDI. White arrows show some regions with noisy overestimation in NODDIPall NDI.
-
B-value influence on IVIM MRI for juvenile idiopathic arthritis in the knee
Kilian Stumpf1, Anna-Katinka Bracher2, Thomas Hüfken1, Britta Huch2, Meinrad Beer2, Henning Neubauer2, and Volker Rasche1
1Department of Internal Medicine II, Ulm University Medical Center, Ulm, Germany, 2Department of Diagnostic and Interventional Radiology, Ulm University Medical Center, Ulm, Germany
IVIM MRI of juvenile idiopathic arthritis
in the knee can be performed reliably with as few as 5 b-values,
while attention has to be paid to a high enough b-value threshold
during fitting of diffusion and perfusion values.
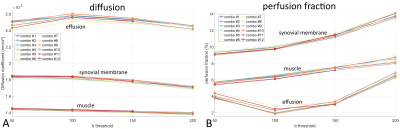
Figure 1: Diffusion coefficients (A) and perfusion
fraction (B) for effusion, synovial membrane and muscle tissue
calculated with 12 different b combinations and 4 b-thresholds
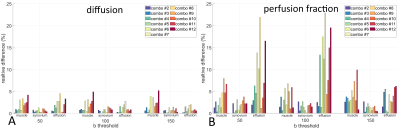
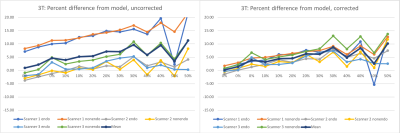
Figure 2: Relative difference of the calculated
diffusion (A) and perfusion fraction (B) values between b-value
combination #1 and all other b-combinations.
-
Fast and accurate quantification of intra-voxel incoherent motion (IVIM) with spherical-tensor-encoded diffusion MRI
Alberto De Luca1,2, Geert-Jan Biessels1, Ofer Pasternak3, and Chantal MW Tax4,5
1Department of Neurology, University Medical Center Utrecht, Utrecht, Netherlands, 2PROVIDI Lab, Image Sciences Institute, University Medical Center Utrecht, Utrecht, Netherlands, 3Brigham and Women's Hospital, Harvard Medical School, Boston, MA, United States, 4Cardiff University Brain Research, Imaging Centre (CUBRIC), University of Cardiff, Cardiff, United Kingdom, 5Image Sciences Institute, University Medical Center Utrecht, Utrecht, Netherlands
Diffusion MRI with spherical tensor encoding is promising to obtain unbiased quantifications of IVIM effects such as blood pseudo-diffusion with less data requirement and better accuracy than conventional diffusion encoding.
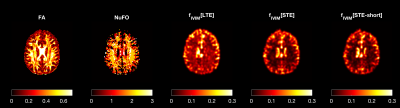
Fig. 3: An axial image of the fractional anisotropy (FA) number of fibers (NuFO) and fIVIM obtained with MRI data of a human brain containing both LTE and STE. fIVIM[LTE] exhibits higher values than fIVIM[STE], especially in correspondence of NuFO values above 1. fIVIM[STE] and fIVIM[STE-short] are remarkably similar showing higher value in gray matter than white matter, as expected from known physiology.
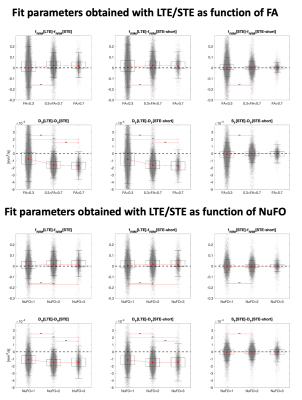
Fig. 4: Boxplots showing difference between fIVIM and DT estimated with LTE and STE data as a function of FA (top) and of the number of fibers (NuFO, bottom). The red dots represent the median value. The red bars with asterisks indicate a significant difference in distribution (sign test). The difference in fIVIM and DT between LTE and STE is significantly larger in voxels with intermediate to large FA, or containing 2 or 3 fibers, and have considerable non-zero magnitude. Significant differences are also detected when comparing STE to STE-short, but these have almost zero magnitude.
-
Effect of the Signal-to-noise Ratio on the Optimal Model Mapping for Intravoxel Incoherent Motion MRI
Yen-Peng Liao1,2, Shin-ichi Urayama1,2, Tadashi Isa1,2,3, and Hidenao Fukuyama2,4
1Department of Neuroscience, Kyoto University Graduate School of Medicine, Kyoto, Japan, 2Human Brain Research Center, Kyoto University Graduate School of Medicine, Kyoto, Japan, 3Institute for the Advanced Study of Human Biology (ASHBi), Kyoto University, Kyoto, Japan, 4Yasu City Hospital, Yasu, Japan
The aim of this study is to investigate the effect of the signal-to-noise ratio (SNR) in the optimal model mapping method for the IVIM-MRI. A sufficient high SNR was needed for the optimal model mapping method. The potential of the optimal model mapping can be expected with quality IVIM-MRI data.
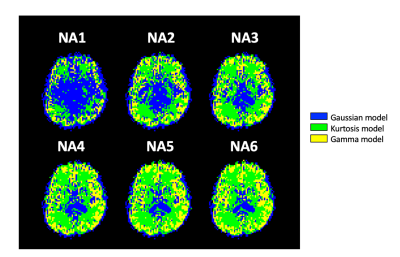
Figure 1. The optimal model maps with different NAs.
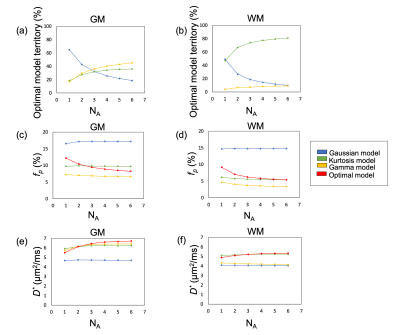
Figure 3. The influence of SNR (represented by number of averages, NA) on the percentage optimal model territory, fp, and D*.
-
Gaussian Mixture for Peak Identification in Non-Negative Least Squares Fitting of the IVIM Signal
Lucas M da Costa1, Bruno Hebling Vieira1, Renata Ferranti Leoni1, and Andre Monteiro Paschoal1,2
1InBrain Lab - University of Sao Paulo, Ribeirao Preto, Brazil, 2LIM44, Instituto e Departamento de Radiologia, Faculdade de Medicina, Universidade de Sao Paulo, Sao Paulo, Brazil
The fitting of IVIM data is a crucial step in IVIM data processing. The non-negative least square model is an interesting alternative which does not require prior information on the number of components of the total signal. Adding the Gaussian mixture to the model makes it a more robust analysis.
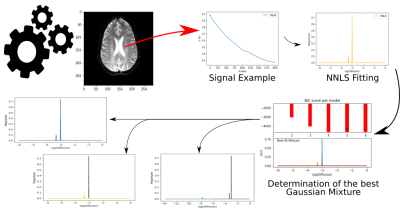
Figure 1: IVIM processing scheme. Gaussian curve associated with the diffusion peak (blue), pseudo-diffusion peak (yellow), and a third peak obtained with the Gaussian Mixture (green).
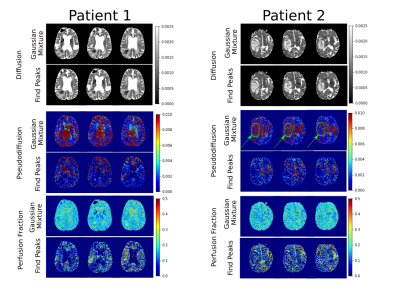
Figure 3: Comparison of the Gaussian Mixture with the traditional method (find peaks) for two patients with glioma. The green arrow shows the region that we can see a contrast of the tumor in the pseudo-diffusion image.
-
Model-based reconstruction for IVIM and combined IVIM-DTI fitting: Initial experience
Susanne Rauh1, Oliver Maier2, Oliver Gurney-Champion3, Melissa Hooijmans3, Rudolf Stollberger2,4, Aart Nederveen3, and Gustav Strijkers1
1Department of Biomedical Engineering and Physics, Amsterdam UMC, location AMC, Amsterdam, Netherlands, 2Institute of Medical Engineering, Graz University of Technology, Graz, Austria, 3Department of Radiology and Nuclear Medicine, Amsterdam UMC, location AMC, Amsterdam, Netherlands, 4BioTechMed-Graz, Graz, Austria
Model-based reconstruction is feasible for IVIM and combined
IVIM-DTI fitting in abdominal organs. The parameter maps reveal more detail and show less artifacts compared to those obtained with a conventional fit. Mean values are similar between the two methods.
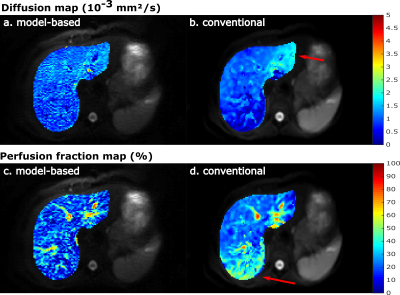
Figure 3: IVIM
parameter maps of the liver, obtained with model-based reconstruction on the
left (a and c) and the conventional fit on the right-hand side (b and d). The
conventional fit seems to overestimate the diffusion coefficient in the left
liver lobe and perfusion fraction in the bottom of the liver (red arrows). This
behavior is not observed in the model-based reconstructed maps.
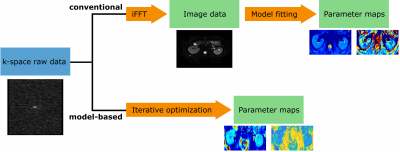
Figure 1: Schematic view of the conventional (top) and
model-based (bottom) reconstruction and fitting process. Conventionally,
magnitude-only images are reconstructed prior to the model fitting. However,
the modulus operation transforms the noise from a complex Gaussian to a Rician
distribution. In the model-based reconstruction the quantitative model is
included in the reconstruction process, thus the Gaussian noise assumption is
valid. iFFT: inverse fast Fourier transform.
-
Physically Motivated Deep-Neural Networks of the Intravoxel Incoherent Motion Signal Decay Model for Quantitative Diffusion-Weighted MRI
Shira Nemirovsky-Rotman1, Elad Rotman1, Onur Afacan2, Sila Kurugol2, Simon Warfield2, and Moti Freiman1
1Biomedical Engineering, Technion, Haifa, Israel, 2Boston's Children's Hospital, Harvard Medical School, Boston, MA, United States
A deep learning model is introduced for Quantitative
Diffusion-Weighted MRI with the Intra-Voxel Incoherent Motion model, which
incorporates the acquisition protocol into the network input, thus providing improved
robustness of parameters estimates to acquisition protocol variations.
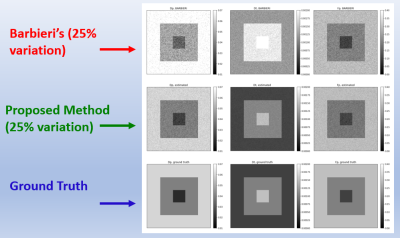
Proposed method estimated parameters maps compared to Barbieri's, with the ground truth maps on the bottom row.
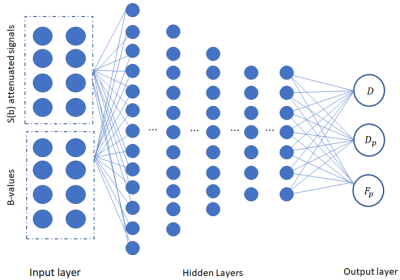
Proposed method architecture, where the acquisition parameters are added to the network's input.
-
Self-supervised IVIM DWI parameter estimation with a physics based forward model
Serge Vasylechko1,2, Simon K. Warfield1,2, Onur Afacan1,2, and Sila Kurugol1,2
1Computational Radiology Laboratory, Boston Children's Hospital, Boston, MA, United States, 2Harvard Medical School, Boston, MA, United States
Assessment of the robustness and repeatability of intravoxel incoherent motion model (IVIM) parameter estimation for the diffusion weighted MRI in the abdominal organs under the constraints of noisy diffusion signal using a novel neural network training method.
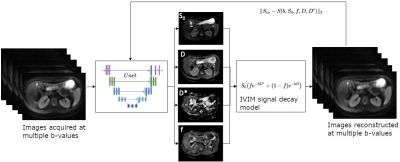
Figure 1. A network structure of the proposed method for a physics guided IVIM parameter estimation with a self supervised U-net architecture. An input consists of a 3 dimensional array, which is a concatenation of a 2D slice acquired at 7 b-values. The input is passed through a U-net to produce 4 IVIM parameter estimates at each pixel. In the second stage, the parameter estimates are used in the IVIM equation to reconstruct the original input image array. L2 loss between the output and the original input is used to propagate gradients backwards through the network.
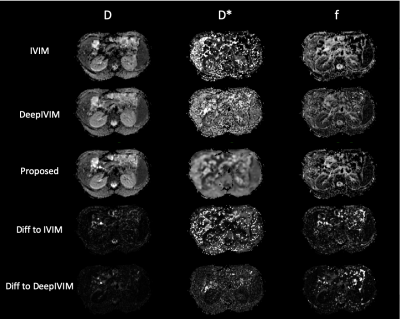
Figure 2. An example of IVIM parameter estimates with the conventional voxelwise IVIM fitting method, DeepIVIM and the proposed self-supervised approach. Difference image between the proposed method and each of the alternative methods is shown in the bottom two rows. The proposed method shows strong agreement with estimates of the conventional fitting method for the estimates of D and f, but a more coherent visual graph of D*.
-
Intravoxel Incoherent Motion Reconstruction with Multi-Orientation Acquisition using Three b-Values
Sam Sharifzadeh Javidi1 and Hamidreza Saligheh Rad1,2
1Department of Medical Physics and Biomedical Engineering, Tehran University of Medical Sciences, Tehran, Iran (Islamic Republic of), 2Quantitative MR Imaging and Spectroscopy Group, Research Center for Molecular and Cellular Imaging, Tehran, Iran (Islamic Republic of)
Changing the IVIM imaging pattern
from three orthogonal orientations and several b-values to alternative imaging
with multi orientations and three b-values improved the accuracy of estimating
output parameters.
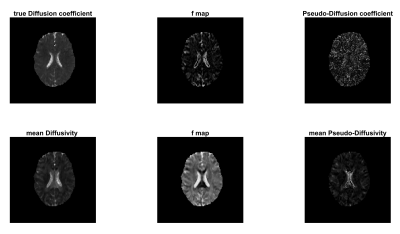
Fig 1. In-vivo comparison of estimated parameters using conventional
IVIM (upper row) and alternative multi orientations method (bottom row).
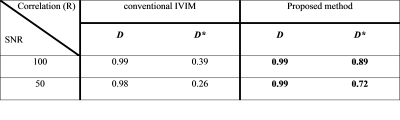
Table
1 Correlation coefficient between ground truth and
estimated parameters (D and D*) for the conventional method and proposed method.
-
Time-dependent and TE-dependent Diffusivity in Human Brain using Multi-TE Oscillating Gradient Spin Echo in High Gradient 3.0T MRI (MAGNUS)
Ante Zhu1, Luca Marinelli1, and Thomas K.F. Foo1
1GE Global Research, Niskayuna, NY, United States
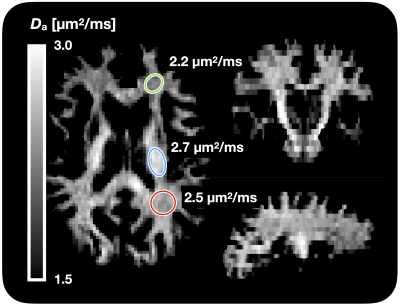
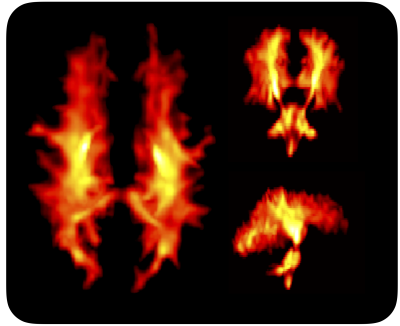
At TEs varying from 72 ms to 158 ms, measured mean/parallel/radial diffusivities increase as OGSE frequency increases, and fit to the short-range disorder model. Diffusivity measurements of the corpus callosum are higher at shorter TEs, indicating T2 effects on diffusivity measurements.
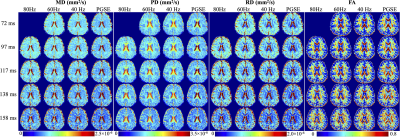
Figure 2. MD, PD, RD and FA maps at different OGSE frequencies and different TEs.
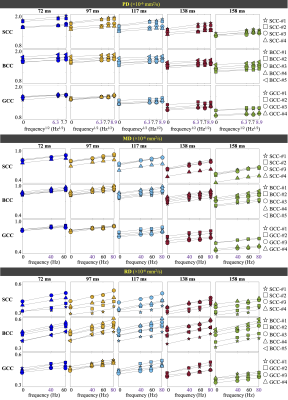
Figure 3. Measured PD, MD and RD of white matter parcels in the splenium (SCC), body (BCC) and genu (GCC) of the corpus callosum at different frequencies and different TEs.
-
A novel clinically viable method to quantify T2 of intra and extra axonal compartmental tissue properties
Sudhir Kumar Pathak1, Vishwesh Nath2, B V Rathish Kumar3, and Walter Schneider1
1Psychology, University of Pittsburgh, Pittsburgh, PA, United States, 2Nvidia, Bethesda, MD, United States, 3Mathematics, Indian Institute of Technology Kanpur, Kanpur, India
We have proposed an extended SMT framework to estimate intra and extra-axonal T2 along with volume fraction and axial and radial diffusivity. A numerical framework is also presented to estimate all parameters for a typical multi-shell diffusion protocol.
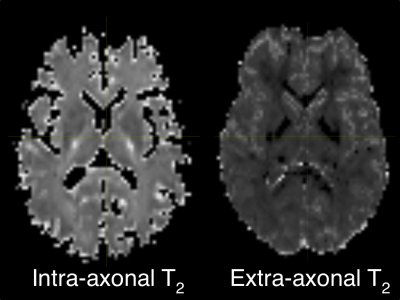
Axial Slice of intra and extra-axonal T2. Higher values in the internal capsule show highly myelinated axons.
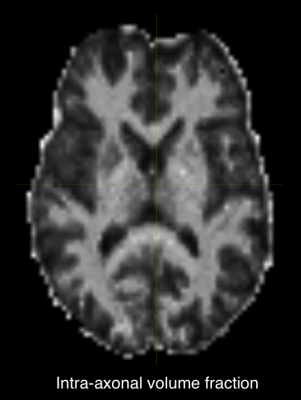
Axial Slice of intra-axonal volume fraction. Estimated intra-axonal volume shows a clear segmentation of white matter tissue that is consistent with SMT model.
-
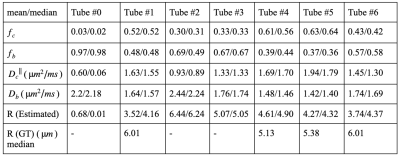
Nonparametric 5D D-R2 distribution imaging with single-shot EPI at 21.1 T: Initial results for in vivo rat brain
Jens T Rosenberg1, Samuel Colles Grant1,2, and Daniel Topgaard3
1National High Magnetic Field Laboratory, Florida State University, Tallahassee, FL, United States, 2Chemical and Biomedical Engineering, FAMU-FSU College of Engineering, Tallahassee, FL, United States, 3Physical Chemistry, Lund University, Lund, Sweden
Here we implement multidimensional diffusion-relaxation correlation methods at 21.1 T. Results are reproducible compared to lower field strengths but with reduced image quality due to increase in R2, showing the need for stronger gradient to shorten the duration of
gradient waveforms
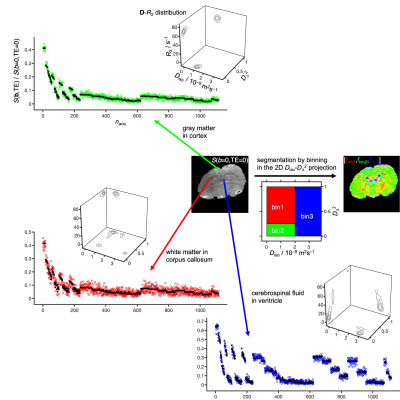
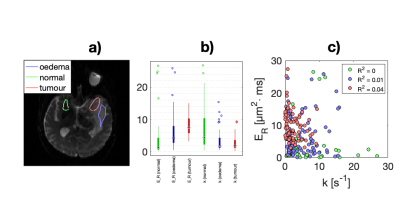
Signal S vs.
acquisition number nacq (circles: measured, points: fit) and
nonparametric D-R2 distributions for representative
voxels of an in vivo rat brain at 21.1 T. The distributions are
shown as projections onto the 2D planes Diso-DΔ2, Diso-R2,
and DΔ2-R2,
where Diso is the isotropic diffusivity, DΔ2 the squared normalized anisotropy (41), and R2 the transverse
relaxation rate. Binning in the Diso-DΔ2 plane allows calculation of nominally
tissue-specific signal fractions fbin1, fbin2,
and fbin3 and associated diffusion-relaxation metrics.
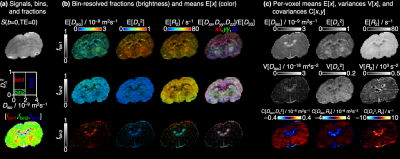
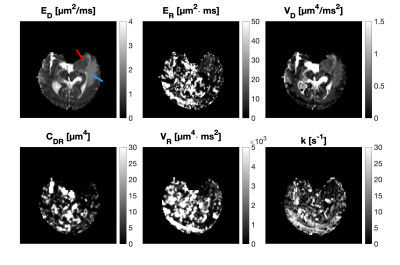
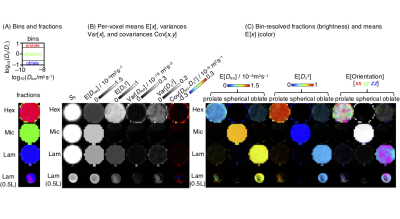
Parameter maps derived from the per-voxel D-R2
distributions. (a) Synthesized S(b=0,TE=0) image, bin
definition in the Diso-DΔ2 plane, and RGB map color-coded by the signal
fractions [fbin1,fbin2,fbin3].
(b) Bin-resolved signal fractions and means E[x] of the D-R2
metrics coded into image brightness and color (see quantitative scale bars). Direction-encoded
colors derive from the lab-frame diagonal values [Dxx,Dyy,Dzz]
and maximum eigenvalue D33. (c) Per-voxel means E[x],
variances V[x], and covariances C[x,y] of Diso,
DΔ2, and R2.
-
MR Fingerprinting with B-tensor encoding scheme for simultaneous measure of relaxation and microstructure diffusion
Maryam Afzali1, Lars Mueller1, Ken Sakaie2, Siyuan Hu3, Yong Chen4, Mark Griswold4, Derek K Jones1, and Dan Ma3
1Cardiff University Brain Research Imaging Centre (CUBRIC), School of Psychology, Cardiff University, Cardiff, United Kingdom, 2Imaging Institute, Cleveland Clinic, Cleveland, OH, United States, 3Biomedical Engineering, Case Western Reserve University, Cleveland, OH, United States, 4Radiology, Case Western Reserve University, Cleveland, OH, United States
We implement multi-dimensional MR Fingerprinting scan with linear and spherical diffusion tensor encoding to simultaneously quantify $$$T_1$$$, $$$T_2$$$ and diffusivity in a single scan .
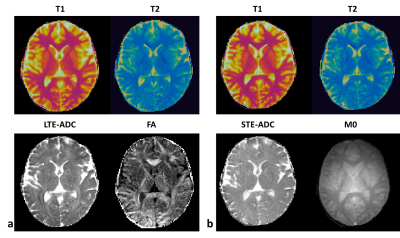
Figure 3: Estimated diffusion and relaxometry parameters. (a) $$$T_1$$$ and $$$T_2$$$ relaxation times and apparent diffusion coefficient (ADC) and fractional anisotropy (FA) from a single slice of md-MRF scan using linear tensor encoding (LTE) (b) results of md-MRF scan using spherical tensor encoding (STE). M0 shows the proton density map.
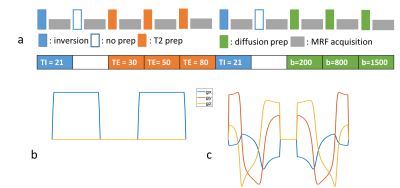
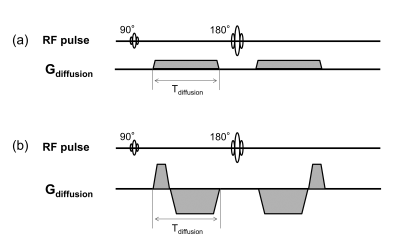
Figure 1: Sequence diagram of an acquisition unit of mdMRF scan. (a) Each acquisition unit consists of multiple inversion, $$$T_2$$$ and diffusion preparation modules with various timing and b-values. The table lists the key parameters of the modules. (b) and (c) are LTE and STE diffusion gradients used in the diffusion preparation modules.
-
Multicomponent Diffusion Analysis using L1-norm Regularized NNLS for an Accurate and Robust Detection of Alternations in Spinal Cord
Jin Gao1,2, Weiguo Li2,3, Richard Magin3, and Danilo Erricolo1,3
1Department of Electrical and Computer Engineering, University of Illinois at Chicago, Chicago, IL, United States, 2Research Resources Center, University of Illinois at Chicago, Chicago, IL, United States, 3Department of Bioengineering, University of Illinois at Chicago, Chicago, IL, United States
Multicomponent Diffusion Analysis using L1-norm Regularized NNLS for an Accurate and Robust Detection of Micro-environment Alternations in Spinal Cord of SOD1G93A Mouse Model
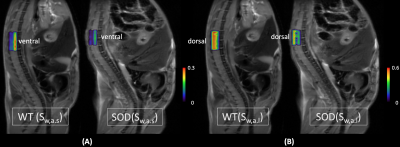
Fig. 4. maps of summed-weights: (A) in the region ‘a.s’ (Sw,a.s) ; (B) in the region ‘a.l’ (Sw,a.l)
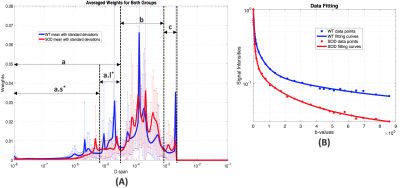
Fig. 3. animal results: (A) averaged weights with standard deviations from the L1-norm method in WT group (blue) and SOD group (red). Three regions are labeled as ‘a’, ‘b’ and ‘c’, and the region ‘a’ is divided into sub-region ‘a.s’ and ‘a.l’. The ‘*’ denotes a significant difference (P<0.05) is found in this region. (B) a representative fitting results from WT group (blue) and SOD group (red)