-
Characterizing Knee Osteoarthritis Progression with Structural Phenotypes using MRI and Deep Learning
Nikan K Namiri1, Jinhee Lee1, Bruno Astuto1, Felix Liu1, Rutwik Shah1, Sharmila Majumdar1, and Valentina Pedoia1
1Department of Radiology and Biomedical Imaging and Center for Intelligent Imaging, University of California, San Francisco, San Francisco, CA, United States
We
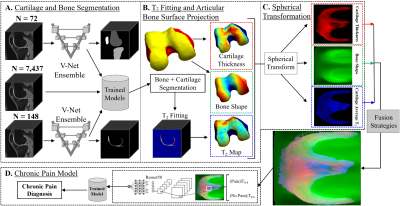
built an end-to-end deep learning model to rapidly stratify knees into morphological
phenotypes using a large, longitudinal cohort with knee OA. We examined associations
of phenotypes with the odds of having concurrent OA as well as the odds of OA progression.
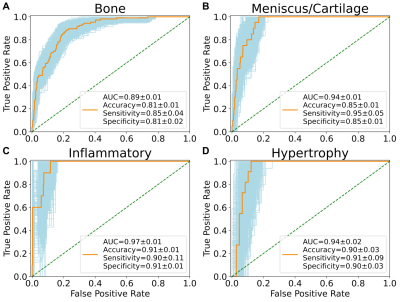
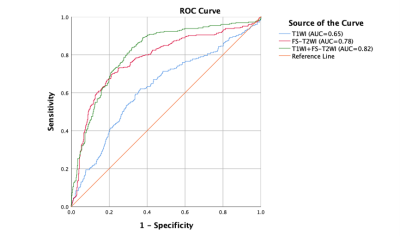
Figure 1. Receiver operating characteristic curves with
area under curve (AUC), accuracy, sensitivity, and specificity of the neural
network phenotype classifiers. Metrics reported in mean ± standard deviation.
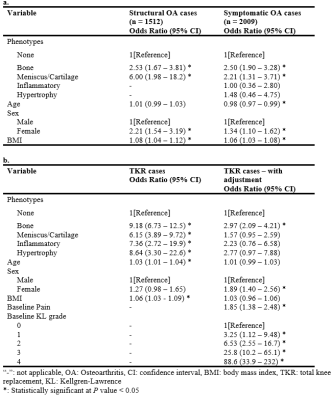
Table
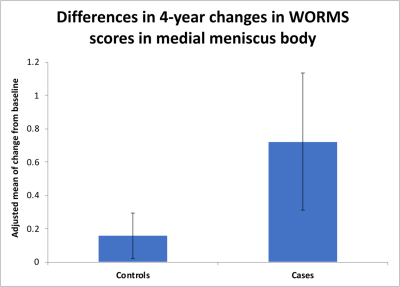
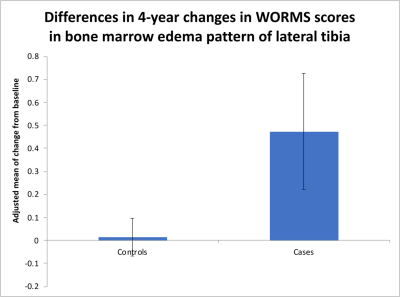
4. Association
between phenotypes and longitudinal OA outcomes. We
only considered bone and meniscus/cartilage phenotypes in structural OA
analyses because the number of baseline knees with inflammatory and hypertrophy
phenotypes who acquired structural OA at 48 months were 3 and 2, respectively.
-
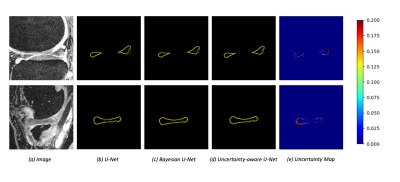
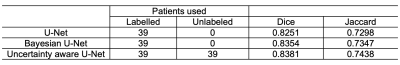
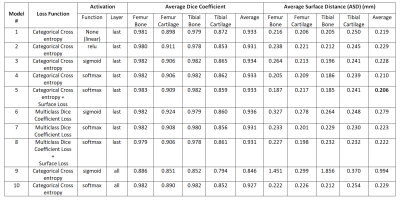
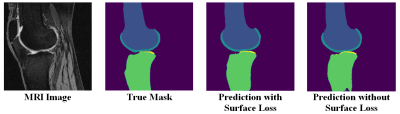
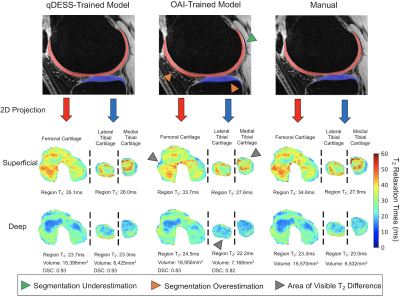
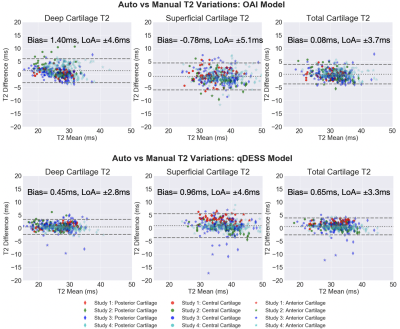
Development of Deep Learning based Cartilage Segmentation at 3D knee MRI for the use of Biomarker of Osteoarthritis
Jinwoo Han1, Suk-Joo Hong1, Zepa Yang1, Woo Young Kang1, Yoonmi Choi1, Chang Ho Kang2, Kyung-sik Ahn2, Baek Hyun Kim3, and Euddeum Shim3
1Radiology, Korea University Guro Hospital, KUGH-MIDC, Seoul, Korea, Republic of, 2Korea University Anam Hospital, Seoul, Korea, Republic of, 3Korea University Ansan Hospital, Ansan, Korea, Republic of
To
develop and evaluate automated knee joint cartilage segmentation method using modified
U-net architecture based deep-learning technique in three dimensional magnetic resonance (MR) images. To evaluate the performance, Dice similarity coefficient, and visual inspection were used.
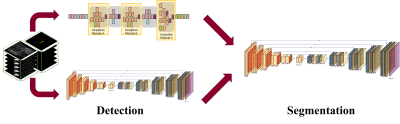
Illustration
of the deep
learning model. The process was split into two way to solve the weight-imbalance
problem and improve
efficiency of
the model.
Modified inception model and UNET was used to detect presence of knee
cartilage. In segmentation stage, ‘Modified UNET’, which means custom weight
function and additional fully-connected layer applied UNET, was used.
-
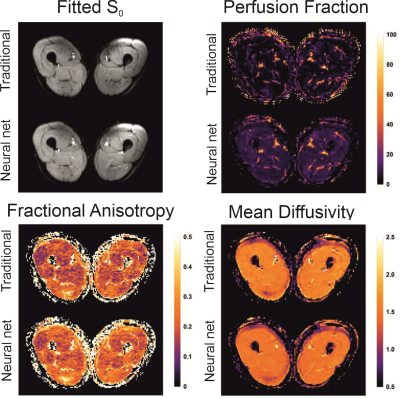
Automation of Quantifying Axonal Loss in Patients with Peripheral Neuropathies through Deep Learning Derived Muscle Fat Fraction
Yongsheng Chen1, Daniel Moiseev1, Wan Yee Kong1, Alexandar Bezanovski1, and Jun Li1,2
1Department of Neurology, Wayne State University School of Medicine, Detroit, MI, United States, 2John D. Dingell VA Medical Center, Detroit, MI, United States
The
results from the automatic segmentation well agreed with those from manual
method, which is supported by an overall dice coefficient of 0.96 ± 0.10 for
the thigh and 0.91 ± 0.12 for the calf muscles. The overall difference of fat
fraction values between the two methods were less than 1.0%.
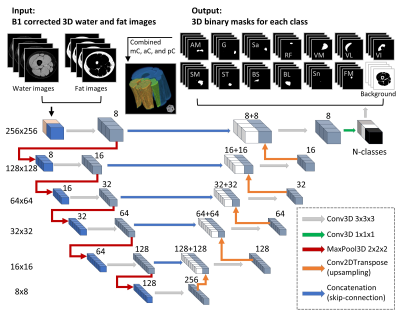
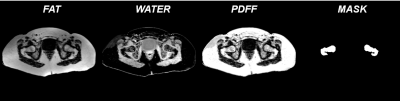
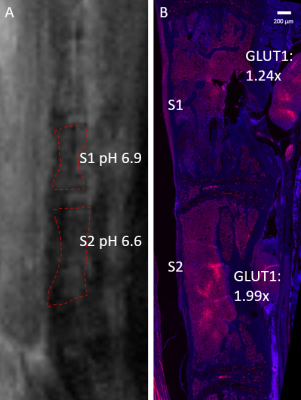
Figure 1.
Flowchart of the 3D U-Net model. Numbers on the left side denote the resolution
of the tensors, while the numbers on top of the cubes signify the number of
features. The left side of the diagram denoted the model’s contracting path.
The input-images were the 3D stacks of B1 corrected water and fat images. There
were 14 output classes for the thigh images including 11 muscles, plus sciatic
nerve, femoral marrow, and background. For the calf images, there were 13
classes including 9 muscles, plus tibial nerve, tibial marrow, fibular marrow,
and the background image.
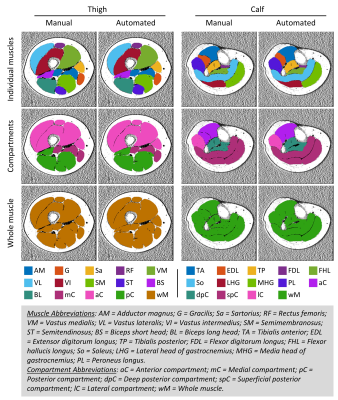
Figure
2. Representative muscle segmentation results. Images were
from data in the testing group. The individual muscles were combined to be
compartments, and then the whole muscle. Color-coded binary masks of individual
muscles, muscle compartments, and the whole muscle are overlaid onto the fat
fraction image. The same color codes for each of the muscles are used in the
results of the dice coefficient, Bland-Altman, and Pearson correlation analyses.
-
Assessment of the potential of a Deep Learning Knee Segmentation and Anomaly Detection Tool in the clinical routine
Laura Carretero1, Pablo García-Polo1, Suryanarayanan Kaushik 2, Maggie Fung2, Bruno Astuto3,4, Rutwik Shah3,4, Pablo F Damasceno3,4, Valentina Pedoia3,4, Sharmila Majumdar3,4, and Mario Padrón5
1Global Research Organization, GE Healthcare, Madrid, Spain, 2GE Healthcare, Waukesha, WI, United States, 3Department of Radiology and Biomedical Imaging, UCSF, San Francisco, CA, United States, 4Center for Digital Health Innovation, UCSF, San Francisco, CA, United States, 5Department of Radiology, Clínica Cemtro, Madrid, Spain
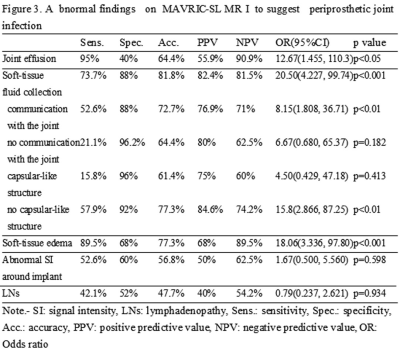
The clinical assessment of the
DL-based tool carried out by an experienced MSK radiologist, resulted in no disagreement in 92.8%
of the segmented tissues and agreement in the detection of lesions in 75.94% of them. The shown results present a step forward into structured
MSK imaging reports.
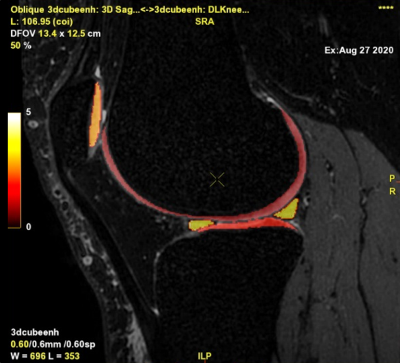
Figure 4. Segmentation
output fused over CUBE
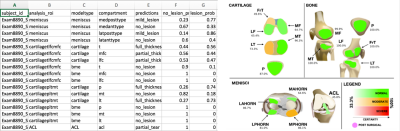
Figure 1. Output.csv and
visual representation in the pdf file
-
Differentiation of Benign and Malignant Vertebral Fractures on Spine MRI Using ResNet Deep Learning Compared to Radiologists’ Reading
Lee-Ren Yeh1, Yang Zhang2, Jeon-Hor Chen2, An-Chi Wang3, JieYu Yang3, Peter Chang2, Daniel Chow2, and Min-Ying Su2
1Radiology, E-Da Hospital, Kaohsiung, Taiwan, 2University of California Irvine, Irvine, CA, United States, 3Radiology, Chi-Mei Medical Center, Tainan, Taiwan
Deep learning using ResNet50 for differentiating
malignant from benign vertebral fracture achieved a satisfactory diagnostic
accuracy of 92%, although inferior to 98% made by a senior MSK radiologist, was
much higher compared to 66% made by a R1 resident.
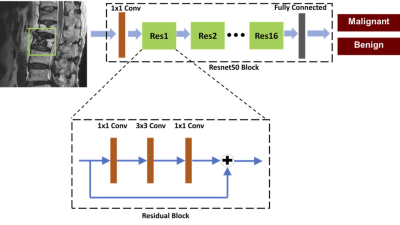
Figure 1. Architecture of
ResNet50, containing 16 residual blocks. Each residual block begins with one
1x1 convolutional layer, followed by one 3x3 convolutional layer and ends with
another 1x1 convolutional layer. The output is then added to the input via a
residual connection. The total input number is 6: T1W and T2W of the slice with
its two neighboring slices, so one convolutional layer with 1x1 filter is added
before ResNet to extract interchannel features and transform from 6 channels to
3 channels as input.
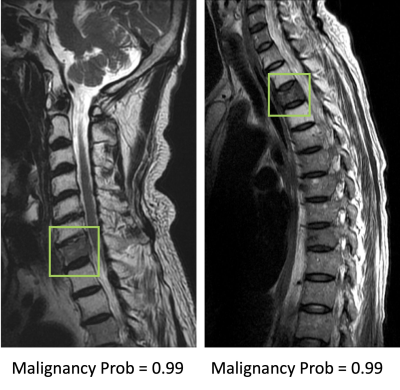
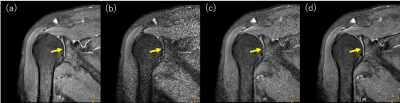
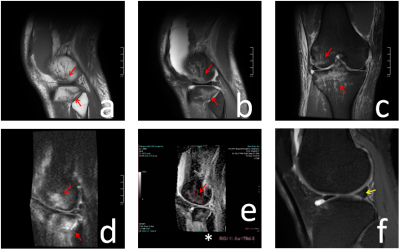
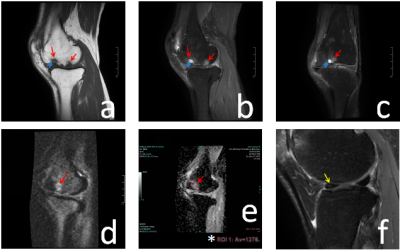
Figure 2. Two true positive
malignant cases. The image at left panel shows diffuse tumor infiltration at
the 7th cervical (C7) vertebral body with posterior cortical destruction and no
apparent collapse. The image at right panel shows diffuse tumor infiltration at
third thoracic (T3) vertebra with anterior wedge deformity. The
fatty change of other cervical vertebrae in the left panel and T2/T4 vertebrae
in right panel is post-radiation effect.
-
Synovial Fluid Suppressed 3D T1ρ Mapping of Knee Cartilage using Deep Learning
Can Wu1,2 and Qi Peng3
1Department of Medical Physics, Memorial Sloan Kettering Cancer Center, New York, NY, United States, 2Philips Healthcare, Andover, MA, United States, 3Department of Radiology, Albert Einstein College of Medicine and Montefiore Medical Center, Bronx, NY, United States
Deep learning can be used to effectively eliminate synovial fluid from
T1ρ data acquired without fluid suppression, potentially leading to improved
T1ρ quantification accuracy of knee cartilage without adding scan time.
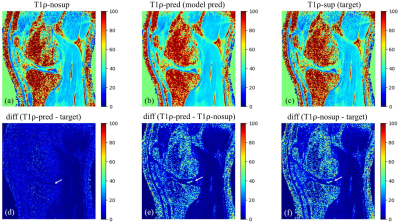
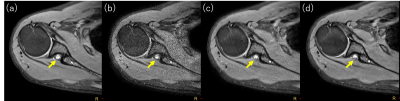
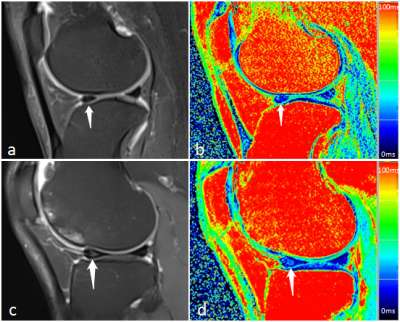
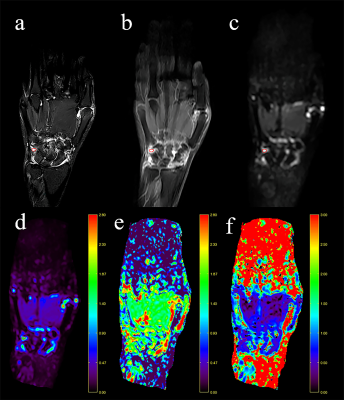
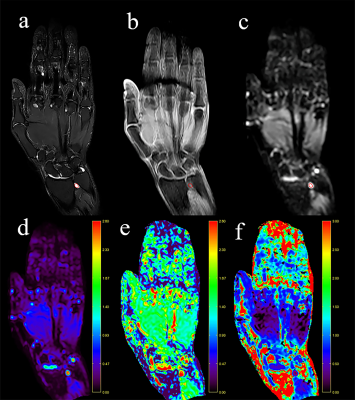
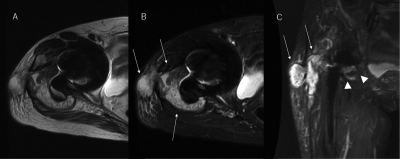
Figure 3.
Example images of T1ρ-nosup (a) and T1ρ-sup (c)
from conventional curve fitting method, along with the T1ρ map predicted by the
deep learning model (b). Synovial fluid (SF) can be easily identified near the
knee cartilage on the T1ρ-nosup image (a), while this was largely suppressed on
images of the T1ρ-sup (c) and the T1ρ-pred (b). Pairwise absolute difference
images (d-f) further illustrate that SF is selectively suppressed (white
arrows) without changing the T1ρ of the cartilage.
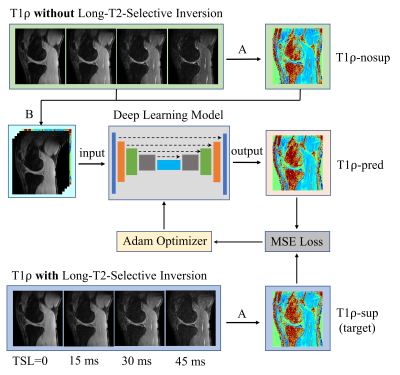
Figure 2.
Workflow for using deep learning to obtain
synovial fluid suppressed T1ρ maps from MRI scans without long-T2-selective
inversion (LT2SI). Operation A: calculation of T1ρ maps using conventional
non-linear exponential curve fitting; Operation B: stack of the T1ρ-nosup image
and the TSL source images to form a five-channel dataset as input to the deep
learning model.
-
Deep CNNs with Physical Constraints for simultaneous Multi-tissue Segmentation and Quantification (MSQ-Net) of Knee from UTE MRIs
Xing Lu1, Yajun Ma1, Saeed Jerban1, Hyungseok Jang1, Yanping Xue1, Xiaodong Zhang1, Mei Wu1, Amilcare Gentili1,2, Chun-nan Hsu3, Eric Y Chang1,2, and Jiang Du1
1Department of Radiology, University of California, San Diego, San Diego, CA, United States, 2Radiology Service, Veterans Affairs San Diego Healthcare System, San Diego, CA, United States, 3Department of Neurosciences, University of California, San Diego, San Diego, CA, United States
Towards simultaneous
segmentation and quantification analysis on multi-tissue of the knee, DCNNs of MSQ-Net and MSQ-Net with physical constraint(pcMSQ-Net) were proposed and testified its feasibility in this study. The results show promising results for both networks.
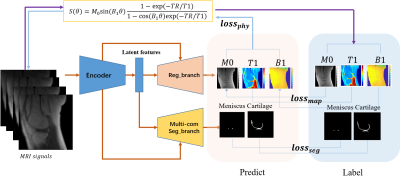
Figure
1. Network architecture of MSQ-Net and pcMSQ-Net. MSQ-Net with lossphy
to feed back the maps predicted from the model to the input MRI signals,
according to equation (6), named physical constraint MSQ-Net (pcMSQ-Net).
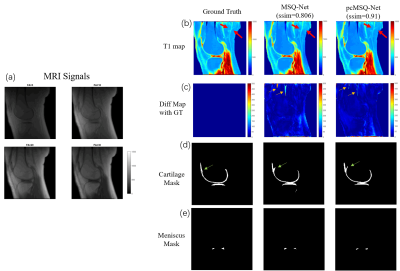
Figure 2. Typical results for MSQ-Net and pcMSQ-Net.(a)
MRI input signals with different Flip Angles(FAs); (b). T1 maps of GT, and
predicted by MSQ-Net, pcMSQ-Net; (c). Difference map from GT. Yellow arrows
demonstrates obvious errors could be found in MSQ-Net in some low-signal area
while not shown in pcMSQ-Net. (d) and (e), masks of cartilage and meniscus
of GT, and predicted by MSQ-Net and pcMSQ-Net.
-
Deep-Learning Based Image Reconstruction for Lumbar Spine MRI at 3T: Clinical Feasibility
Emma Bahroos1, Misung Han1, Cynthia Chin1, David Shin2, Javier Villanueva-Meyer1, Thomas Link1, Valentina Pedoia1, and Sharmila Majumdar1
1Radiology and Biomedical Imaging, University of California San Francisco, San Francisco, CA, United States, 2Applications and Workflow, GE Healthcare, Menlo Park, CA, United States
Our results show that scan times can be cut in half using a reduced NEX protocol and loss of SNR can be recovered by a DL image reconstruction algorithm, without a severe degradation in the ability to discern anatomical structures. A potential tool for faster imaging in patients with severe LBP.
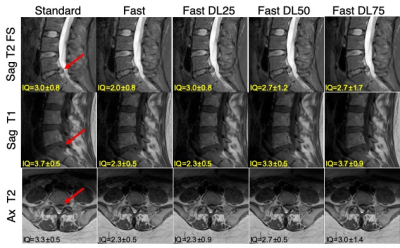
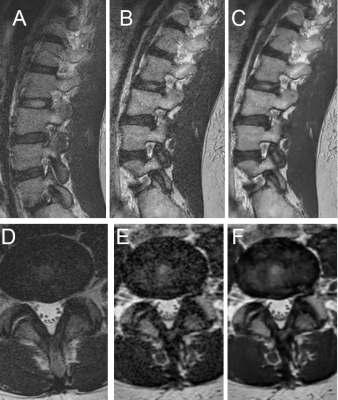
Figure 2: Comparing images from the standard and fast acquisitions and DL-reconstructed images (Standard, Fast, Fast DL25, Fast DL50, Fast DL75 images). The mean scores from the three radiologists for the ‘overall image quality’ is stated on each image. Large disc protrusion is depicted with the arrow on each sequence.
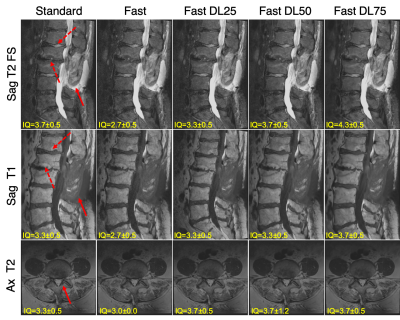
Figure 1: Comparing images from the standard and fast acquisitions and DL-reconstructed images (Standard, Fast, Fast DL25, Fast DL50, Fast DL75 images). The mean scores from the three radiologists for the ‘overall image quality’ is stated on each image. Changes in multiple vertebral bone marrow can be seen on sagittal images (depicted by solid and dashed arrows, respectively), and facet hypertrophy (depicted by an arrow) on axial images.
-
Less is more: zero-shot detection and transfer learning for facet arthropathy localization and classification on lumbar spine MRIs
Upasana Upadhyay Bharadwaj1, Cynthia T Chin1, Valentina Pedoia1, and Sharmila Majumdar1
1Radiology, University of California, San Francisco, San Francisco, CA, United States
This study presents classification of facet arthropathy from MRI using zero-shot facet detection followed by binary classification. Our model achieves an AUC of 0.916 with sensitivity and specificity of 97.8% and 64.1%, respectively and can potentially enhance the clinical workflow.
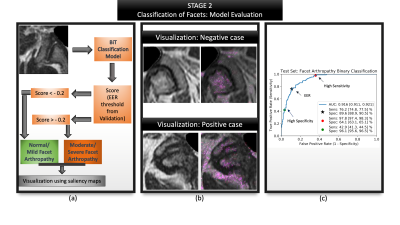
Figure 5: Summarizes the evaluation of second stage: facet classification. (a) Visualizes the entire evaluation pipeline where a patch is passed as input (b) Visualization of the model's predictions via saliency maps shows clinically valuable features being highlighted- image above highlights the superior articular portion of the facet as well as the ligamentum flavum; image below highlights the superior and inferior portions of the facet, synovium; (c) ROC curve highlighting AUC, sensitivity and specificity at various operating points along with their confidence intervals.
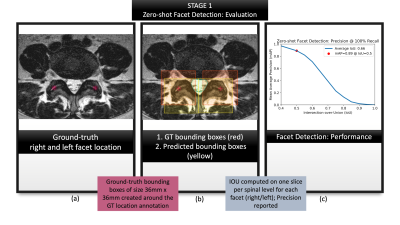
Figure 3: Summarizes the evaluation of first
stage: zero-shot facet detection. (a) visualizes location coordinates annotated
on the T2-w axial slices by a neuroradiologist. These location coordinates were
used purely for evaluating our localization, and not for training our models;
(b) visualizes ground-truth bounding boxes generated from the location
coordinates in (a) shown in red against predicted bounding boxes from zero-shot
detection, shown in yellow.; (c) characterizes the performance with a mAP-IoU
graph.
-
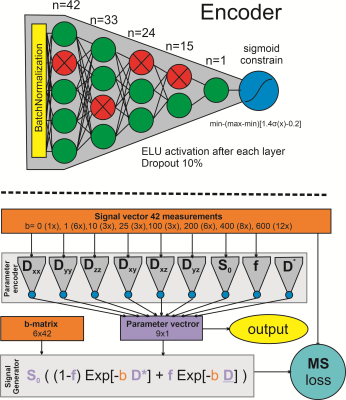
DEMO: Deep MR Parametric Mapping using Unsupervised Multi-tasking Framework
Jing Cheng1, Yuanyuan Liu1, Xin Liu1, Hairong Zheng1, Yanjie Zhu1, and Dong Liang1
1Shenzhen Institutes of Advanced Technology, Chinese Academy of Sciences, Shenzhen, China
We
propose a novel deep learning-based framework DEMO for fast and robust MR
parametric mapping. A CS-based loss function is used in DEMO to avoid the necessity of using fully
sampled k-space data as the label, and thus make it an unsupervised learning
approach.
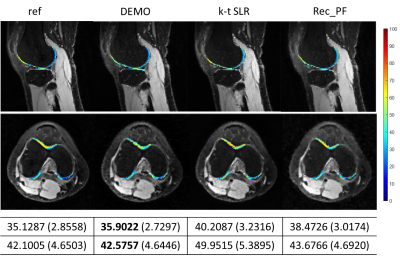
Fig. 4.
The estimated parameter maps for selected cartilage ROIs on
the reconstructed -weighted images at
TSL = 5 ms for R = 5.2. The reference image and the corresponding parameter maps were obtained from the fully
sampled k-space data. The mean values and the standard deviations of the
ROI maps are also provided.
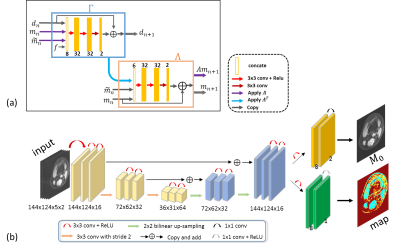
Fig.
2. The architectures of the networks used in DEMO. (a) the n-th
iteration block in Recon-net. (b) the Mapping-net to generate parametric map.
-
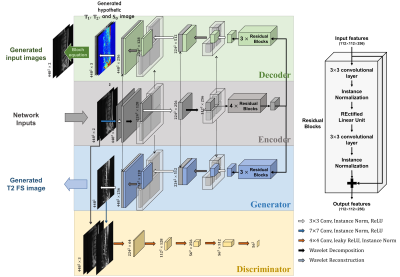
MRI image synthesis with a conditional generative adversarial network using patch pooling
Bragi Sveinsson1,2 and Matthew S Rosen1,2,3
1Martinos Center, Massachusetts General Hospital, Boston, MA, United States, 2Harvard Medical School, Boston, MA, United States, 3Physics, Harvard University, Cambridge, MA, United States
Contrast synthesis with a cGAN analyzing image patches of multiple sizes can outperform a conventional network using single patch sizes.
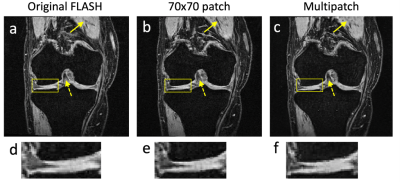
Figure 3: (a) A ground truth FLASH image. (b) An image constructed from DESS and TSE scans to synthesize the image in panel a. The network looked at single patch sizes of 70×70 pixels to determine if the image was real or generated. (c) An image constructed by using a multi-patch discriminator as shown in Figure 1. The single-patch discriminator in panel b creates new structures (solid arrow) and loses contrast (dashed arrow) compared to the multipatch discriminator in panel c. The undesirable creation of new structure is also shown in the zoomed-in panels (d)-(f).
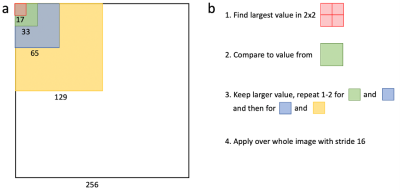
Figure 1: (a) The presented network uses a discriminator that examines different sized patches of an image to determine if they display real or generated data. The patch sizes are designed so that a 2×2 matrix of one patch size (with an overlap of one pixel) has the same size as the next largest patch. (b) The largest discriminator value in such a 2×2 matrix is selected and compared to the corresponding next largest patch. The larger value from that comparison is stored for that region and the process then repeated for the next patch size. This is applied over the whole image, using a stride of 16.
-
Self-Supervised Deep Learning for Knee MRI Segmentation using Limited Labeled Training Datasets
Jeffrey Dominic1, Arjun Desai1, Andrew Schmidt1, Elka Rubin1, Garry Gold1, Brian Hargreaves1, and Akshay Chaudhari1
1Stanford University, Stanford, CA, United States
Self-supervised learning can leverage unlabeled images to improve deep learning segmentation performance in scenarios with limited labeled training data, especially for tissues facing class imbalance challenges and low prevalence.
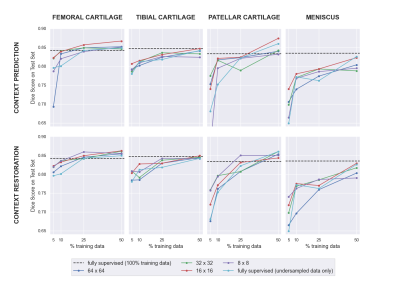
Figure 2: A summary of the downstream performance of the SSL networks with both pretext tasks (context prediction and restoration). In most data-limited scenarios, SSL pre-training improved results compared to only supervised training on the same data. The impact of SSL was larger for smaller tissues such as the patellar cartilage and meniscus. Smaller patches also provided improved performance.
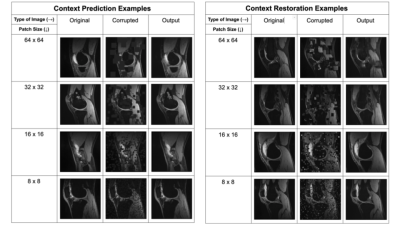
Figure 1: Examples of image corruptions for context prediction and context restoration for different patch sizes, and the inpainting network’s predictions given the corrupted images as input.
-
Deep Learning Improves Detection of Anterior Cruciate Ligament- and Meniscus Tear Detection in Knee MRI
Firas Khader1, Gustav Müller-Franzes1, Johannes Stegmaier2, Martin Pixberg3, Jonas Müller-Hübenthal3, Christiane Kuhl 1, Sven Nebelung4, and Daniel Truhn1
1Department of Diagnostic and Interventional Radiology, Aachen University Hospital, Aachen, Germany, 2Institute of Imaging and Computer Vision, RWTH Aachen University, Aachen, Germany, 3Praxis im Köln Triangle, Cologne, Germany, 4Department of Diagnostic and Interventional Radiology, Düsseldorf University Hospital, Dusseldorf, Germany
Comparing the performance of neural networks to detect ACL and meniscus tears on a knee MRI dataset comprised of 3887 manually annotated exams show that the neural networks do not benefit from expert annotations by board-certified radiologists.
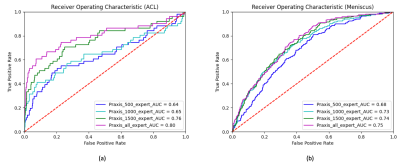
Figure 1. Comparison of the Receiver Operating Characteristic (ROC) curves for varying numbers of training samples, i.e. n=500 (blue), n=1000 (turquoise), n=1500 (green), and n=2493 training samples (purple) in algorithm-based detection of ACL (a) and meniscus tears (b). For the detection of the ACL tears, the area under curve (AUC) increased from 0.64 (n=500) to 0.80 (n=2493). For the detection of meniscus tears, the AUC increased from 0.68 (n=500) to 0.75 (n=2493).
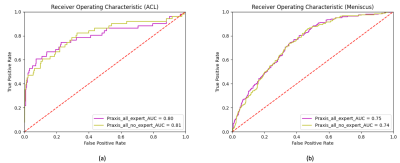
Figure 2. Receiver Operating Characteristic (ROC) curves and corresponding area under curve (AUC) for the test set depicting the difference in performance when training the neural network with expert (purple) vs non-expert (yellow) annotations. Neither in the case of ACL tears (a) nor in the case of meniscus tears (b) does the network benefit from the additional expert annotations by a board-certified radiologist.
-
Fully automatic detection and voxel-wise mapping of vertebral body Modic changes using deep convolutional neural networks
Kenneth T Gao1,2,3, Radhika Tibrewala1,2, Madeline Hess1,2, Upasana Bharadwaj1,2, Gaurav Inamdar1,2, Cynthia T Chin1, Valentina Pedoia1,2, and Sharmila Majumdar1,2
1Department of Radiology and Biomedical Imaging, University of California, San Francisco, San Francisco, CA, United States, 2Center for Intelligent Imaging, Department of Radiology and Biomedical Imaging, University of California, San Francisco, San Francisco, CA, United States, 3University of California, Berkeley-University of California San Francisco Graduate Program in Bioengineering, San Francisco, CA, United States
Vertebral Modic changes are strongly linked to low back pain. We present a deep learning approach that detects Modic changes with 85.7% identification rate and performs voxel-wise mapping to visualize local, granular pathologies.
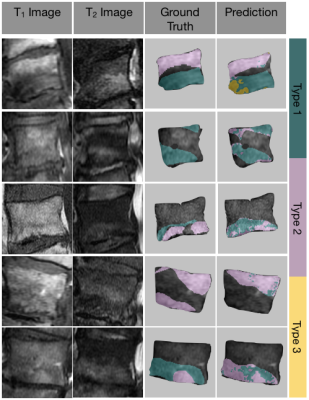
Fig. 5. Representative examples of the model inputs (T1 and T2 images), radiologist-annotated ground truth segmentations, and the predicted Modic maps. The mapping technique is advantageous for visualizing heterogeneity and transitional pathology.
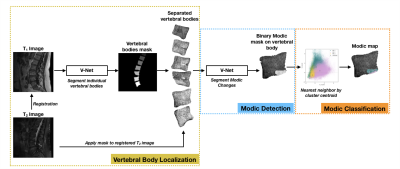
Fig. 1. Schematic of the full Modic mapping approach. Vertebral bodies are first segmented and extracted from T1-weighted MRI, allowing extraction of the bodies on the T1 and registered T2 images. Next, a binary segmentation network localizes and detects regions of Modic changes. Lastly, each voxel of the detected regions is classified to a Modic type using a nearest neighbor algorithm and T1 and T2 z-scores to form a Modic map.
-
Towards Clinical Translation of Fully Automatic Segmentation and 3D Biomarker Extraction of Lumbar Spine MRI
Madeline Hess1, Kenneth Gao1, Radhika Tibrewala1, Gaurav Inamdar1, Upasana Bharadwaj1, Cynthia Chin1, Valentina Pedoia1, and Sharmila Majumdar1
1Center for Intelligent Imaging, University of California, San Francisco, San Francisco, CA, United States
We present a deep learning-based pipeline to automatically segment the vertebral bodies, intervertebral discs, and paraspinal muscles in the lumbar spine. Using this method, we accurately and automatically extract disc height, muscle CSA, and centroid position for each structure.
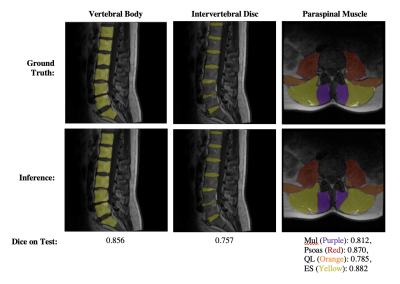
Figure 1: Visualization of segmentation results from each Network.
The first, second and third columns show examples of vertebral body, intervertebral disc, and paraspinal muscle segmentation results, respectively.
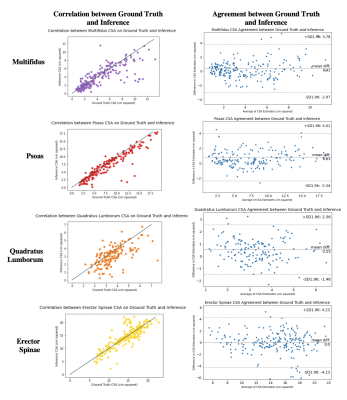
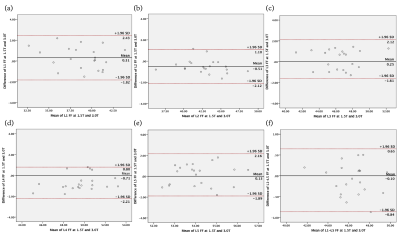
Figure 3: Correlation (left column) and agreement (right column) between muscle CSA from manual versus inferred segmentations on each paraspinal muscle.
Agreement is displayed using Bland-Altman plots for CSA on each disc. Correlation between CSA from manual versus inferred muscle segmentations is displayed using a scatter plot, where the line x=y is indicated in grey and each point is the CSA calculated on each respective muscle (both left and right) on each slice in each patient.
-
A pipeline combining deep learning and radiomics to automatically identify chronic lateral ankle instability from FS-PD MRI
Yibo Dan1, Hongyue Tao2, Chengxiu Zhang1, Chenglong Wang1, Yida Wang1, Shuang Chen2, and Guang Yang1
1Shanghai Key Laboratory of Magnetic Resonance, East China Normal University, shanghai, China, 2Department of Radiology, Huashan Hospital, Fudan University, shanghai, China
A pipeline was built to automatically
segment cartilage and subchondral bone regions from FS-PD MRI images and use
the features extracted from those regions to identify chronical ankle joint
instability.
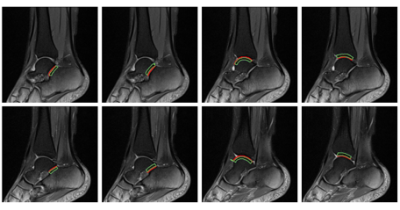
Figure 2: The results of automatic
segmentation. The red contours are the cartilage regions and the green lines
are the subchondral bone regions.
(a)the lateral calcaneal surface of the subtalar joint,
(b)the lateral talar surface of the subtalar joint,
(c)the lateral talar surface of the tibiotalar joint,
(d)the lateral tibial surface of the tibiotalar joint.
(e)the medial calcaneal surface of the subtalar
joint,
(f)the medial talar surface of the subtalar joint,
(g)the medial talar
surface of the tibiotalar joint,
(h)the medial tibial surface of tibiotalar joint.
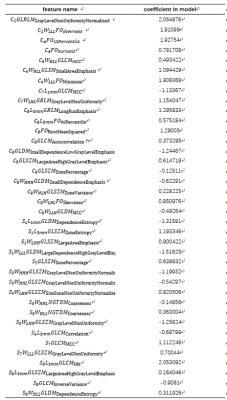
Table 1:Selected features and their
corresponding coefficients in the final model. C1-C8 represent eight cartilage
ROIs, S1-S8 represent eight subchondral bone 5mm ROIs, W denotes wavelet
transform, L denotes Laplacian of Gaussian filtered.
-
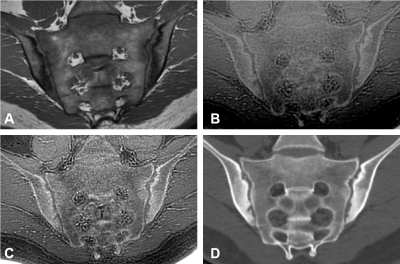
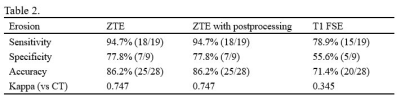
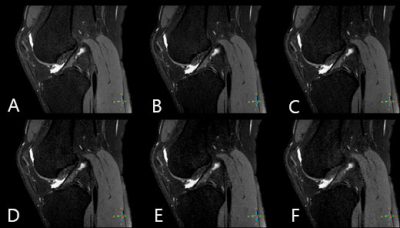
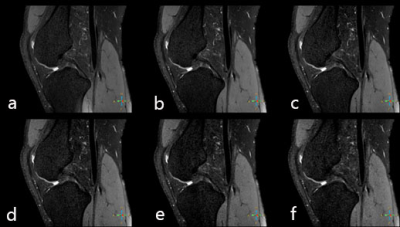
Deep Learning Reconstruction of 3D Zero Echo Time Magnetic Resonance Images for the Creation of 3D Printed Anatomic Models
Nicole Wake1,2, Stephanie Shamir1, Beverly Thornhill1, Nogah Haramati1, Graeme McKinnon3, Mathias Engstrom4, Florian Wiesinger4, Michael Carl5, Fraser Robb6, and Maggie Fung7
1Department of Radiology, Montefiore Medical Center, Bronx, NY, United States, 2Center for Advanced Imaging Innovation and Research, Department of Radiology, NYU Langone Health, New York, NY, United States, 3GE Healthcare, Waukesha, WI, United States, 4GE Healthcare, Munich, Germany, 5GE Healthcare, San Diego, CA, United States, 6GE Healthcare, Aurora, OH, United States, 7GE Healthcare, New York, NY, United States
Deep learning reconstruction of 3D ZTE MRI datsets significantly improved image quality and enabled improved automated image segmentation for the creation of 3D printed anatomic models.
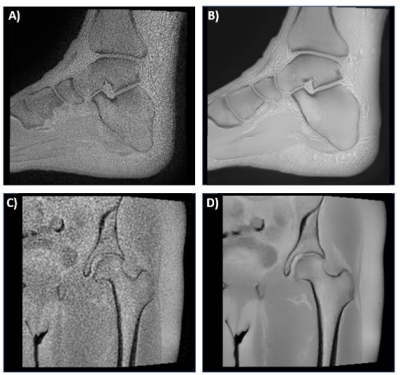
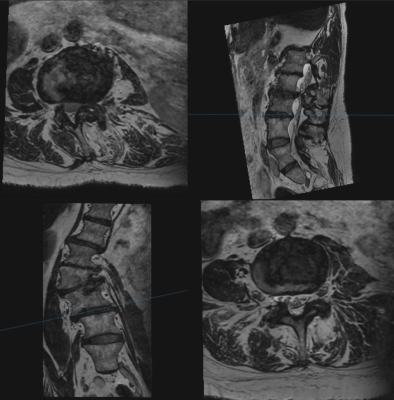
Figure 1 3D ZTE images of the A) ankle without deep learning B) ankle with deep learning, C) hip without deep learning, and D) hip with deep learning.
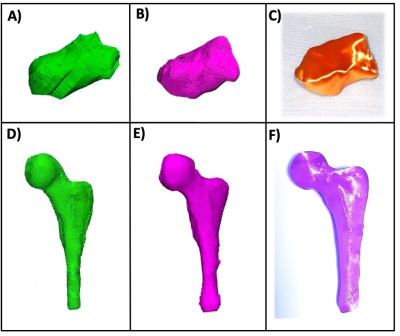
Figure 3 3D modeling of segmented anatomy showing the A) calcaneus without deep learning, B) calcaneus with deep learning C) 3D printed calcaneus model; and the D) femur without deep learning, E) femur with deep learning, and F) 3D printed femur model. Both 3D printed models were printed using the deep learning reconstruction on a material extrusion printer (Ultimaker S5, Ultimaker, Utrecht, Netherlands).
-
Identification of Bone Marrow Lesions on Magnetic Resonance Imaging with Weakly Supervised Deep Learning
Jiaping Hu1, Zhao Wang2, Lijie Zhong1, Keyan Yu1, Yanjun Chen1, Yingjie Mei3, Qi Dou4, and Xiaodong Zhang1
1Department of Medical Imaging, The Third Affiliated Hospital of Southern Medical University, Guangzhou, China, 2College of Information Science and Electronic Engineering, Zhejiang University, Hangzhou, China, 3China International Center, Philips Healthcare, Guangzhou, China, 4Department of Computer Science & Engineering, The Chinese University of Hong Kong, Hong Kong, China
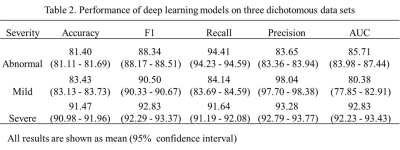
The
deep learning-based dichotomous model performed can recognize the presence of
BMLs accurately and initially assess of severity, making it meaningful to be a rapid
detector of BMLs for associated research.
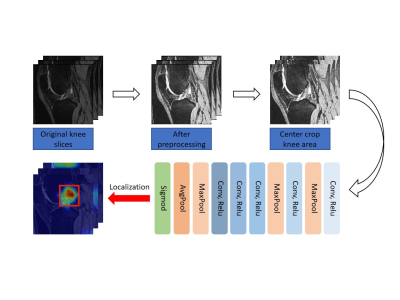
Figure 1. Overview
of the proposed BML lesion identification deep learning model trained with
patient-level weak labels.
-
Retrospective Contrast Tuning from a Single T1-weighted Image Using Deep Learning
Yan Wu1, Yajun Ma2, Jiang Du2, and Lei Xing1
1Stanford University, Palo Alto, CA, United States, 2University of California San Diego, San Diego, CA, United States
MR contrast can be retrospectively tuned
from a single T1-weighted image by combining deep learning-based quantitative parametric
mapping with Bloch
equations. High accuracy has been achieved in knee
MRI.
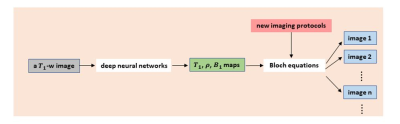
Scheme of retrospective tuning. From a single T1-weighted
image, tissue relaxation parametric maps (T1 map, proton density map, and B1
map) can be predicted using deep neural networks; which are subsequently used
to calculate signal intensity of other images (corresponding to different
imaging protocols) via the application of Bloch equations.
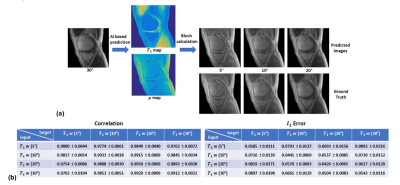
Retrospective tuning of tissue contrast in MRI. (a)
Given a single T1-weighted image acquired at 30°, images presumably acquired at
5°, 10°, and 20° are predicted and compared with the ground truth images, where
high image fidelity is achieved in the predicted images. (B) Quantitative
evaluation of variable contrast image predictions. Low L1 error (between 0.04
and 0.09) and high correlation coefficients (ranging from 0.97 to 0.99) are
consistently achieved.
-
Feasibility of Femoral Cartilage Lesion Classification on Clinical MRIs using Deep Learning
Mingrui Yang1, Ceylan Colak1, Mercan Aslan1, Sibaji Gaj1, Morgan Jones1, Carl Winalski1, Naveen Subhas1, and Xiaojuan Li1
1Cleveland Clinic, Cleveland, OH, United States
We found this a promising pipeline for femoral cartilage lesion classification in heterogeneous clinical MR images. It can provide aids to clinical routines for improved patient treatment and management plans.
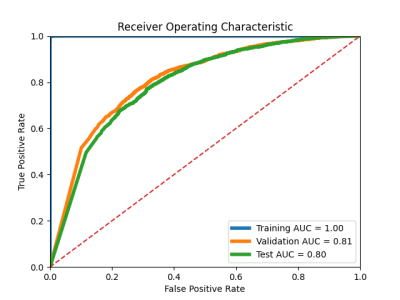
Figure 2. ROC curves with AUCs for training, validation and test respectively.
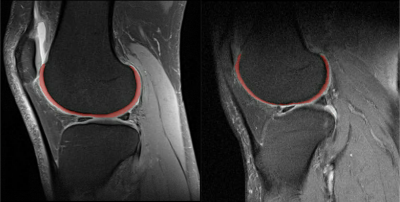
Figure 1. Sample femoral cartilage segmented sagittal fat-saturated proton density weight clinical MR images.