-
Cerebellar changes in Spinocerebellar Ataxia Type 2 and 12 in comparison with healthy controls
Pankaj pankaj1, S Senthil Kumaran1, and Achal Kumar Srivastava2
1NMR, All India Institute of Medical Sciences, New Delhi, India, 2Neurology, All India Institute of Medical Sciences, New Delhi, India
White and grey matter atrophy in SCA2 with respect to SCA12, and bilateral cerebellar atrophy in SCA in comparison with healthy controls correlate with tremor and gait abnormality.
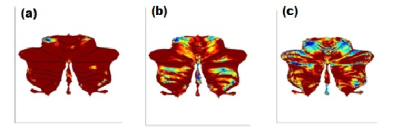
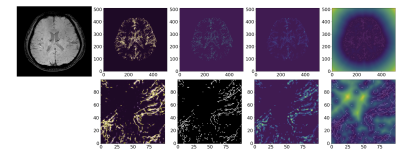
Figure 1: Cerebellum atrophy in
comparison of(a) HC and SCA2 (b)HC and SCA12 (c) SCA2 and SCA12 at the significant level of p<0.001, uncorrected (t-test) displayed on SUIT
Flatmapview(color map: jet and threshold 0:0.1)
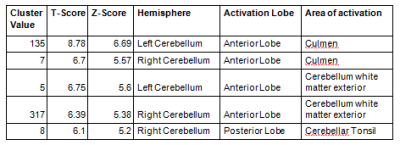
Table 1. Significant difference in the white matter
between SCA2 and SCA12 (analysis using SUIT, one way ANOVA, p<0.05 FWE,
voxel threshold (k)≥5)
-
Cerebro-cerebellar impact on brain dynamics in a single-subject with cerebellar ataxia
Silvia Maria Marchese1, Fulvia Palesi2,3, Mariagrazia Bruzzone4, Anna Nigri4, Stefano D'Arrigo5, Chiara Pantaleoni5, Claudia AM Gandini Wheeler-Kingshott2,3,6, Egidio D'Angelo2,3, and Paolo Cavallari1
1Human Physiology Section of the DePT, Università degli Studi di Milano, Milano, Italy, 2Department of Brain and Behavioral Science, Università degli Studi di Pavia, Pavia, Italy, 3Brain Connectivity Center Research Department, IRCCS Mondino Foundation, Pavia, Italy, 4Neuroradiology Department, Fondazione IRCCS Istituto Neurologico "C. Besta", Milano, Italy, 5Developmental Neurology Department, Fondazione IRCCS Istituto Neurologico "C. Besta", Milano, Italy, 6Department of Neuroinflammation, UCL Queen Square Institute of Neurology, Faculty of Brain Sciences, University College London, NMR Research Unit, Queen Square MS Centre, London, United Kingdom
Brain dynamics simulated in a subject with Joubert syndrome highlighted the impact of excluding cerebellum from brain network in cerebellar dysfunction. Pearson correlation coefficient is strongly decreased when cerebro-cerebellar connectivity is excluded from the simulation.
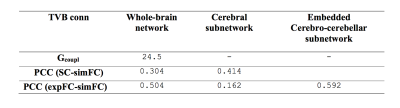
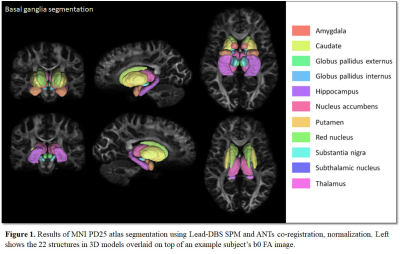
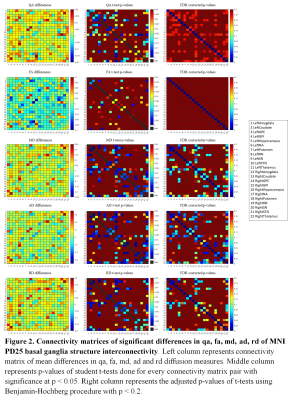
Table 1: Parameters forwhole-brain network, cerebral subnetwork and embedded cerebro-cerebellar subnetwork.Optimal value for global coupling (Gcoupl) and Pearson correlation coefficients (PCC) between structural connectivity (SC), experimental (expFC) and simulated functional connectivity (simFC) are reported.
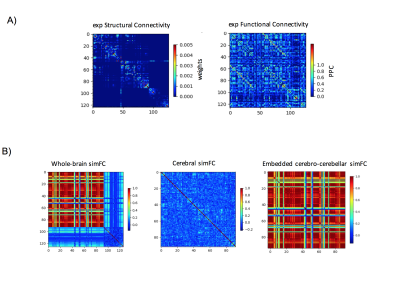
Figure 1: A) Experimental matrices of structural connectivity (expSC) and functional connectivity (expFC) in the patient with Joubert syndrome. B) Simulated functional connectivity (simFC) matrices for whole-brain network (left), cerebral subnetwork (center) and embedded cerebro-cerebellar subnetwork (right). In each matrix, rows and columns represent a specific brain region (node), while each intersection point represents a connection, weighted by the number of streamlines, between two nodes (edge).
-
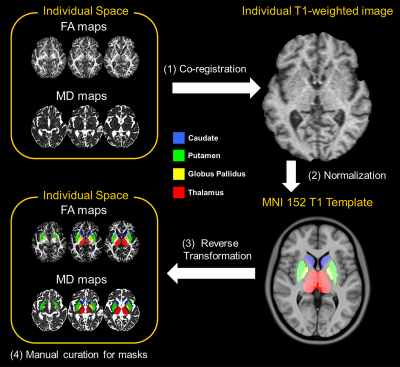
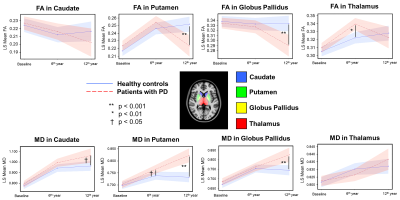
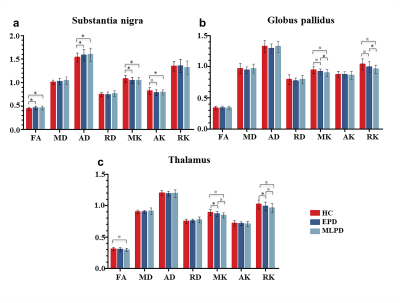
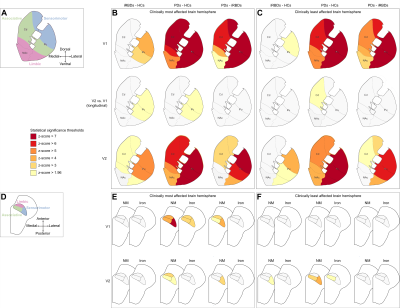
Genetic impacts on nigral iron deposition in Parkinson’s disease
Jing jing Wu1, Xiao jun Guan2, Tao Guo2, Cheng Zhou2, Ting Gao3, Xue qin Bai2, Xiao cao Liu3, Lu yan Gu3, Pei yu Huang3, Xiao jun Xu3, and Min ming Zhang2
1Department of Radiology, The Second Affiliated Hospital, Zhejiang University School of Medicine, HangZhou, China, 2Department of Radiology, The Second Affiliated Hospital, Zhejiang University School of Medicine, Hangzhou, China, 3The Second Affiliated Hospital, Zhejiang University School of Medicine, Hangzhou, China
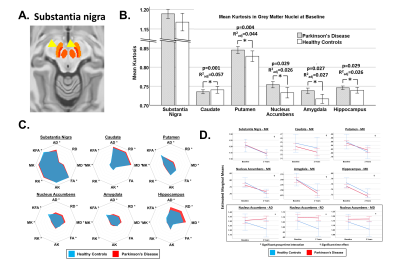
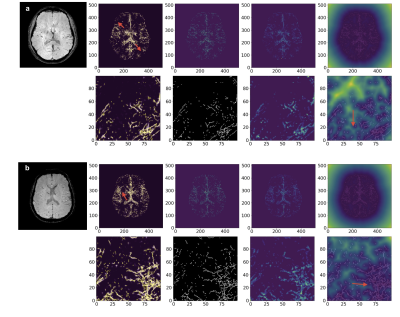
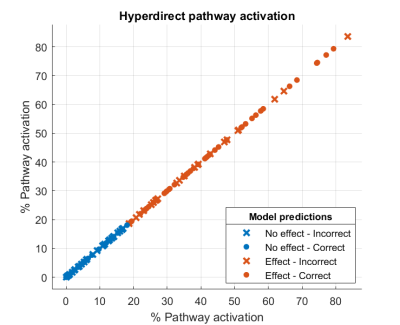
Two variants, rs602201 and rs198440, were found to have a positive impact on nigral iron deposition in PD. Specifically,
patients with rs602201 polymorphism are particularly vulnerable to iron
deposition in SN.
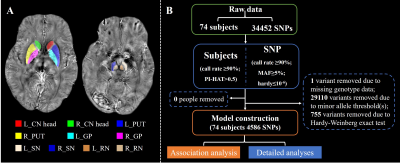
Figure 1 Data processing procedures.
A. The labels of subcortical nuclei in processed QSM images.
B. The framework of quality control steps.
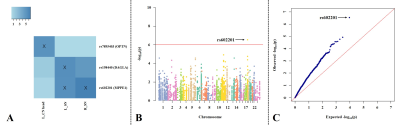
Figure 2 The association between genetic
variations and imaging phenotypes.
A. Heat map with significant associations between SNP and QT at p<10-5
(blocks labeled with “X”). Color key on the top left coded the magnitude of
-log10(p-values).
B, C. Manhattan and Q-Q plot of the most
significant association (p<10-6) (rs602201-R_SN). The horizontal
line displayed the cutoff for p<10-6. Shown on (C) is the Q-Q
plot of the distribution of the observed p-values (-log10(observed
p-value)) versus the expected p-values (-log10(expected p-value))
under the null hypothesis of no association.
-
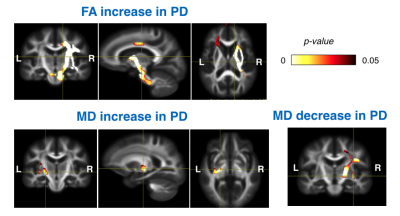
The presumed structure alterations of Spinocerebellar Ataxias 3: from presymptomatic to the symptomatic stage
Haishan Qiu1, Jing Zhao1, Manshi Hu1, Mengzhu Wang2, and Jianping Chu1
1Sun Yat-sen University, Guangzhou, China, 2Simens Healthcare, Guangzhou, China
43
gene confirmed SCA3 patients, including 37 symptomatic and 15 presymptomatic,
and 35 health controls were prospectively included, and VBM and TBSS were used to
investigate the differences of GM and WM. Our study
indicates that there is an evolving history of structural images with SCA3
patients in different disease stages. The WM damage starts with the impairment
of ICP and goes through SCP extends to the midbrain, then widespread to the
whole brain. The alteration of GMV does not occur until the arise of ataxia
symptom, then began to involve the medulla, cerebellum, and pons, and developed
to involve basal ganglion, after the decompensation of bilateral dorsal
thalamus, finally affect the cortical cortex. The impairment of WM tracts
precedes the GM atrophy and, irrespective of the patients with or without
clinical manifestation, the identified WM damage was significantly correlated
with SARA.
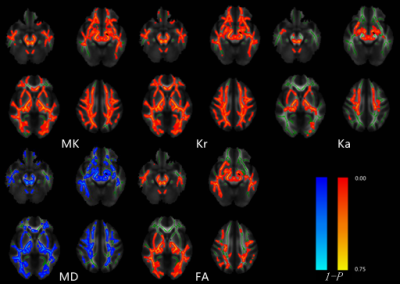
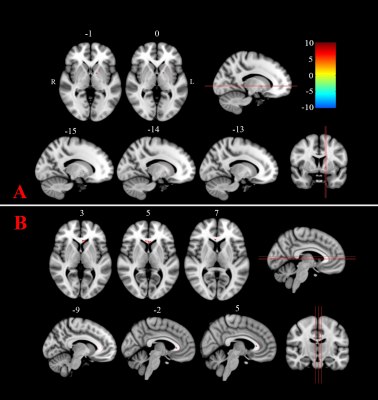
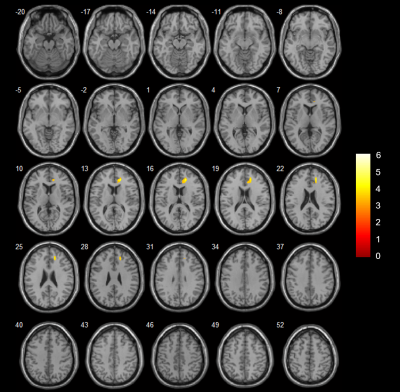
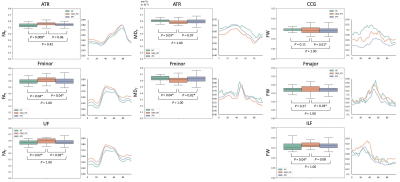
Tract-based statistical analysis of DKT/DTI
metrics between symptomatic SCA3 patients and health controls.
Red-yellow highlights show areas of decreased DKI/DTI metrics values in symptomatic SCA3. Blue highlights show areas of increased MD value in symptomatic SCA3.(P<0.05, TFCE correction)
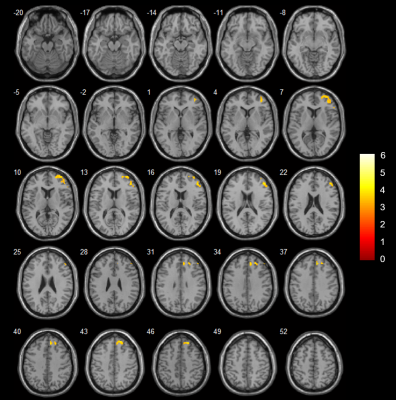
Tract-based statistical analysis of DKT/DTI
metrics between symptomatic SCA3 patients and health controls.
Red-yellow highlights show areas of decreased DKI/DTI metrics values in symptomatic SCA3. Blue highlights show areas of increased MD value in symptomatic SCA3.(P<0.05, TFCE correction)
-
Volumetric estimation of various brain parts in Gluten Ataxia patients: A quantitative MRI study
Uma Sharma1, Vishwa Rawat1, Prasenjit Das 2, Achal Kumar Srivastava3, and Govind Makharia4
1Nuclear Magnetic Resonance and MRI Facility, All India Institute of Medical Sciences, New Delhi, India, 2Pathology, All India Institute of Medical Sciences, New Delhi, India, 3Neurology, All India Institute of Medical Sciences, New Delhi, India, 4Gasteroenterology and Human Nutrition, All India Institute of Medical Sciences, New Delhi, India
Volumetric analysis of
whole brain in gluten ataxia (GA) patients using MRI revealed significantly low brain and cerebellar
volumes along the lobules which form part of vermis while cerebrum volume is
not linked to GA.
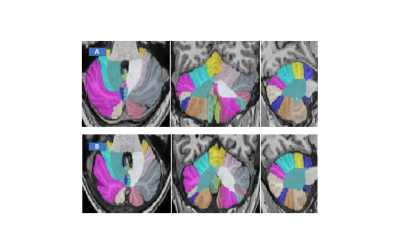
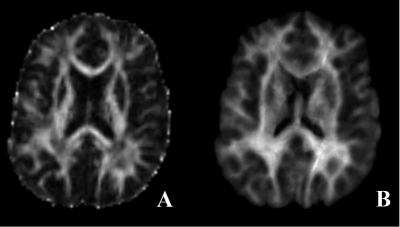
Figure 2: Representative CERES image of cerebellum taken from
Healthy control (A) and GA patient (B).
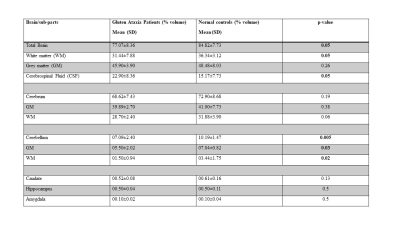
Table 2: Volumetric
estimation of Brain structures of GA patients and Healthy Controls.
-
Evaluating normative Cerebellum radiomics on FLAIR images
Umang Pandey1, Jitender Saini2, Manoj Kumar2, Rakesh Gupta3, and Madhura Ingalhalika1
1Symbiosis Centre for Medical Image Analysis, Symbiosis International University, Pune, India, 2Department of Radiology, National Institute of Mental Health and Neurosciences, Bengaluru, India, 3Department of Radiology,Fortis Memorial Research Institute, Gurgaon, India
Cerebellum and Cerebrum radiomics vary significantly. Presence of non -robust features across timepoints/scanners suggest that care must be taken while interpreting these features for pathological inferences.
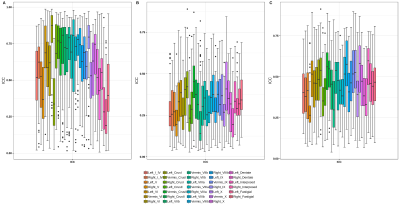
Figure 4: ICC score boxplots for cerebellum pacellations for A) intra-scanner, B) Pre-harmonization inter-scanner and C) Post-harmonized inter-scanner.
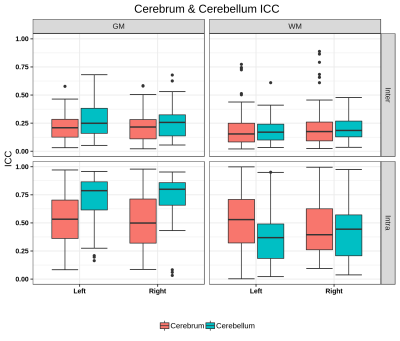
Figure 2: Boxplot of ICC scores for GM/WM hemispheric masks of Cerebrum & Cerebellum for inter- and intra-scanner. The ICC score is interpreted on a scale of 0 to 1, with 1 indicating absolute repeatability and anything below 0.5 considered poor for reproducibility.
-
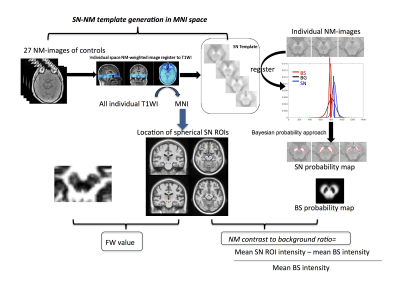
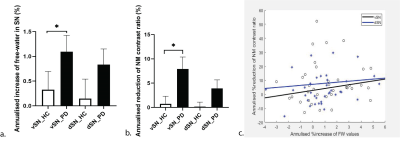
Spatial changes of neuromelanin and iron content in substantial nigra pars compacta in early-stage idiopathic Parkinson’s disease
Zenghui Cheng1, Bin Xiao2, Naying He3, Dinggang Shen4, Qian Wang5, Feng Shi4, Youmin Zhang3, Pei Huang3, Yan Li3, Sean K Sethi6, Kiarash Ghassaban7, Shengdi Chen3, Fuhua Yan3, and Ewart Mark Haacke7
1Radiology, Ruijin Hospital, Shanghai Jiao Tong University School of Medicine, Shanghai, China, 2Medical Imaging Technology, 、School of Biomedical Engineering, Shanghai Jiao Tong University, Shanghai, China, 3Ruijin Hospital, Shanghai Jiao Tong University School of Medicine, Shanghai, China, 4Shanghai United Imaging Intelligence Co., Ltd., Shanghai, China, 5Medical Imaging Technology, School of Biomedical Engineering, Shanghai Jiao Tong University, Shanghai, China, 6Magnetic Resonance Innovations, Inc, Bingham Farms, MI, United States, 7Wayne State University, Detroit, MI, United States
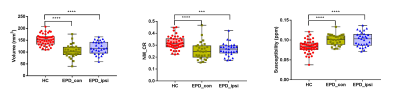
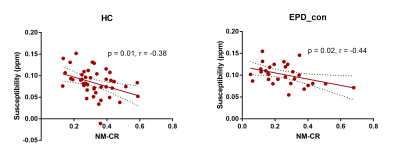
Iron deposition and neuromelanin-containing neuron loss is prominent in the ventral and medial part of SNpc in early-stage PD. This region may correspond to nigrosome 2.
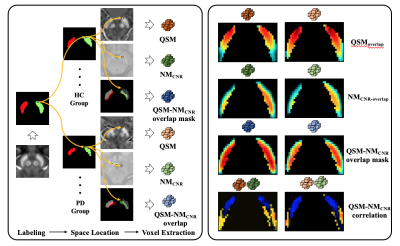
Figure 1. Flow of chart illustrating the voxel-wised analysis. PD- Parkinson’s disease, HC-healthy control, QSM- quantitative susceptibility mapping, NMCNR- contrast to noise of neuromelanin.
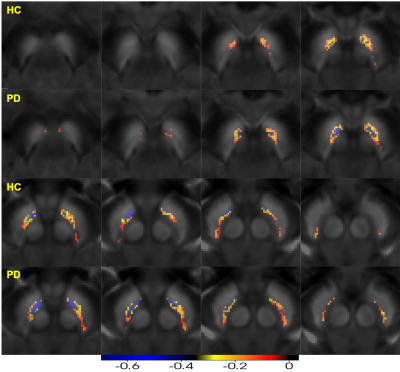
Figure 4. Negative Pearson’s correlation map of substantia nigra pars compacta (QSM-NMCNR overlap) PD- Parkinson’s disease, HC-healthy control, QSM- quantitative susceptibility mapping, NMCNR- contrast to noise of neuromelanin.
-
Automatic Detection of the Neuromelanin, Substantia Nigra, Red Nucleus and Subthalamic Nucleus using a High Resolution Brain Template
Mojtaba Jokar1, Ying Wang1,2, Zhijia Jin3, Yan Li3, Zenghui Cheng3, Yu Liu3, Naying He3, Fuhua Yan3, and E. Mark Haacke1,2,3,4,5
1Magnetic Resonance Innovations, Inc., Bingham Farms, MI, United States, 2Department of Radiology, Wayne State University, Detroit, MI, United States, 3Department of Radiology, Ruijin Hospital, Shanghai Jiao Tong University School of Medicine, Shanghai, China, 4Department of Biomedical Engineering, Wayne State University, Detroit, MI, United States, 5Department of Neurology, Wayne State University, Detroit, MI, United States
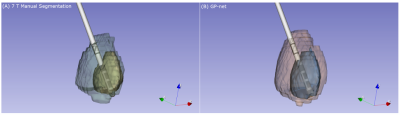
Comparing the template results to the
manual data, yielded excellent DICE similarity coefficients and volume ratios
for the four structures of interest and good agreement between the manual and
template measurements for SN iron content and the NM background mean.
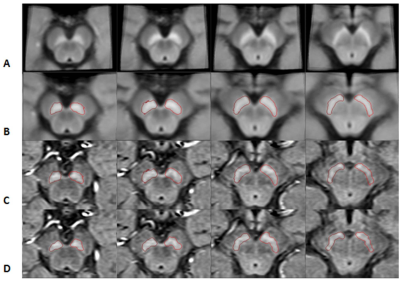
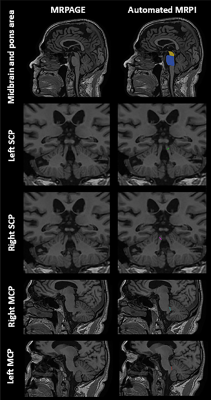
Figure 1.
The stages of mapping the boundaries from the template space to the original
space for neuromelanin. Each column represents a different slice. A) NM
template; B) the transformed NM template; C) the same boundaries superimposed on
the original midbrain images; and D) final boundaries after DPA was used to
refine the boundaries.
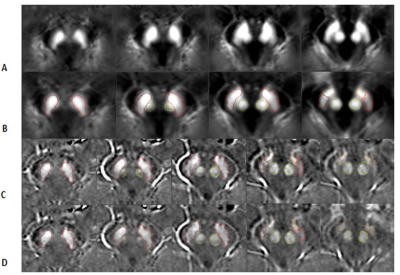
Figure
2.
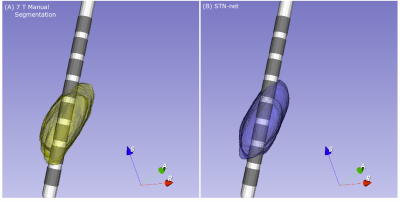
The stages of mapping the boundaries from the template space to the original
space for the QSM data. Each column represents a different slice. A) the QSM
template; B) the transformed QSM template; C) the same boundaries superimposed
on the original midbrain images; and D) final boundaries after the DPA was used
to refine the boundaries. The fourth and fifth columns show the SN boundary in
red and the STN boundary in orange. The second and third rows show the RN
boundary in light green.
-
Neuromelanin Sensitive MRI and QSM of the Substantia Nigra in Parkinson’s-Linked Asian LRRK2 Carriers
Septian Hartono1,2, An Sen Tan3, Weiling Lee4, Joey Oh4, Kuan Jin Lee5, Jongho Lee6, Eng King Tan1,2, and Ling Ling Chan2,4
1National Neuroscience Institute, Singapore, Singapore, 2Duke-NUS Medical School, Singapore, Singapore, 3Lee Kong Chian School of Medicine, Nanyang Technological University, Singapore, Singapore, 4Singapore General Hospital, Singapore, Singapore, 5Singapore BioImaging Consortium, Singapore, Singapore, 6Seoul National University, Seoul, Korea, Republic of
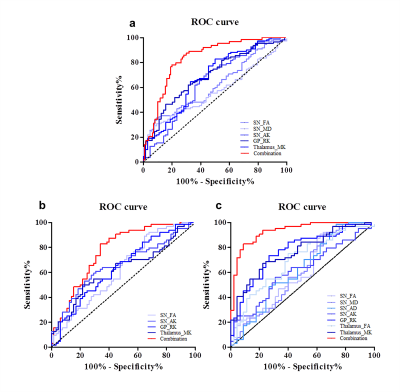
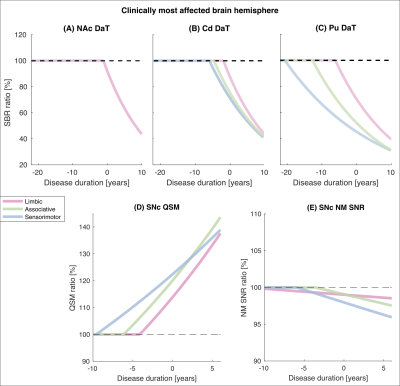
Neuromelanin-sensitive MRI showed no significant differences between PD LRRK2 carriers and non-carriers. Quantitative susceptibility mapping was able to distinguish the two groups,
with higher substantia nigra (SN) iron deposition and larger high-iron area of the SN in PD LRRK2 carriers.
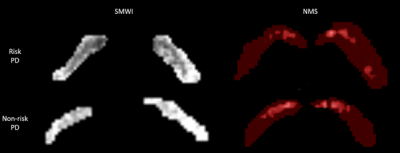
SN ROI derived from (1) semi-automated
segmentation on SMWI images (left) by thresholding for voxels with high iron
deposition containing signal intensity 7 standard deviations less than background
in and (2) NMS (right) by thresholding for voxels with signal intensity 4 standard
deviations higher than background in PD patient LRRK2 risk-variant
carriers (top row) and non-carriers (bottom row).
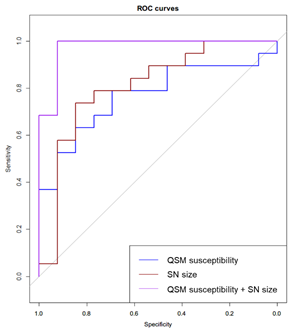
ROC analysis of QSM susceptibility, high-iron SN
size derived from SMWI, and combination model of QSM susceptibility and high-iron
SN size to classify LRRK2 risk-variant carriers and non-carriers in PD patients.
-
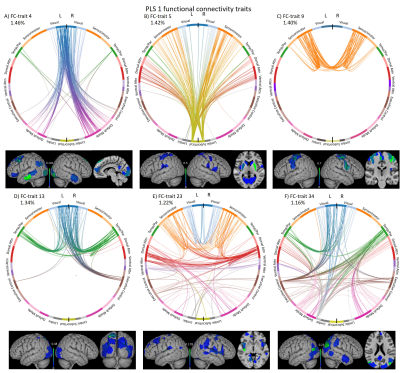
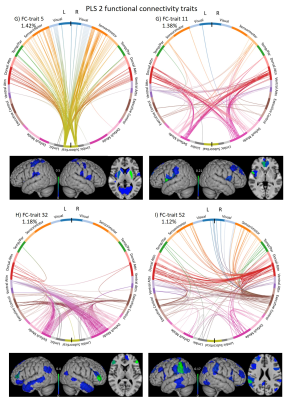
Altered cortico-cerebellar functional connectivity of language processing in congenital blind children
A Ankeeta1, S Senthil Kumaran1, and Rohit Saxena2
1Department of NMR & MRI Facility, All India Institute of Medical Sciences, Delhi, India, 2Dr RP Centre of Ophthalmology, All India Institute of Medical Sciences, Delhi, India
Congenitally blind subjects conscript visual cortex and cerebellum on functional
response to haptic language processing. Improved grey matter volume and duration of Braille
reading influences the functional connectivity of language network with cerebellum.
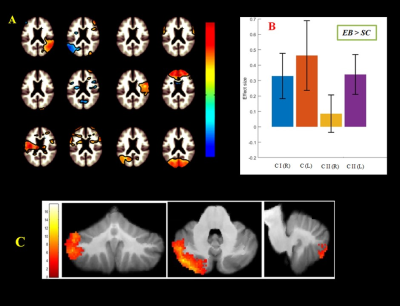
Figure 1. Illustration of
(A) independent component analysis for calculation of cortico-cerebellum during
semantic word recognition task in congenital blind relative to sighted control.
(B) Difference in cerebellar areas effect size and (C) estimation of gray
matter volume.
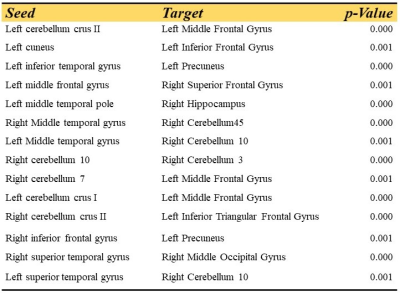
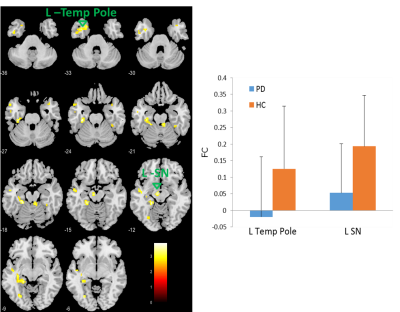
Table 2. Significant functional
connectivity of cerebellum and language integration estimated by using
independent component analysis for congenital blind children group as compared to
sighted control group.
-
Substantia Nigra Neuromelanin-sensitive Imaging Biomarker to Differentiate Between Atypical Parkinsonian Syndromes
Rahul Gaurav1,2,3, Emina Arsovic1,4, Lydia Chougar1,4, Nadya Pyatigorskaya1,2,3,4, Marie Vidailhet2,3,5, and Stephane Lehericy1,2,3,4
1CENIR, ICM Paris, Paris, France, 2Paris Brain Institute (ICM), Sorbonne University, UPMC Univ Paris 06, Inserm U1127, CNRS UMR 7225, Paris, France, 3ICM Team “Movement Investigations and Therapeutics” (MOV’IT), Paris, France, 4Department of Neuroradiology, Pitié-Salpêtrière Hospital, AP-HP, Paris, France, 5Department of Neurology, APHP, Pitié-Salpêtrière Hospital, Paris, France
Using neuromelanin-sensitive T1-weighted MRI, we found a significant decrease in substantia nigra pars compacta of atypical Parkinsonian disorders compared to healthy volunteers.
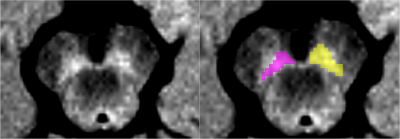
Figure 1: Substantia Nigra pars compacta regions of interest (left in yellow and right in pink) based on neuromelanin-sensitive imaging of a representative healthy volunteer.
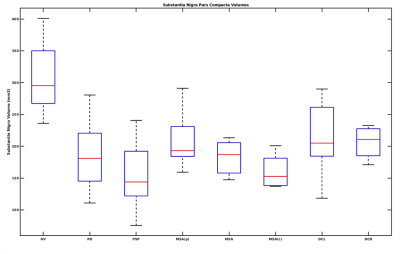
Figure 2: Box plot of Substantia Nigra pars compacta volume in Atypical Parkinsonian along with healthy volunteers. HV is Healthy Volunteers, PD is Parkinson's Disease, PSP is Progressive supranuclear palsy, DCB is CorticoBasal Degeneration, MSA is Multiple System Atrophy, with its cerebellar (MSAc) and Parkinsonian (MSAp) subtypes, and DCL is dementia with Lewy body.
-
Fibre-specific white matter reduction in patients with multiple system atrophy: comparison of parkinsonian and cerebellar subtypes
Po-Yuan Chen1, Chih-Chien Tsai1, Chin-Song Lu2, Yi-Hsin Weng2, Yi-Ming Wu3, and Jiun-Jie Wang1
1Chang Gung University, Taoyuan, Taiwan, 2Chang Gung Memorial Hospital, Taoyuan, Taoyuan, Taiwan, 3Chang Gung Memorial Hospital, Linkou, Taoyuan, Taiwan
This study provides evidence for the
subtype-specific white matter differences in patients with MSA. Importantly,
early diagnosis for parkinsonian or cerebellar subtype of MSA is possible with
the white matter pattern by fixel-based analysis.
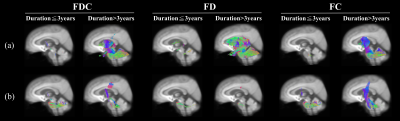
Figure 2. Fixels with significant (p < 0.05,
FWE-corrected) decrease in fixel-based metrics. (a)
MSA-P versus controls. Subtle changes were observed in the cohorts with disease
duration≦3 years; on the contrary, FC and FDC were
significantly decreased in the (b) MSA-C versus controls. Streamlines were
colored by direction (anterior-posterior: green; superior-inferior: blue;
left-right: red).
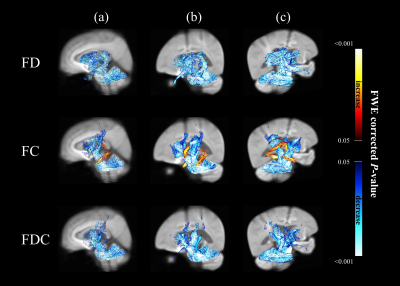
Figure 1. Significant changes in fixel-based metrics
in patients with MSA compared to healthy control subjects. Regions of significant changes in FD, FC and FDC were
displayed stereoscopically in the (a) sagittal, (b) superior left frontal and
(c) inferior right occipital view. Streamlines corresponding to significant
fixels (family-wise error corrected p <
0.05) were illustrated and colored according to p values. Cold color represented reduction, whereas warm color
represented increase.
-
Substantia Nigra Susceptibility Features Derived by Radiomics Predict Motor Outcome for STN-DBS in Parkinson’s Disease
Naying He1, Yu Liu1, Bin Xiao2, Junchen Li3, Chencheng Zhang4, Yijie Lai4, Feng Shi5, Dinggang Shen5, Yan Li1, Hongjiang Wei6, Ewart Mark Haacke1,7, Weibo Chen8, Qian Wang2, Dianyou Li4, and Fuhua Yan1
1Radiology, Ruijin Hospital, Shanghai Jiao Tong University School of Medicine, Shanghai, China, 2Institute for Medical Imaging Technology, School of Biomedical Engineering, Shanghai Jiao Tong University, Shanghai, China, Shanghai, China, 3Changshu Hospital Affiliated to Nanjing University of Chinese Medicine, No. 6 Huanghe Road, Changshu, China, Changshu, China, 4Department of Neurosurgery, Center for Functional Neurosurgery, Ruijin Hospital, Shanghai Jiao Tong University School of Medicine, Shanghai, China, Shanghai, China, 5Shanghai United Imaging Intelligence Co., Ltd., Shanghai, China, Shanghai, China, 6Institute for Medical Imaging Technology, Department of Biomedical Engineering, Shanghai Jiao Tong University, Shanghai, China, Shanghai, China, 7Department of Radiology, Wayne State University, Detroit, Michigan, USA, Detroit, MI, United States, 8Philips Healthcare,Shanghai,China, Shanghai, China
This QSM based radiomics model performed
best with an AUC of 0.897 to predict the STN-DBS motor outcome in PD. In addition, the
threshold probability of the RA-ML model can differentiate surgical responders
and non-responders.
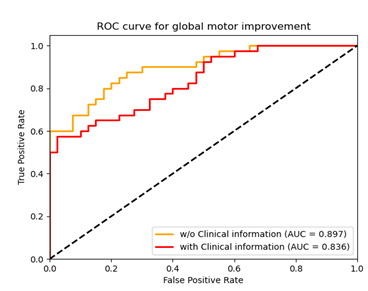
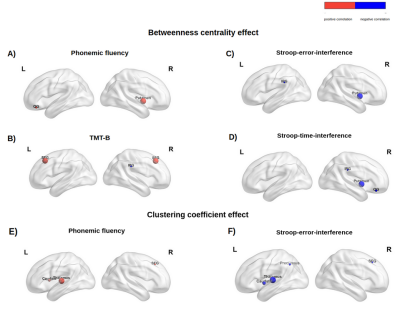
Fig. 2. Graph shows receiver
operating characteristic curve to assess the utility of two different models
with the clinical variables included or not (with and w/o clinical information)
for predicting global motor outcome.
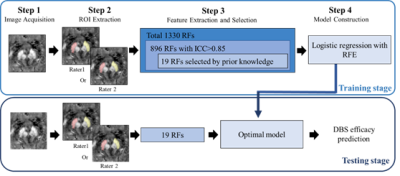
Fig. 1. Illustration of the processing
pipeline of the radiomics model with
machine learning (RA-ML). RF=radiomics feature; RFE= recursive feature
elimination
-
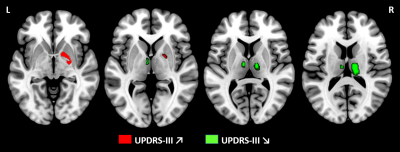
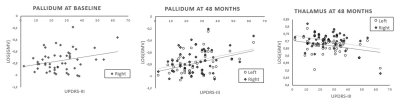
Locus coeruleus degeneration associated with less levodopa responsiveness in Parkinson’s Disease
Cheng Zhou1 and Minming Zhang1
1Zhejiang University, Hangzhou, China
LC degeneration was an indicator
for less levodopa responsiveness. LC integrity evaluation might be an
alternative tool in predicting disease prognosis and stratifying patients into
clinical trials for improving the efficacy of levodopa.
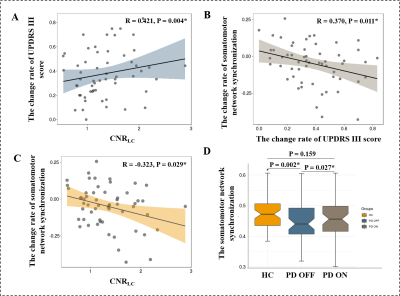
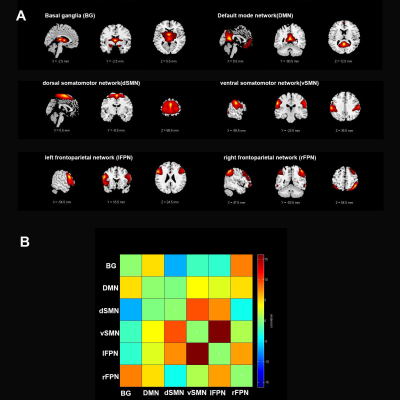
A, B, and C: Relationships between LC integrity, the change rate
of UPDRS III score, and the change rate of somatomotor network synchronization in
PD group. D: The difference of somatomotor network synchronization among HC, PD
during OFF and ON.
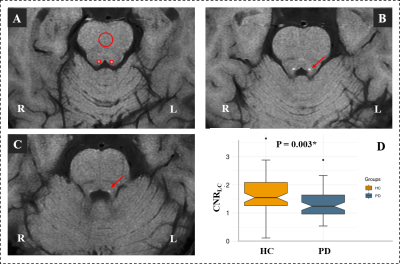
Comparison of CNRLC between the HC and PD groups.
(A) Signal intensity measurements of the LC (two small red
circles) and pontine (a big red circles) from a HC; (B) and (C) The location of
LC in continuous layers (red arrow); (D) Significantly decreased CNRLC
was found in PD group when compared with HC group.
-
Automatic assessment of motion artifact on Nigrosome 1 visualization protocol using CNN-LSTM
Junghwa Kang1, Na Young Shin2, and Yoonho Nam1,2
1Division of Biomedical Engineering, Hankuk University of Foreign Studies, Yongin, South Korea, yongin, Korea, Republic of, 2Seoul St.Mary’s Hospital, Department of Radiology, The Catholic University of Korea, Seoul, South Korea, Seoul, Korea, Republic of
We proposed to evaluate the degree of motion artifact on high-resolution magnetic susceptibility contrast images for N1 visualization that is sensitive to patient’s motions. We introduced deep CNN-LSTM network. The proposed method could be helpful in clinical use.
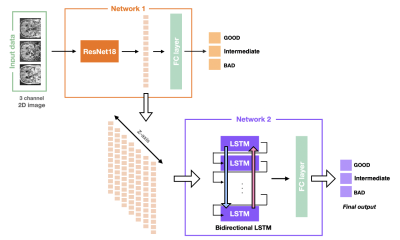
Figure 3. The architecture of CNN-LSTM for motion assessment
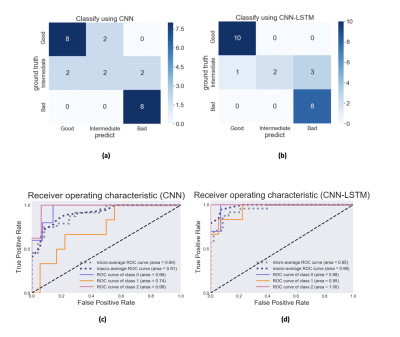
Figure 4. Confusion Matrix and ROC analysis (validation set) (a), (c) CNN , (b), (d) CNN-LSTM.
-
Quantitative mapping of substantia nigra iron and neuromelanin in Parkinson’s Disease
Jiahao Li1,2, Kelly Gillen1, Ilhami Kovanlikaya1, Thanh Nguyen1, Alexey Dimov1, Kailyn Li1, Weiyuan Huang1, Xianfu Luo1, Carly Skudin1, Eileen Chang1, Alexander Shtilbans1,3, and Yi Wang1,2
1Weill Cornell Medicine, New York, NY, United States, 2Meinig School of Biomedical Engineering, Cornell University, Ithaca, NY, United States, 3Hospital for Special Surgery, New York, NY, United States
There
is an increase in susceptibility but a decrease in neuromelanin in the SN of PD
subjects as compared to controls.
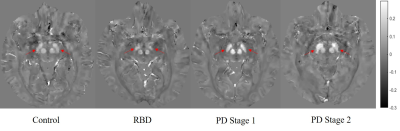
Figure
2. Representative QSM images from control, RBD, PD Stage 1 and PD Stage 2
subjects. Note increase
in susceptibility in substantia
nigra
(indicated
by red arrows) in PD
Stage 1 and
PD
Stage 2
compared to
healthy controls or RBD.
Scale bar in ppm (parts per million); RBD,
REM-sleep behavior disorder
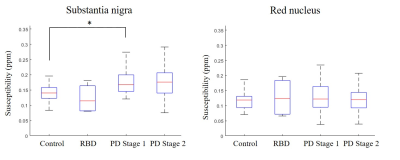
Figure
1. Average susceptibility in the substantia nigra
(SN; left) and red nucleus (RN; right) across all cohorts. Left: there is
significant increase in susceptibility PD
as compared
to controls. Right: there
are no statistically significant differences in susceptibility in the RN across
all cohorts. RBD,
REM-sleep behavior disorder; ppm, parts per million; *, p < 0.05 (multiple
comparison t-test, Bonferroni correction)
-
Substantia nigra magnetic resonance spectrum in differentiating tremor-dominant Parkinson’s disease from essential tremors
Rushi Chen1, Yan Bai1, Qin Feng1, Menghuan Zhang1, Xianchang Zhang2, and Meiyun Wang1
1Henan provincial people's hospital, Zhengzhou, China, 2MR Collaboration, Siemens Healthcare Ltd, Beijing, China, Beijing, China
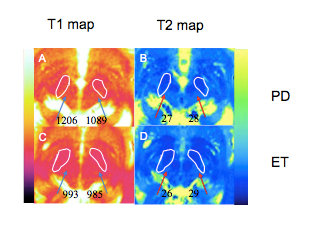
The NAA/Cr ratio derived from MRS in the contralateral SN was significantly higher in tremor-dominant PD than in ET.
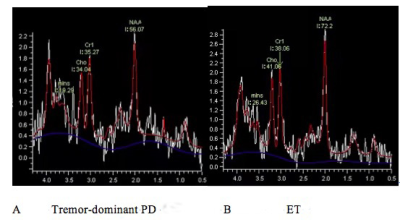
Figure 1. NAA/Cr was significantly decreased in the contralateral SN of a patient with tremor-dominant Parkinson’s disease (PD) (A) compared with that of a patient with essential tremors (ET).
-
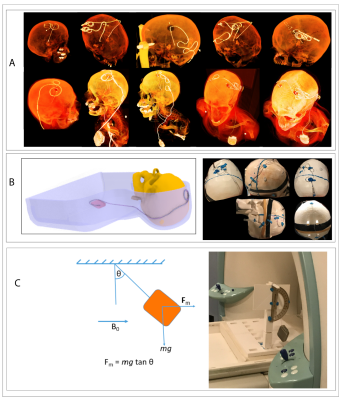
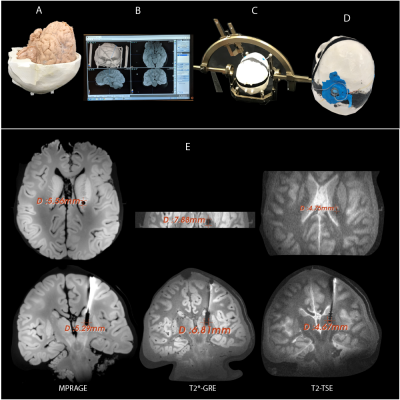
Feasibility of a short but comprehensive MRI protocol for quantitative characterization of progressive neurodegeneration in Friedreich ataxia
Koene R.A. Van Dijk1, Courtney A. Bishop2, James O’Callaghan2, James A. Goodman1, Laigao Chen1, Peter T. Loudon3, Lawrence Charnas4, Eugenii A. Rabiner2, and Richard Festenstein5
1Digital Medicine and Translational Imaging, Early Clinical Development, Pfizer, Cambridge, MA, United States, 2Invicro, London, United Kingdom, 3Clinical Sciences, Early Clinical Development, Pfizer, Cambridge, United Kingdom, 4Rare Disease Research Unit, Pfizer, Cambridge, MA, United States, 5Department of Brain Sciences, Imperial Clinical Research Facility and BRC (NIHR), Imperial College London, London, United Kingdom
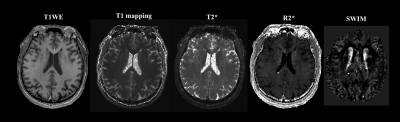
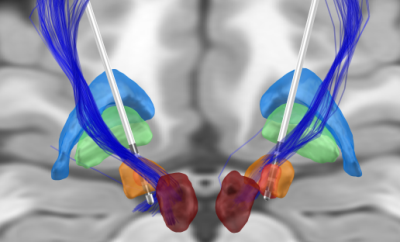
We found good quality data for the majority of sequences and patients in a scan session lasting less than 60 minutes and show sample imaging and spectroscopy data focusing on the dentate nucleus, a structure involved in planning, initiating, and modifying voluntary movements.
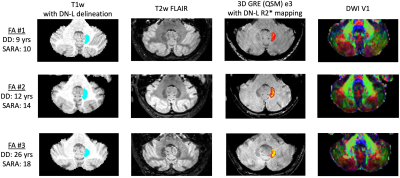
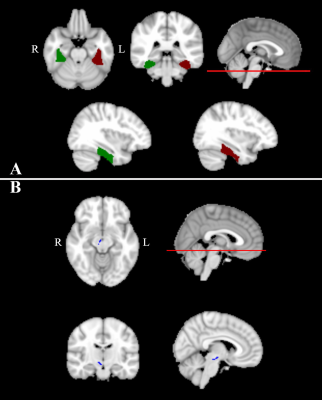
Figure 2. Sample dentate nucleus ROIs and contrast of mpMRI data at 3T. T1w: blue indicates the location of the participants’ left dentate nucleus; QSM: heatmap indicates estimated iron content in the left dentate nucleus mask as measured via R2* mapping (color scale shows rendering of values 5.0-40.0 s-1); DWI: dominant fiber orientation coded as follows: red=left-right, green=anterior-posterior, blue=superior-inferior. DD=disease duration. SARA=Scale for the Assessment and Rating of Ataxia.
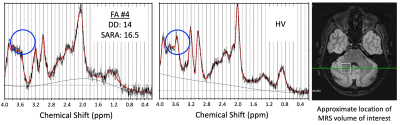
Figure 3. Sample spectroscopy data. Green circles indicate the location of the Myo-inositol peak (3.5ppm) for FA patient #4 (left panel) and a healthy volunteer (HV; center panel). The white square shows the location of the MRS volume of interest placed over the right dentate nucleus (right panel).
-
Swallow tail sign and nigrosome 1 - close but not quite the same
Malte Brammerloh1,2, Evgeniya Kirilina1,3, Anneke Alkemade4, Pierre-Louis Bazin1,4, Caroline Jantzen1, Carsten Jäger1,5, Andreas Herrler6, Kerrin J. Pine1, Penny Gowland7, Markus Morawski5, Birte Forstmann4, and Nikolaus Weiskopf1,2
1Max Planck Institute for Human Cognitive and Brain Sciences, Leipzig, Germany, 2Faculty of Physics and Earth Sciences, Leipzig University, Leipzig, Germany, 3Center for Cognitive Neuroscience Berlin, Freie Universität Berlin, Berlin, Germany, 4Integrative Model-based Cognitive Neuroscience Research Unit, University of Amsterdam, Amsterdam, Netherlands, 5Paul Flechsig Institute of Brain Research, University of Leipzig, Leipzig, Germany, 6Department of Anatomy and Embryology, Maastricht University, Maastricht, Netherlands, 7Sir Peter Mansfield Imaging Center, University of Nottingham, Nottingham, United Kingdom
The swallow tail sign in T2*-weighted MR images of the substantia nigra does not show a one-to-one correspondence to nigrosome 1, as demonstrated by an overlay of in vivo and postmortem MRI and 3D histology.
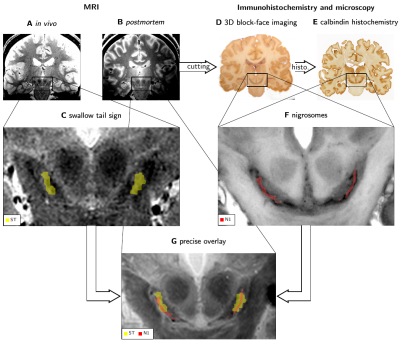
Combining in vivo (A) and postmortem (B) MRI with 3D immunohistochemistry (D, E) to study the anatomical underpinning of the swallow tail sign (ST). The ST was segmented (C) as a bright stripe in SN on in vivo MRI (A). N1 was segmented (F) as dark-pigmented areas on grayscale BF images (D) verified by calbindin immunohistochemistry (E). Co-registration (G) of 3D immunohistochemistry, postmortem MRI and in vivo MRI revealed contrast mechanisms of N1 and its relation to the swallow tail sign.
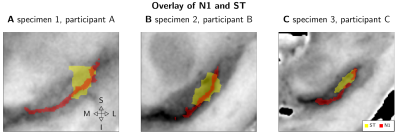
Masks of the ST and N1 for three randomly assigned pairs of in vivo and postmortem datasets (A, B, C) overlaid over BF. In all cases, ST covered a large part of N1. While N1 consistently showed a narrow width, ST was approximately twice as wide as N1. The ST only covered the superior-posterior-lateral portion of N1, while it did not match the ventromedial part of the rostral extent of N1. The anatomical medial (M), lateral (L), superior (S), and inferior (I) directions are illustrated in A.