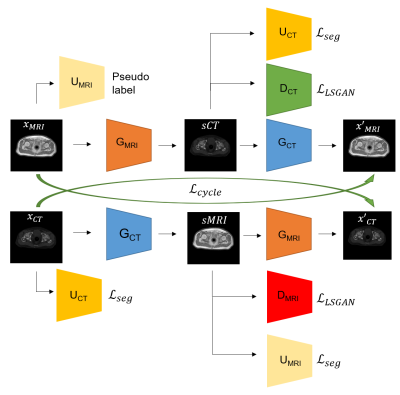
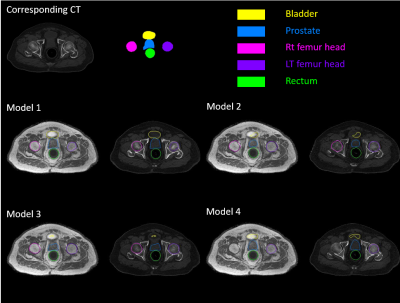
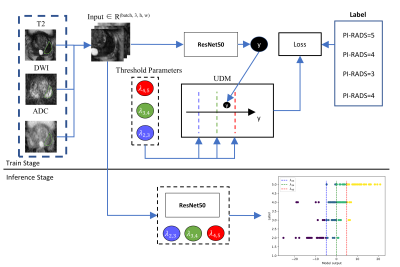
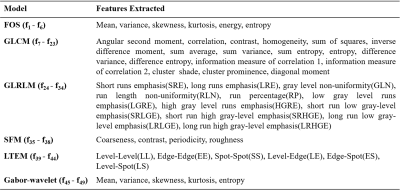
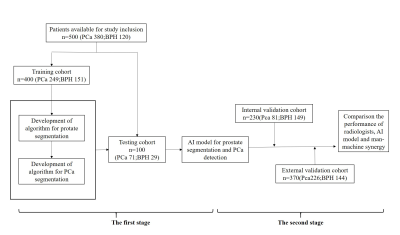
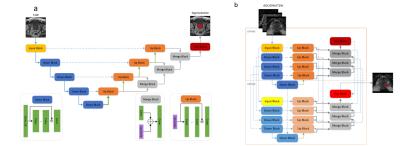
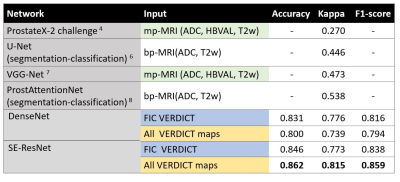
-
Directional and Inter-acquisition Variability in DWI (DAVID)
Jay M. Pittman1,2, Aritrick Chatterjee1,2, Teodora Szasz3, Grace Lee1,2, Mihai Giurcanu4, Milica Medved1,2, Ambereen Yousuf1,2, Ajit Devaraj5, Aytekin Oto1,2, and Gregory S. Karczmar1,2
1Radiology, The University of Chicago, Chicago, IL, United States, 2Sanford J. Grossman Center of Excellence in Prostate Imaging and Image Guided Therapy, The University of Chicago, Chicago, IL, United States, 3Research Computing Center, The University of Chicago, Chicago, IL, United States, 4Department of Public Health Sciences, The University of Chicago, Chicago, IL, United States, 5Philips Research North America, Cambridge, MA, United States
Standard averaging of multiple acquisitions for high b-values in DWI can obscure cancers, due to very large inter-acquisition variability. We
propose alternatives, including ‘Editing for Restricted Diffusion’, to improve
diagnostic accuracy.
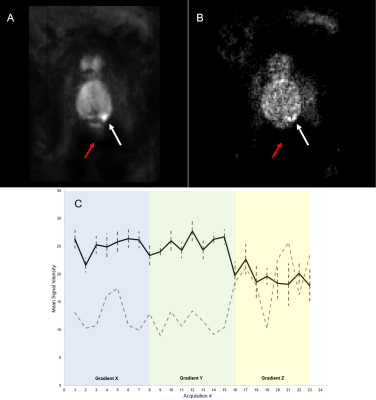
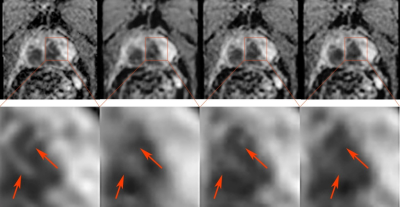
Figure 1. (A) Mean DW Image (900 sec/mm2) of patient 6. (B)
Standard deviation per voxel image for patient 6. (C) Mean signal intensity
versus acquisition # divided into three diffusion-sensitizing gradient
directions (Black line = mean, Dashed error bar = margin of error, Dashed gray
line = range). White arrow points to cancerous lesion while red arrow points to
noise.
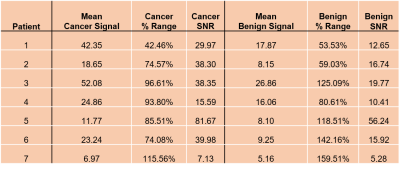
Table 1. Mean Signal, % Range, and SNR of patients 1-7 for a 3x3 region of voxels
in cancerous and benign contralateral tissue.
-
Multi-Readout Diffusion-Weighted Imaging for Studying Coupling between Apparent Diffusion Coefficient and Echo Time
Kaibao Sun1, Guangyu Dan1,2, Zheng Zhong1,2, and Xiaohong Joe Zhou1,2,3
1Center for MR Research, University of Illinois at Chicago, Chicago, IL, United States, 2Department of Bioengineering, University of Illinois at Chicago, Chicago, IL, United States, 3Departments of Radiology and Neurosurgery, University of Illinois at Chicago, Chicago, IL, United States
A novel multi-readout
DWI sequence was capable of acquiring multiple diffusion-weighted images at
different TEs in a single scan. This sequence was used to reveal the coupling
between ADC and TE in the healthy and neoplastic prostate tissues.
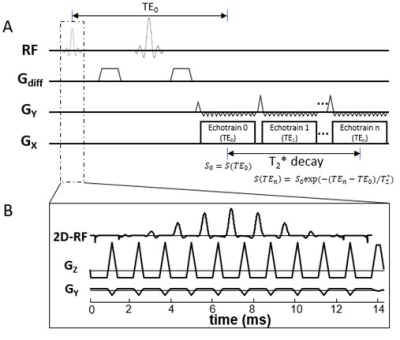
Figure 1: (A): A diagram of the multi-readout
DWI sequence. Multiple EPI echo-trains (or readout trains) are incorporated into
the sequence, with each echo-train corresponding to a specific effective TE. (B):
In the multi-readout DWI sequence, signal excitation is accomplished by a 2D RF
pulse to restrict the FOV so that a shorter echo train length can be used in
each echo-train, allowing multiple echo-trains to be acquired.
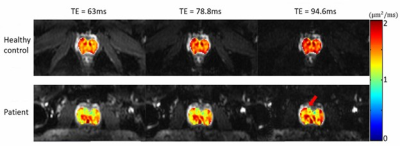
Figure 4: ADC maps of the prostate at
different TEs overlaid onto the corresponding T2*-weighted images (b-value
of 0 s/mm2) of a healthy subject (top row, average values: 1.49, 1.58,
and 1.67 μm2/ms)
and a patient with prostate cancer (bottom row, average values: 1.35, 1.39, and
1.45 μm2/ms).
The red arrow indicates the focal region of the cancer.
-
Synthetic DWI in prostate
Yu Ueda1, Tsutomu Tamada2, Makoto Obara1, Tetsuo Ogino1, Daisuke Morimoto-Ishikawa3, Hiroyasu Sanai2, Koji Yoshida2, Ayumu Kido2, Tomoko Hyodo4, Kazunari Ishii4, Masami Yoneyama1, and Marc Van Cauteren5
1Philips Japan, Tokyo, Japan, 2Department of Radiology, Kawasaki Medical School, Okayama, Japan, 3Radiology Center, Kindai University Hospital, Osaka, Japan, 4Department of Radiology, Kindai University, Osaka, Japan, 5BIU MR Asia Pacific, Philips Healthcare, Tokyo, Japan
Synthetic DWI at b = 1000 s/mm2 (DWI1000) with shorter TR of 1000ms had a tendency to
show better contrast than conventional DWI1000 with long TR of
6000ms.
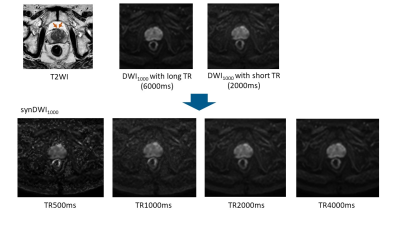
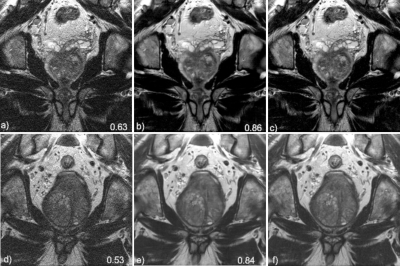
Figure 2. Prostate cancer in transitional zone. Cancer lesion
is shown as a homogeneous hypointense lesion with mass effect on T2WI (arrow). synDWI1000
with shorter TR provided better contrast than DWI1000 with long TR,
whereas noise in synDWI1000 with TR of 500ms become more visible.
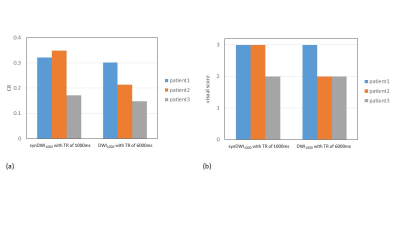
Figure 4. CR (a) and visual score (b) of prostate cancer between
synDWI1000 with shorter TR of 1000ms and DWI1000 with
long TR of 6000ms in three patients.
-
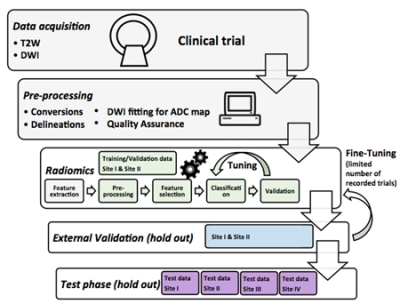
Rapid fitting of Luminal Water Fraction in Prostate MRI
David Atkinson1, Fiona Gong1, Giorgio Brembilla1, and Shonit Punwani1
1Centre for Medical Imaging, University College London, London, United Kingdom
Two potential metrics are presented; the mean signal from later echoes, normalized to the median from the first echo, and, a bi-exponential fit using fixed T2s of 50 and 300ms. Initial presentation of results suggests these methods are fast and should be evaluated for clinical efficacy.
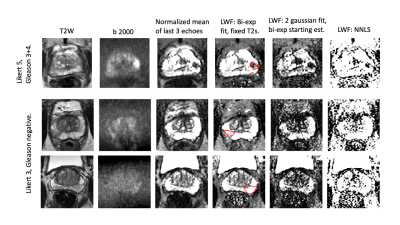
Fig 3. Images from three representative subjects.
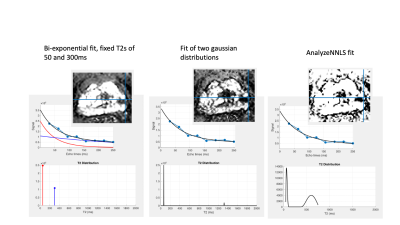
Fig 2. Alternative fits to the same voxel. Note the fitted signals (top row) are similar but the T2 distributions (lower row) differ. LWF maps inset.
-
Prostate MRI at 3-T: clinical impact of ultra-high b value (3,000 s/mm2) diffusion-weighted MR imaging compared to high b value of 2,000 s/mm2
Ayumu Kido1, Tsutomu Tamada1, Yu Ueda2, Masami Yoneyama2, and Akira Yamamoto1
1Radiology, Kawasaki Medical School, Okayama, Japan, 2Philips Japan, Tokyo, Japan
Compared with high b value DWI (b2000), ultra-high b value DWI (b3000) could not contribute to increased diagnostic performance in prostate cancer.
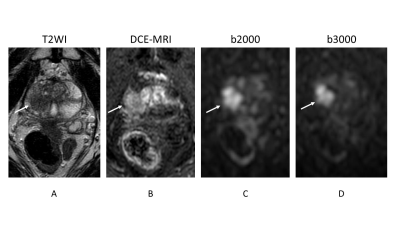
Prostate cancer lesion is shown as a homogeneous hypointense lesion with mass effect on T2-weighted imaging (arrow) (A) and focal early enhancement on dynamic contrast-enhanced MR imaging (arrow) (B). Signal intensity of normal prostate is lower in b3000 (D) than in b2000 (C). However, the lesion conspicuity between b2000 (arrow) and b3000 (arrow) is almost equivalent.
-
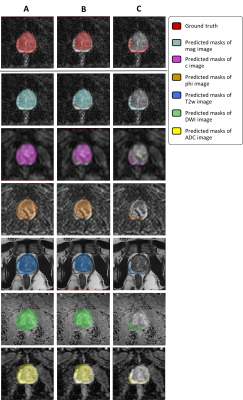
Automated patient-level detection of grade group ≥2 prostate cancer using quantitative restriction spectrum imaging MRI
Allison Y Zhong1, Leonardino A Digma1, Troy Hussain1, Christine H Feng1, Christopher C Conlin2, Karen Tye1, Asona J Lui1, Maren MS Andreassen3, Ana E Rodríguez-Soto2, Roshan Karunamuni1, Joshua Kuperman2, Rebecca Rakow-Penner2, Michael E Hahn2, Anders M Dale2,4, and Tyler M Seibert1,2,5
1Department of Radiation Medicine and Applied Sciences, University of California San Diego, La Jolla, CA, United States, 2Department of Radiology, University of California San Diego, La Jolla, CA, United States, 3Department of Circulation and Medical Imaging, Norwegian University of Science and Technology, Trondheim, Norway, 4Department of Neurosciences, University of California San Diego, La Jolla, CA, United States, 5Department of Bioengineering, University of California San Diego, La Jolla, CA, United States
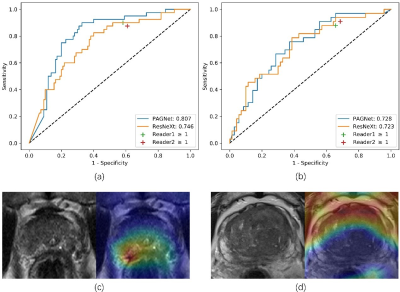
RSI-MRI performed well as a quantitative classifier of higher-grade prostate cancer in a retrospective series, with superior detection compared to conventional ADC and comparable performance to expert PI-RADS interpretation.
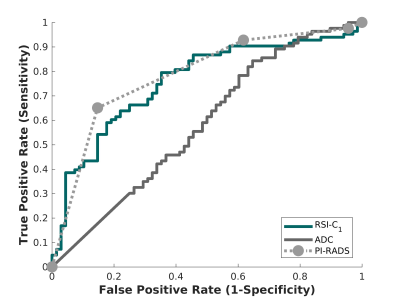
Figure 2. Receiving operator characteristic (ROC) curves for conventional ADC (dark gray), RSI-C1 (green), and PI-RADS v2.x (light gray), for the patient-level detection of higher-grade prostate cancer.
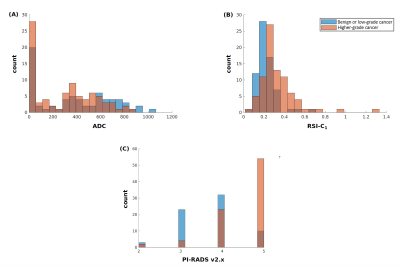
Figure 1. Histograms of (A) conventional ADC (lowest voxel value in prostate), (B) RSI-C1 (highest voxel value in prostate), and (C) highest PI-RADS category (v2 prior to 2019, v2.1 in 2019). Blue: Patients with no cancer or low-grade cancer. Orange: Patients with higher-grade (grade group ≥2) prostate cancer. Brown: where blue and orange overlap.
-
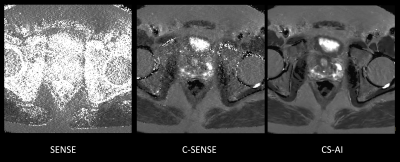
Comparison of single-shot EPI DWI, multi-shot EPI DWI, and single-shot EPI DWI using Compressed SENSE framework in prostate
Ayumu kido1, Tsutomu Tamada1, Yu Ueda2, Masami Yoneyama2, Jaladhar Neelavalli3, and Akira Yamamoto1
1Kawasaki Medical School, Okayama, Japan, 2Philips Japan, Tokyo, Japan, 3Philips India, Bangalore, India
Single-shot EPI (sshEPI) DWI has comparable the diagnostic performance of PC equivalent to sshEPI DWI using C-SENSE and multi-shot EPI (mshEPI) DWI called IRIS, whereas sshEPI DWI using C-SENSE and IRIS improve the image distortion and image blurringcompared to sshEPI DWI.
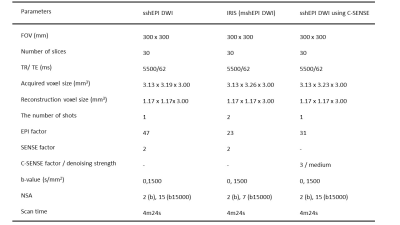
Details of the imaging parameters
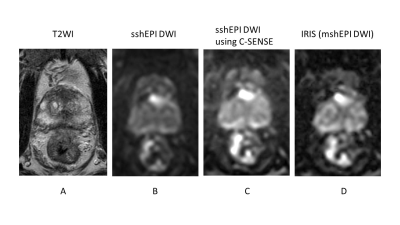
A 80-year-old male with prostate cancer (PSA level of 13.69 ng/mL, Gleason score of 3+4) in the transitional zone. Cancer lesion is shown as a homogeneous hypointense lesion with mass effect on T2-weighted imaging (A). The lesion with focal hyperintensity is depicted clearly in the three DWI image (sshEPI DWI, sshEPI DWI using C-SENSE, and IRIS) (B, C and D). SNR and CNR is higher in sshEPI DWI than in sshEPI DWI using C-SENSE and IRIS, whereas sharpness in sshEPI DWI using C-SENSE and IRIS is better than sshEPI DWI.
-
Clinical application of single-shot echo-planer diffusion-weighted imaging with compressed SENSE in prostate MRI
Ayumu Kido1, Tsutomu Tamada1, Yu Ueda2, Masami Yoneyama2, and Akira Yamamoto1
1Radiology, Kawasaki Medical School, Okayama, Japan, 2Phillips Japan, Tokyo, Japan
DWI with single-shot EPI (ssEPI) suffers from low SNR in high b-value acquisition. Compressed SENSE (C-SENSE) allow for a reduction of the noise. Compared with ssEPI with SENSE, ssEPI and C-SENSE may contribute improved image quality and risk stratification in prostate cancer.
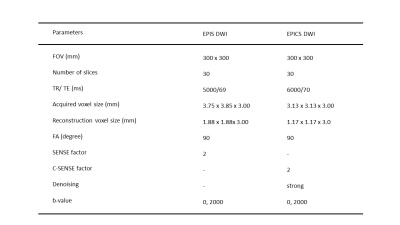
Details of the imaging parameters
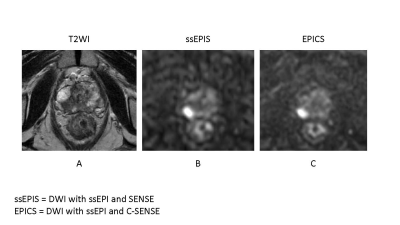
A 82-year-old male with prostate cancer (PSA level of 6.56 ng/mL, Gleason score of 4+3) in the right peripheral zone. Cancer lesion is shown as a homogeneous hypointense lesion with mass effect on T2-weighted imaging (A). The lesion with focal hyperintensity is depicted clearly in the both DWI image (ssEPIS and EPICS) (B, C). Signal to noise ratio is higher in EPICS than in EPIS.
-
Characterization of prostate cancer and benign prostatic hyperplasia using IVIM-DKI with parameter-reconstruction method
Archana Vadiraj Malagi1, Virender Kumar2, Kedar Khare3, Chandan J. Das4, and Amit Mehndiratta1,5
1Centre for Biomedical Engineering, Indian Institute of Technology Delhi, New Delhi, India, 2Department of Nuclear Magnetic Resonance (NMR),, All India Institute of Medical Sciences Delhi, New Delhi, India, 3Department of Physics, Indian Institute of Technology Delhi, New Delhi, India, 4Department of Radiodiagnosis, All India Institute of Medical Sciences Delhi, New Delhi, India, 5Department of Biomedical Engineering, All India Institute of Medical Sciences Delhi, New Delhi, India
IVIM-DKI
model with total variation(TV) penalty function reduced non-physiological
inhomogeneity in IVIM-DKI parameter adaptively to produce better quality
parameter maps. D, f, k can be used discriminate
between PCa and BPH with high diagnostic performance.
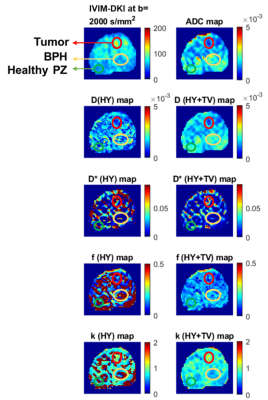
Figure2 For BPH (yellow), the hyperintense region was observed
on (b) ADC, (c) D, and (e) f; whereas hypointense region was observed on, (a)
High b-value map, (d) D*, and (f) k of a representative patient diagnosed with
PCa and BPH.
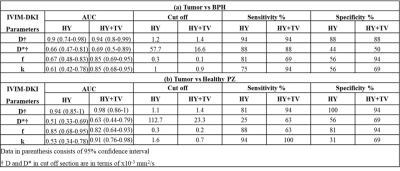
Figure4
Diagnostic performance of IVIM-DKI parameters obtained from HY and HY+TV model
to differentiate from (a) Tumor vs BPH and (b) Tumor vs Healthy PZ.
-
Comparison of multiplexed sensitivity encoding (MUSE) and single-shot echo-planar imaging (ssEPI) for diffusion-weighted imaging of prostate
Chun-Ying Shen1, Chia-Wei Li2, Chien-Yuan Lin2, and Ching-Hua Yang1
1Department of Radiology, Taovuan General Hospital, Ministry of Health and Welfare, Taovuan, Taiwan, 2GE Healthcare, Taipei, Taiwan
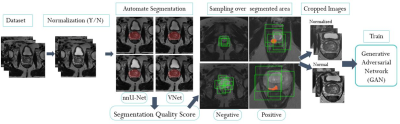
This study aimed to evaluate and compare the SNR and distortion of multiplexed sensitivity encoding (MUSE) and conventional imaging for diffusion-weighted imaging of the prostate. Our result showed that prostate images by MUSE-DWI can provide significant less distortions and higher SNR.
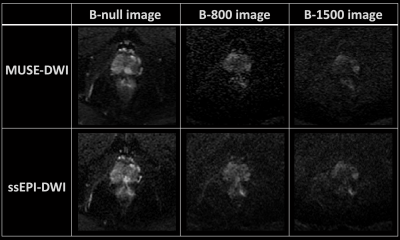
Figure 1. The diffusion-weighted images of prostate by ssEPI-DWI and MUSE-DWI.
Figure 2. The data analysis procedure. (a) The prostate ROI was segmented manually from high-resolution structural images, and (b) the overlapping between the segmented prostate ROI and prostate range by DWI images was calculated.
-
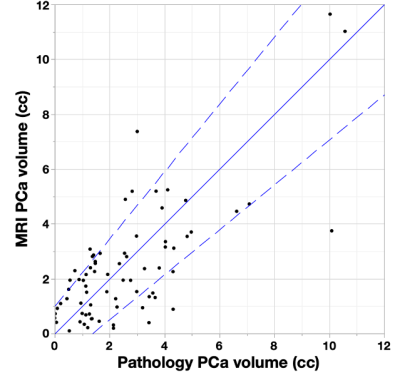
Optimal 2D-ROI Method to Measure Apparent Diffusion Coefficient of Lesions in Prostate MRI
Hiroaki Takahashi1, Kotaro Yoshida2, Akira Kawashima3, Num Ju Lee4, Adam T Froemming4, Daniel A Adamo4, Ashish Khandelwal4, Candice W Bolan5, Matthew T Heller6, Robert P Hartman4, Bohyun Kim4, Kenneth A Philbrick4, Rickey E Carter5, Lance A Mynderse4, Mitchell R Humphreys6, and Naoki Takahashi4
1Department of Radiology, Mayo Clinic, Rochester, Rochester, MN, United States, 2Department of Diagnostic Radiology, Kanazawa University School of Medical Science, Kanazawa, Japan, 3Department of Radiology, Mayo Clinic, Arizona, Scottsdale, AZ, United States, 4Mayo Clinic, Rochester, Rochester, MN, United States, 5Mayo Clinic, Florida, Jacksonville, FL, United States, 6Mayo Clinic, Arizona, Scottsdale, AZ, United States
The
optimal method for measuring ADC values for differentiating csPCa and non-csPCa
on prostate MRI are 2D-ROI placed on the lowest ADC area using 6-8 mm2.
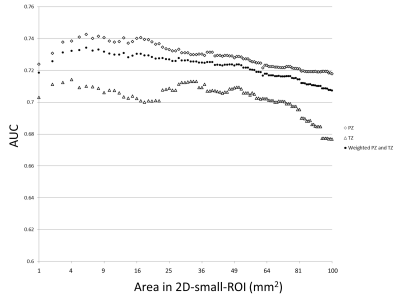
Fig.1. A dot
plot of AUC values of receiver operating characteristics in differentiation of
presence or absence of clinically significant prostate cancer for 2D-small-ROI
with different area
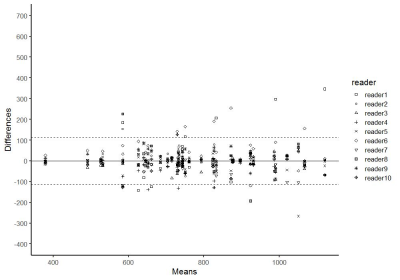
Fig.5. Bland-Altman
plots of ADC values measured by using 3D-whole-lesion-ROI method (10th
percentile). 95% limits of agreement among the readers on was +/-112.
-
Application of High Spectral and Spatial resolution (HiSS) MRI in prostate: a pilot study
Milica Medved1,2, Aritrick Chatterjee1,2, Ajit Devaraj3, Carla Harmath1, Grace Lee1, Ambereen Yousuf1,2, Tatjana Antic4, Aytekin Oto1,2, and Gregory S Karczmar1,2
1Radiology, The University of Chicago, Chicago, IL, United States, 2Sanford J. Grossman Center of Excellence in Prostate Imaging and Image Guided Therapy, The University of Chicago, Chicago, IL, United States, 3Philips Research NA, Cambridge, MA, United States, 4Pathology, The University of Chicago, Chicago, IL, United States
HiSS MRI is feasible for prostate cancer imaging
at 3T, without an endorectal coil. HiSS parameters describing the water
resonance shape are complementary to standard multi-parametric MRI and can
likely be used to increase diagnostic accuracy.
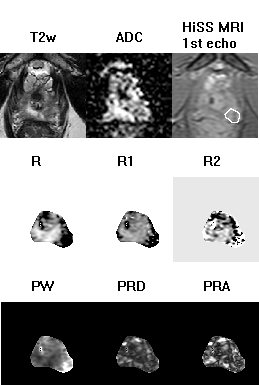
Figure 2:
The T2-weighted image, ADC map, shortest-TE HiSS MRI image, and HiSS
MRI-derived temporal domain (R, R1, R2) and spectral domain (PW, PRD, PRA) parameter
maps are shown here for a representative slice through the prostate of a 52-yo
man with a Gleason score 7 (3+4) lesion (white outline).
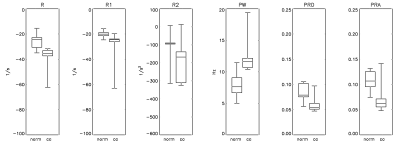
Figure 3:
Boxplots of HiSS MRI-derived parameters R, R1, R2, PW, PRD, and PRA are
shown, for normal and cancer ROIs. The
whiskers represent the full data range. All
HiSS-derived parameters were statistically significantly different (p <
0.05) between cancer and normal tissue ROIs, except R2.
-
Non-Invasive Prostate Metabolic and Cytometric Imaging: Insights from Activity MRI [aMRI]
Xin Li1, Eric M. Baker1, Brendan Moloney1, Ryan P. Kopp2, Fergus V. Coakley3, Mark G. Garzotto4, and Charles S. Springer1
1Advanced Imaging Research Center, Oregon Health & Science University, Portland, OR, United States, 2Urology, Oregon Health & Science University, Portland, OR, United States, 3Radiology, Oregon Health & Science University, Portland, OR, United States, 4Urology, Portland VA Center, Portland, OR, United States
The first metabolic and cytometric maps of human prostate cancer are presented. A Gleason (3+4) tumor has very conspicuous elevated cell density and reduced average cell density, and depressed homeostatic Sodium Pump enzymatic turnover.
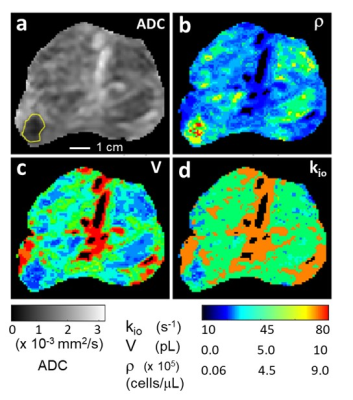
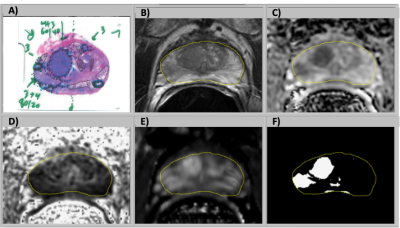
Figure 1. Prostate axial ADC (a), ρ (b), V (c), and kio (d) maps; inferior perspective. The GS (3+4) lesion is bordered in yellow (a). [Pixels in urethra and ductule-rich regions are colored black in (b), (c), and (d).] The ρ, V, maps are in near absolute quantitative agreement with estimations from published ex vivo histopathology and the r map shows very high in vivo lesion/NA prostate gland conspicuity. The kio map indicates lower metabolic activity in the lesion. The r and V maps may suggest nascent pathology in NA prostate regions, particularly the peripheral zone (see text).
-
Differential diagnosis of PCa and BPH using intratumoral susceptibility signal intensities based onESWAN
Yunsong Liu1, Hongkai Wang2, Mingrui Zhuang2, Lihua Chen1, Qingwei Song1, Shuang Meng1, and Ailian Liu1
1The First Affiliated Hospital of Dalian Medical University, Dalian, China, 2Dalian University of Technology, Dalian, China
The study
demonstrated that quantitative ITSS had good diagnostic efficiency to
differentiate PCa and BPH. In the present study, we proposed that ITSS could be
a promising imaging biomaker that allow differentiate PCa and BPH
quantitatively and automatically.
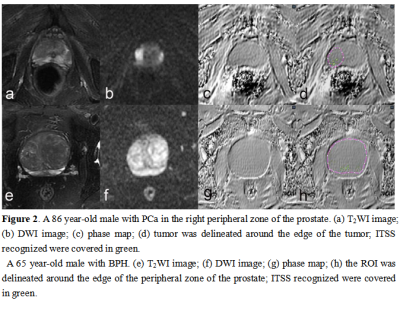
ROI can be obtained without layer-by-layer
annotation through the interpolation and annotation tools of AS
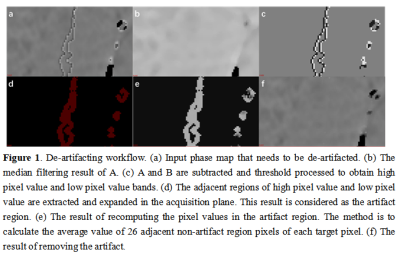
De-artifacting workflow
-
Physically Implausible Diffusion Signals (PIDS) as a Quality Assessment Metric in Prostate DWI
Teodora Szasz1, Milica Medved2, Aritrick Chatterjee2, Ajit Devaraj3, Ambereen Yousuf2, Xiaobing Fan2, Gregory Karczmar2, Aytekin Oto2, and Grace Lee2
1Research Computing Center, The University of Chicago, Chicago, IL, United States, 2Department of Radiology, The University of Chicago, Chicago, IL, United States, 3Philips Research North America, Chicago, IL, United States
PIDS levels were similar for non-endorectal coil (NERC) and endorectal
coil cohorts (ERC). Rician noise was higher and strongly correlated with PIDS in
NERC compared to ERC. High PIDS coincided with motion artifacts and low signal.
It can be used as quantitative marker for quality in prostate.
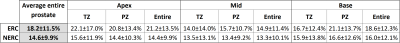
Table 1. Average PIDS prevalence across the 40 ERC and 40 NERC subjects.
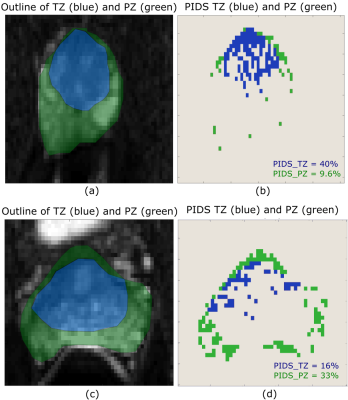
Figure 1. Example of
variations of the PIDS across TZ and PZ. A high PIDS value of 40% can be seen
in the TZ region (a) and (b), while in PZ region the PIDS is 9.6%. Similarly,
in another subject we can see a higher value of PIDS (33%) in PZ - (c) and (d),
compared to TZ.
-
POST-ACQUISITION WATER SIGNAL REMOVAL IN 3D WATER-UNSUPPRESSED 1H-MR SPECTROSCOPIC IMAGING DATA OF THE PROSTATE
Angeliki Stamatelatou1, Diana Sima2, Sabine Van Huffel3, Sjaak Van Asten4, Arend Heerschap4, and Tom Scheenen4
1Radiology, Radboud UMC, Nijmegen, Netherlands, 2Icometrix, Leuven, Belgium, 3KU Leuven, Leuven, Belgium, 4Radboud UMC, Nijmegen, Netherlands
Water signal removal in 3D
water-unsuppressed 1H-MRSI data of the prostate is presented. Löwner
BSS and HLSVD methods were compared against conventional MRSI water suppression.
Post-acquisition water removal was successfully implemented, and the Löwner
filter showed the best performance.
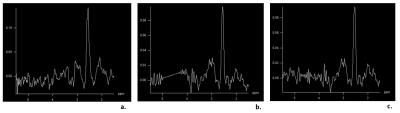
Figure
1. MRS
prostate spectra from a volunteer in the frequency range 1.5 ppm to 5.5 ppm. a. Spectrum obtained with water signal suppression
b. Spectrum obtained without water
signal suppression but with water signal removal using a Löwner filter, c. Spectrum without water signal
suppression but with water signal removal using a HLSVD filter.
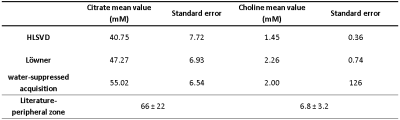
Table
2. Mean
values of the absolute metabolite concentrations of citrate
and choline. The bottom row presents absolute metabolite tissue concentrations reported
in reference 7. The choline values seem to
be lower compared to the literature, but this is explained by the fact that the
volunteers participated in the study were of a young age.
-
Standardization of SE-MRE at 3.0T for the prostate.
Nicolás Moyano Brandi1,2,3, Daniel Fino1,2,4, Joaquín Capó1,2,3, Federico González1,4,5, Bruno Lima1,2, Maximiliano Noceti1,2,6, Pablo Ariza1,2, and Andrés Dominguez1,2
1Magnetic Resonance, Fundacion Escuela de Medicina Nuclear, Mendoza, Argentina, 2Magnetic Resonance, Fundación Argentina para el Desarrollo en Salud, Mendoza, Argentina, 3Universidad de Mendoza, Mendoza, Argentina, 4Universidad Nacional de Cuyo, Mendoza, Argentina, 5Comisión Nacional de Energía Atómica, Mendoza, Argentina, 6Hospital Italiano, Mendoza, Argentina
A cut-off value between PR-1/2 and PR-4/5 of 4.4 kPa was determined. Regarding the results with MRE-SE, the cut-off value of 4.4 kPa makes it possible to establish that trans-pelvic prostate MRE is a method capable of differentiating malignant tissue from normal tissue.
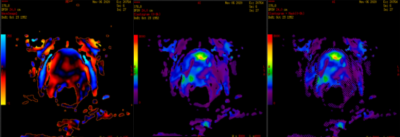
Wave propagation map, MRE (0-8 kPa) and MRE confidence map (0-8 kPa).
Left: SE-MRE 60 Hz. Right: GRE-MRE 60 Hz.
-
Development of Distortion-Free MR Elastography Methods for Slip Interface Imaging of the Prostate
Yi Sui1, Kay Pepin1, Phillip J. Rossman1, Kevin Glaser1, Lance Mynderse2, Richard L. Ehman1, and Ziying Yin1
1Radiology, Mayo Clinic, Rochester, MN, United States, 2Urology, Mayo Clinic, Rochester, MN, United States
A distortion-free technique has been developed for prostate MR elastography (MRE) slip-interface imaging (SII) . This new technique may be useful for evaluating the degree of prostate extraprostatic extension (EPE) noninvasively.
Figure
2. Distortion-free DIADEM-MRE magnitude image and
SII-derived OSS map from the same healthy volunteer.
Figure
1: Standard EPI-MRE magnitude image, distortion-free DIADEM-MRE
magnitude image, and T2-weighted anatomical image from a healthy volunteer
-
Investigate the correlation between APT valuesand ADCs in Benign Prostatic Hyperplasia and Prostatic Cancer
Shuang Li1, Ailian Liu1, Lihua Chen1, Yuanfei Li1, Shuang Meng1, Jiazheng Wang2, Peng Sun2, Qingwei Song1, and Renwang Pu1
1The First Affiliated Hospital of Dalian Medical University, Dalian, Dalian, China, 2Philips Healthcare, Beijing, China, Beijing, China
Both APT and ADC values show a statistical difference between patients with PCa and BPH. There is a moderate negative correlation between the APT and ADC values in PCa and BPH.
Figure 1 T2WI(A)image, DWI(B)image, fused APT and DWI (C, D) images of a BPH patient. T2WI(E)image, DWI(F)image, fused APT and DWI (G, H) images of a PCa patient. The placement of ROIs is as illustrated.
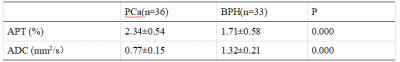
Table 2.Comparisonof APT and ADC values
-
Optimization of 3D prostate APTw MR imaging
Wenjun HU1, Ailian Liu1, Lihua Chen1, Zhiwei Shen2, Jiazheng Wang3, Yi Zhang4, and Qingwei Song1
1The First Affiliated Hospital of Dalian Medical University, Dalian, China, 2Philips Healthcare, Beijing, China, 3Philips Healthcare, Bejing, China, 4Zhejiang University, Hangzhou, China
Higher SNR and more clear anatomical
structure of APTw images in prostate was acquired with the
optimal scan parameters: the number of slices
of 7,
voxel
of 2×2 mm2, the
echo train length of 100, small FOV of 130×100×49mm3,
fold-over suppression of rest, SENSE of 1.1, phase
encoding direction of AP.
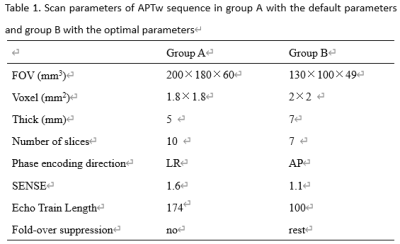
Table
1. Scan parameters of APTw sequence in group A with the
default parameters and group B with the
optimal parameters
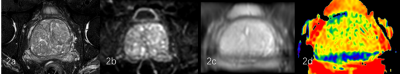
Figure2.
a 75-year-old male with BPH of group B. T2WI(2a), DWI (2b), M0 (2c) (central zone
SNR=71.22, peripheral zone SNR=22.12), APTw (2d) images are
shown.