-
The reduction in the contribution of a fast diffusing component for pancreatic malignancy detection – A preliminary study
Debbie Anaby1, Maria Raitses-Gurevich2, Sara Apter1,3, Yael Inbar1,3, Hadassa Degani4, and Talia Golan2,3
1Diagnostic Imaging Department, Sheba Medical Center, Ramat Gan, Israel, 2Department of Oncology, Sheba Medical Center, Ramat Gan, Israel, 3Sackler School of Medicine, Tel Aviv University, Tel Aviv, Israel, 4Life Sciences, Weizmann Institute of Science, Rehovot, Israel
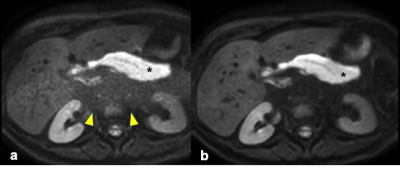
DT-MRI was utilized in pancreatic
pathologies and healthy controls. A reduction of the fast diffusing component
is observed in pancreatic tumor regions as compared to healthy or cystic
pancreatic tissue. Therefore, DT-MRI may be of help in the identification of
pancreatic malignancy.
-
Predicting fibrosis grades of pancreatic ductal adenocarcinoma using intravoxel incoherent motion diffusion-weighted imaging
Qi Liu1, Wei Xing1, Jilei Zhang2, JingGang Zhang1, Jie Chen1, and Bei Li1
1Department of Radiology, The Third Affiliated Hospital of Soochow University, Changzhou, China, 2Clinical Science, Philips Healthcare, Shanghai, China
This study explored the feasibility of evaluating
fibrosis of
patients with pancreatic ductal adenocarcinoma (PDAC) and correlate it with
histopathological features using intravoxel incoherent motion diffusion-weighted
imaging (IVIM-DWI) compared with diffusion-weighted imaging (DWI). This
retrospective study assessed 50 patients with surgically resected, pathologically
confirmed PDAC who underwent DWI and IVIM-DWI. The tumor tissue was stained
with sirius red, CD34, and CK19 to quantitate fibrosis, microvascular density
(MVD), and tumor cell density. Patients were classified into low- and
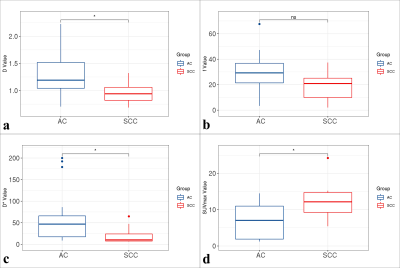
high-fibrosis groups based on histopathological features. ADC, D, D*, and f
generated from IVIM-DWI were measured in tumor areas by two radiologists
independently. ADC
with b (0, 500), ADC
with b (0, 800), D, D*,
and f values were compared between
high- and low-fibrosis groups using the Student t test. The association between quantitative DWI
parameters and histopathology was assessed using correlation analysis. The D values were lower in the high-fibrosis
group than in the low-fibrosis group while the f values followed the opposite trend. Further, no statistically
significant differences were found in ADC and D* values between the high- and low-fibrosis groups.
A significant negative correlation between D values and fibrosis and a significant
positive correlation between f values
and fibrosis were observed. D and ƒ values derived from the IVIM model had
high sensitivity and diagnostic performance for grading fibrosis in PDAC
compared with the conventional DWI model. IVIM-DWI could serve as an imaging biomarker for predicting the fibrosis grade of PDAC.
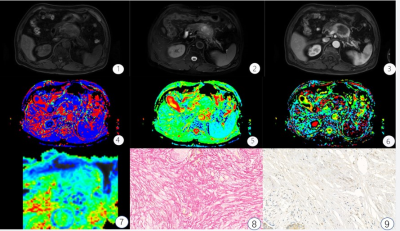
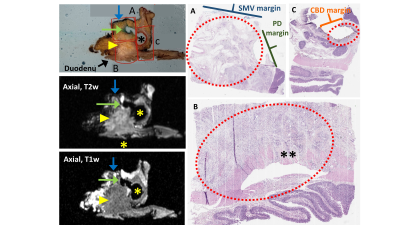
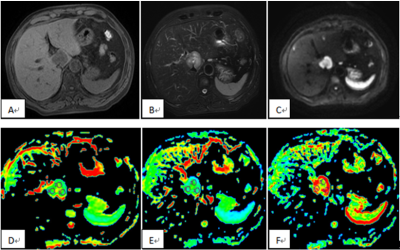
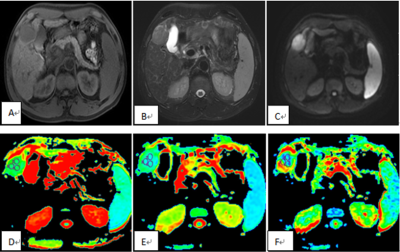
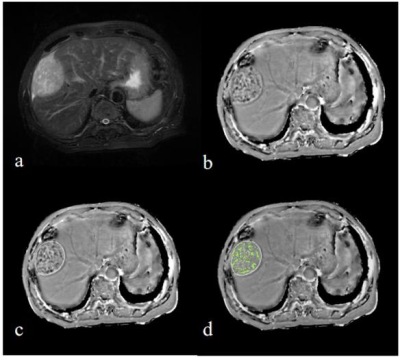
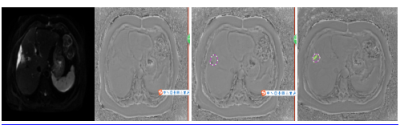
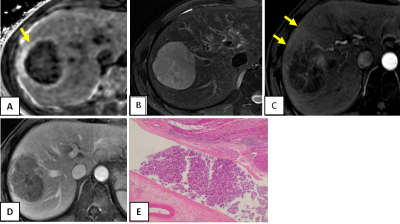
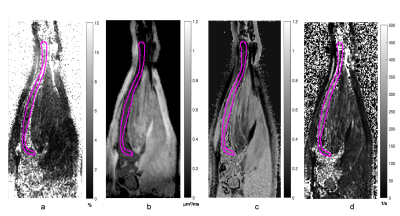
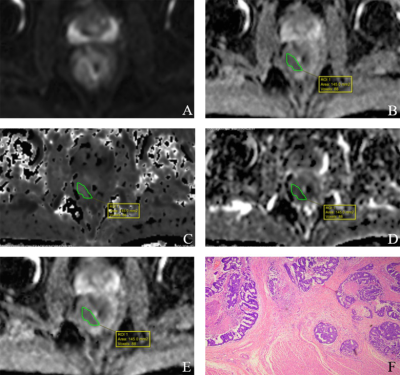
FIGURE 1: A 67-year-old male with high fibrosis
PDAC. ①-③ T1WI, T2WI,
arterial phase images, Pancreatic tumors show low T1WI signal, slightly higher
signal on the T2WI, the arterial phase mild enhancement; ④-⑦ D*, D, f, ADC parameters mappings, 64.5 μm2/ms,
1.16 μm2/ms, 18.03%, 1.2 μm2/ms, respectively. ⑧-⑨
pathological images of Sirius red and CD34 staining, Fibrosis level is 47%, and
MVD is 5.6%.
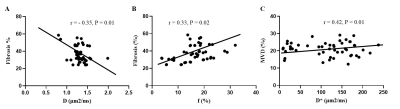
Figure 5. Correlation Between DWI Parameters and Histopathology Features. (A) The
correlation between D values and fibrosis. (B) The correlation between f values
and fibrosis. (C) The correlation between D* and MVD.
-
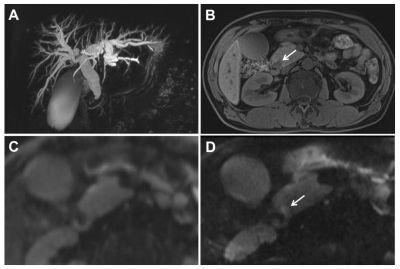
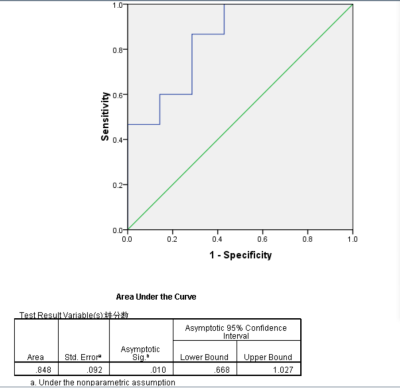
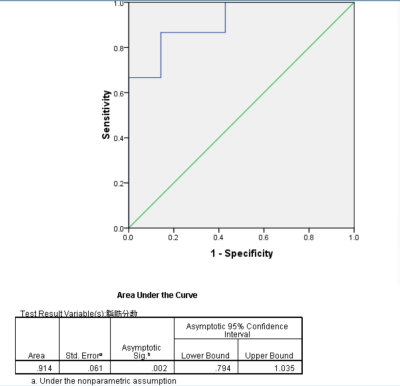
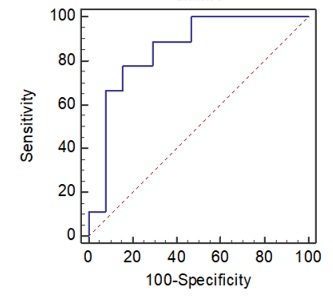
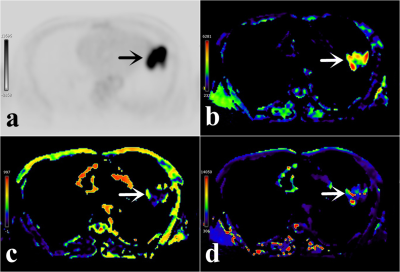
A study of pancreatic cancers based on integrated 18F-FDG PET/MRI scans in diagnosis of malignant tumors from benign lesions
Gang FENG1, Mingxiang Sun1, Liling Peng1, Zhaoting Meng1, and Xin Gao1
1Shanghai Universal Medical Imaging Diagnostic Center, Shanghai, China
Applying integrated PET/MR in pancreatic tumor
detection and assessment is promising. To combine PET and DWI together to discriminate
malignant tumors from benign lesions has more advantage than when individually
used.
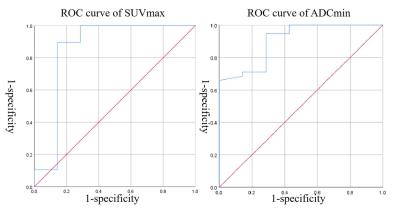
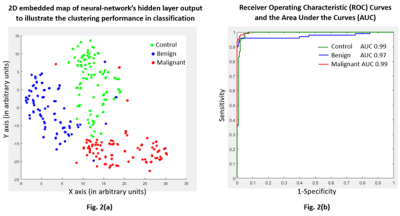
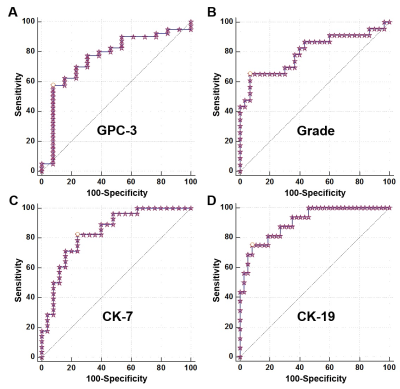
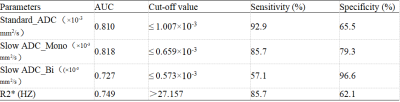
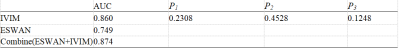
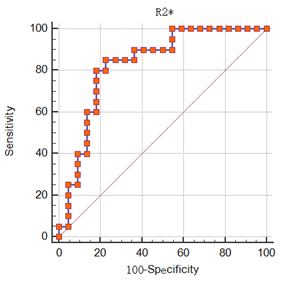
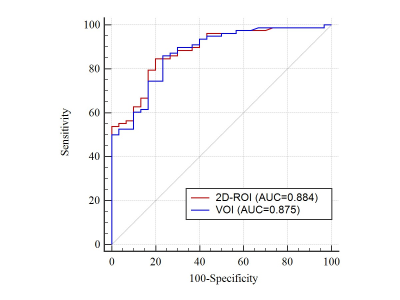
Figure 1. ROC analysis for discriminating malignant tumors from benign lesions
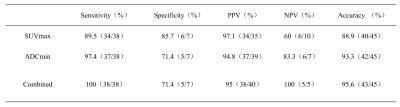
Table 2. Results of ADCmin and SUVmax and the combination of both
-
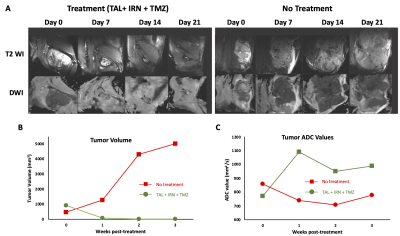
Monitoring tumor microenvironment in a mouse model of pancreatic ductal adenocarcinoma using MRI during early stages of tumor development.
Ravneet Vohra1, Yak-Nam Wang2, Helena Son3, Stephanie Totten2, and Donghoon Lee1
1Radiology, University of Washington, Seattle, WA, United States, 2Applied Physics Laboratory, University of Washington, Seattle, WA, United States, 3Gastroenterology, University of Washington, Seattle, WA, United States
Monitoring tumor microenvironment in the early stages of tumor development.
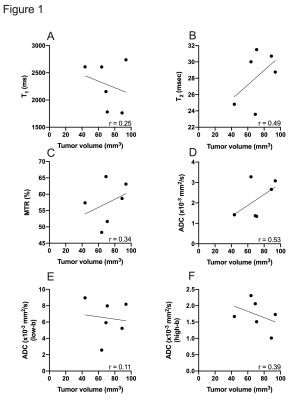
Relationship between tumor volume and different MR parameters.
-
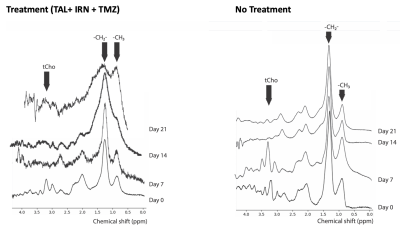
Glutamine depletion alters choline metabolism and reduces survival of pancreatic cancer cells
Noriko Mori1, Balaji Krishnamachary1, Yelena Mironchik1, and Zaver M. Bhujwalla1,2,3
1The Russell H. Morgan Department of Radiology and Radiological Science, The Johns Hopkins University, Baltimore, MD, United States, 2The Sidney Kimmel Comprehensive Cancer Center, The Johns Hopkins University, Baltimore, MD, United States, 3Department of Radiation Oncology and Molecular Radiation Sciences, The Johns Hopkins University School of Medicine, Baltimore, MD, United States
Glutamine (Gln) addiction in pancreatic ductal adenocarcinoma (PDAC) is mediated by oncogenic Kras. Here, for the first time, we identified alterations in choline metabolism with Gln depletion, and confirmed the importance of Gln in PDAC cell survival.
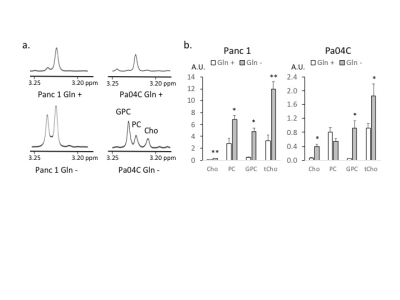
Figure 2: a. Choline metabolite region of representative 1H MR spectra obtained from the aqueous phase of Panc 1 and Pa04C cells. GPC; glycerophosphocholine, PC; phosphocholine, Cho: choline Cells were collected after culturing in Gln +/- medium for 72h. b. Choline metabolite levels in arbitrary unit (A.U.) obtained from 1H MR spectra of the aqueous phase of Panc 1 and Pa04C cells. Values represent mean ± SEM, ** P ≤ 0.01, * P ≤ 0.05 (n=3).
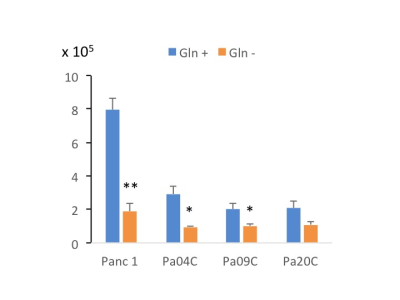
Figure 1: Panc 1, Pa04C, Pa09C and Pa20C cell numbers with or without Gln depletion. ~105 cells were seeded in 6 well plates in triplicates. Cells were cultured in Gln +/- medium for 72h. Cell numbers were quantified with an automated cell counter at the end of the time point. Values represent mean ± SEM, ** P ≤ 0.01, * P ≤ 0.05 (n=3).
-
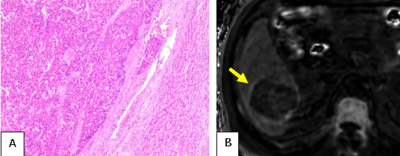
Differentiation of solid pseudopapillary tumor and neuroendocrine tumor of pancreas using enhanced T2 * weighted angiography
Longshuang Wang1, Yi Wang2, Ailian Liu3, and Qinhe Zhang3
1School of Medical Imaging,Dalian Medical University,Dalian, China, Dalian Liaoning, China, 2Department of Radiology, Dalian Friendship Hospital, Dalian, China, Dalian Liaoning, China, 3Department of Radiology, the First Affiliated Hospital of Dalian Medical University, Dalian Liaoning, China
This study measured the ADC and T2 values of the pancreas in T2DM patients and control subjects. Distribution of T2 values were uneven in different locations of pancreas in both T2DM patients and control subjects , and the T2 values in head and neck were higher than those of body and tail.
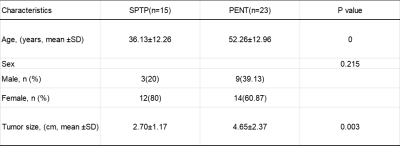
Table 1. Clinical Characteristics of SPTP and PENT
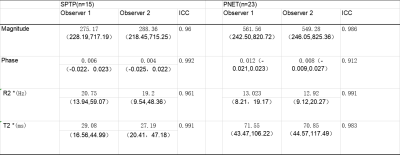
Table 2. Two observers measure lesions the consistency analysis of various parameters
-
Comparison of MR values at 3T and 14T in a mouse model of pancreatic ductal adenocarcinoma.
Ravneet Vohra1, Yak-Nam Wang2, Helena Son3, Stephanie Totten2, and Donghoon Lee1
1Radiology, University of Washington, Seattle, WA, United States, 2Applied Physics Laboratory, University of Washington, Seattle, WA, United States, 3Gastroenterology, University of Washington, Seattle, WA, United States
Comparison of MR values in a mouse model of Pancreatic Ductal adenocarcinoma at 3T and 14T scanners.
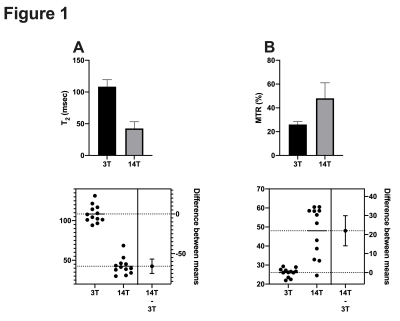
Comparison of 3T and 14T MR values in a tumor model of pancreatic cancer.
-
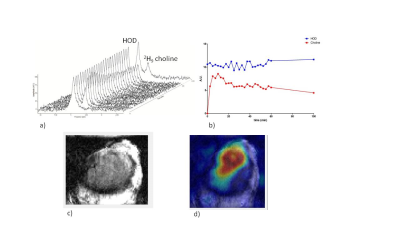
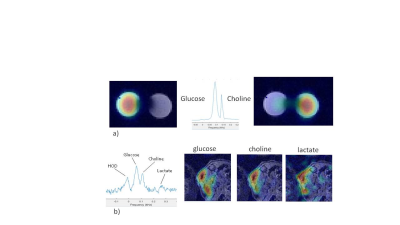
Glutamine transporter downregulation mediates metabolic reprogramming in pancreatic tumors
Raj Kumar Sharma1, Balaji Krishnamachary1, Ishwarya Sivakumar1, Yelena Mironchik1, Marie-France Penet1, Paul T Winnard Jr.1, Santosh K. Bharti1, and Zaver M. Bhujwalla1
1Division of Cancer Imaging Research, The Russell H. Morgan Department of Radiology and Radiological Science, The Johns Hopkins University School of Medicine, Baltimore, MD, United States
SLC1A5 downregulation resulted in significant
reduction in tumor growth. In
tumors, SLC1A5 downregulation resulted in changes in multiple metabolites, these
results expand our understanding of the importance of SLC1A5 in tumor growth that
may lead to additional novel metabolic targets in pancreatic cancer.
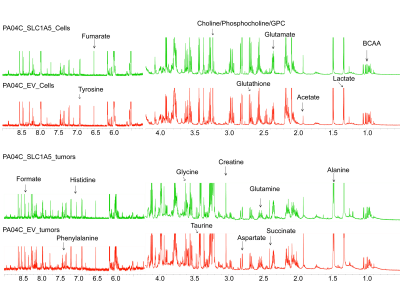
Figure 3. Representative 1H MR spectra
obtained from aqueous phase extracts of Pa04C_EV and Pa04C_SLC1A5 pancreatic
cancer cells and tumors.
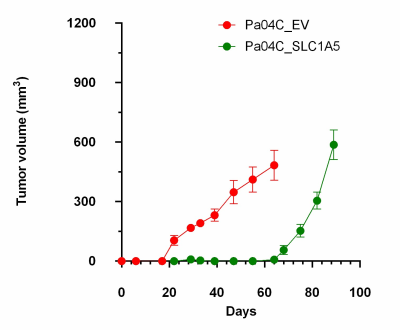
Figure 2. Downregulation of
SLC1A5 significantly delayed Pa04C tumor growth.
-
MRI Role in Evaluation of T staging and Lymphatic metastases for Esophageal Cancer
Yingyu Lin1, Mengzhu Wang2, and Shi-Ting Feng1
1The First Affiliated Hospital, Sun Yat-sen University, Guangzhou, China, 2MR Scientific Marketing, Siemens Healthcare, Guangzhou, China
We
compared MRI with EUS in preoperative T staging and with PET/CT in preoperative
lymphatic metastases of esophageal cancer. In this study, MRI showed higher
sensitivity, specificity and accuracy in T staging, while MRI and PET/CT showed similar performance in lymph nodes evaluation.
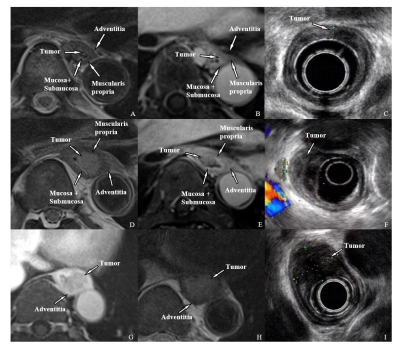
Figure1.
MRI and EUS images of T1-T3 esophageal cancer.
T1:
A-C, T2WI BLADE(A), Enhanced
T1WI
radial
VIBE(B), and EUS(C). The tumor located
in the mucosa and submucosa and protrudes into the lumen without muscularis
propria invasion.
T2:
D-F, T2WI
BLADE(D), Enhanced
T1WI
radial
VIBE(E), and EUS(F). The tumor breaks
through the submucosa and is limited to the muscularis propria.
T3:G-I,
T2WI BLADE(G), Enhanced
T1WI
radial
VIBE(H), and EUS(I). The tumor is
confined to the adventitia.
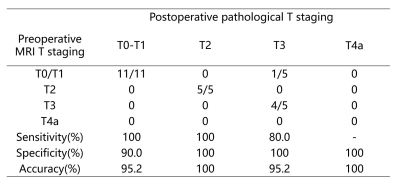
Table
1. Comparison between preoperative MRI and postoperative pathological T staging
-
Pseudo continuous arterial spin labeling perfusion MRI for predicting tumor response to neoadjuvant chemotherapy in advanced rectal cancer
Yoshihiko Fukukura1, Yuichi Kumagae1, Koji Takumi1, Hiroaki Nagano1, Masanori Nakajo1, Kiyohisa Kamimura1, Takashi Iwanaga2, Yuta Akamine3, and Takashi Yoshiura1
1Kagoshima University Graduate School of Medical and Dental Sciences, Kagoshima, Japan, 2Kagoshima University Hospital, Kagoshima, Japan, 3Philips Japan, Minatoku, Japan
Pseudo continuous
arterial spin labeling perfusion MRI may be a
promising non-invasive, inexpensive alternative to dynamic contrast-enhanced MRI for predicting the
treatment response to neoadjuvant chemotherapy for locally advanced rectal cancer.
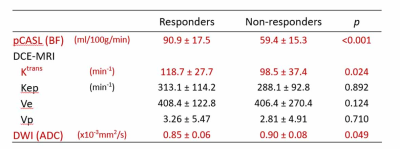
Comparison of BF from pCASL, pharmacokinetic parameters from DCE-MRI, and ADC from DWI between responders and non-responders
-
The value of quantitative T2-mapping in distinguishing rectal tubular adenocarcinoma from non-tubular adenocarcinoma
Yuhui Liu1, AIlian Liu1, Anliang Chen1, Jiazheng Wang2, Geli Hu2, Wan Dong1, Qingwei Song1, Mingxiao Wang1, Xinru Zhang1, and Xinao Wang1
1The First Affiliated Hospital of Dalian Medical University, Dalian, China, Dalian, China, 2Philips Healthcare,Beijing,China, Beijing, China
T2 mapping can be used as a non-invasive
technique to distinguish rectal tubular adenocarcinoma from non-tubular
adenocarcinoma.
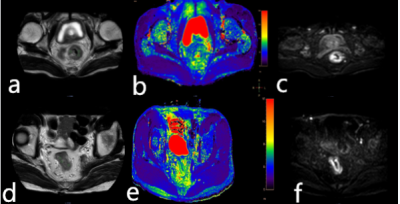
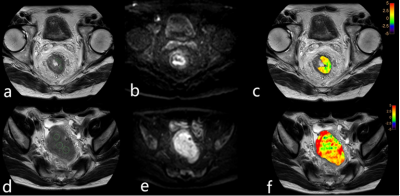
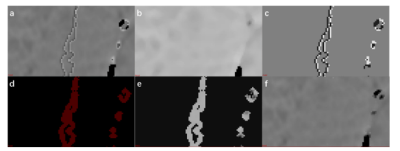
Figure 1 A 77-year-old
male patient with the rectal tubular adenocarcinoma. T2 image (a), T2 mapping
image (b), and DWI image (c) were showed. A 63-year-old male patient with rectal
non-tubular adenocarcinoma. X image (d), T2 mapping image (e), and X image (f)
were showed.
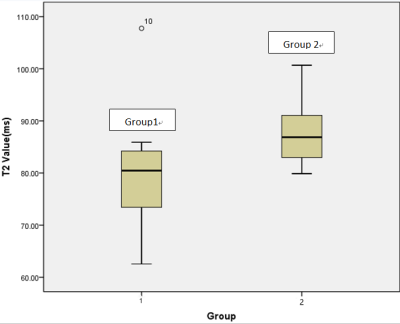
Figure2 T2 values
of rectal tubular adenocarcinoma (group1) and non-tubular adenocarcinoma
(group2) with a significant difference observed (p =0.041).
-
The measurements of APTw in Rectal Cancer: the impact of ROI methods on APTw values and interobserver variability
Xiaoyao Lei1, Yaxin Niu1, Longchao Li1, Min Tang1, Yanrong Yang1, Xiaoling Zhang1, Xin Zhang1, Juan Li1, and Xiuzheng Yue2
1Shaanxi Provincial People's Hospital, Xi-an, China, 2Philips Healthcare, Beijing, China
This study showed that whole volume ROI method was reproducible and could reflect the pathophysiological condition of the tumor.
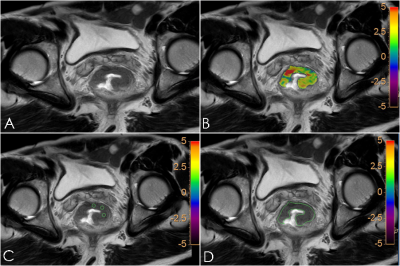
Fig.1 A61-year-old male patient with rectal cancer. T2W image (A), APTw-T2WI fusion image (B), small solid samples methodimage (C) and single slice ROI methodimage (D) showed the lesion in rectal.
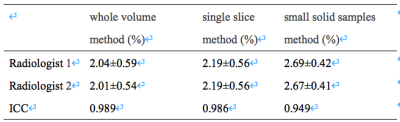
Table 1 The consistency of APTw parametersby two radiologists.
-
Feasibility of quantitative T2 mapping imaging in the diagnosis and chemotherapy response tracking of rectal cancer
Yunxing Tang1, Ailian Liu1, Jiazheng Wang2, Zhiwei Shen2, Yunsong Liu1, Yuhui Liu1, Anliang Chen1, and QingWei Song1
1The First Affiliated Hospital of Dalian Medical University, Dalian, China, 2Philips Healthcare, Beijing, China
T2 values were significantly
higher in rectal cancer than those in the healthy rectal wall, and significantly
increased after chemotherapy. Quantitative T2 mapping might be a promising non-invasive method in the diagnosis
and chemotherapy response tracking of rectal cancer.
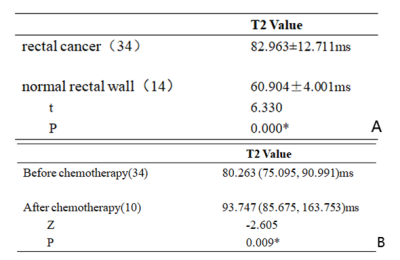
Table 3. Comparison of T2 values in rectal cancer and healthy rectal wall(A);
Comparison of T2 values in rectal
cancer before and after chemotherapy(B)
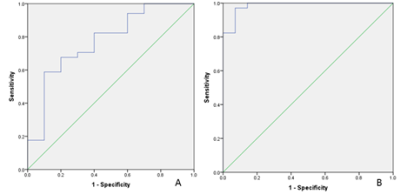
Figure
2. The AUC of T2 mapping values to
distinguish rectal cancer before and after chemotherapy was 0.774 with sensitivity
of 0.588 and specificity of 0.900 and the feasible threshold was 81.738 (A). The
AUC of T2 mapping values to distinguish normal rectal wall and
rectal cancer was 1 with sensitivity of 0.971 and specificity
of 0.929 and the feasible threshold was 66.183 (B).
-
The combination of T2 mapping and diffusion kurtosis imaging (DKI) enhances the diagnosis of rectal cancer with and without vascular invasion
Deshuo Dong1, Ailian liu1, Jiazheng Wang2, Peng Sun2, Anliang Chen1, Wan Dong1, Yuhui Liu1, Qingwei Song1, and Renwang Pu1
1Radiology, The First Affiliated Hospital of Dalian Medical University, Dalian, China, 2Philips Healthcare, Beijing, China
This
study showed that T2 mapping combined with DKI had a better performance in the differential
diagnosis of rectal
cancer with and without vascular invasion.
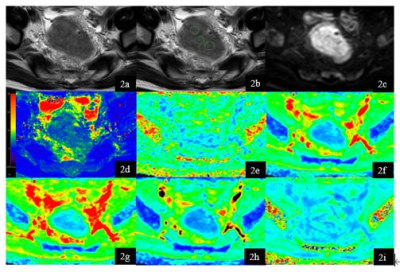
Figure 2. A 65-year-old
male rectal cancer patient without vascular invasion. T2W (1a), T2W with
ROI s(1b), DWI (1c), T2 mapping (1d) , FA (1e) , MD (1f), Da (1g), Dr (1h) , MK
(1i) map. Three ROIs of rectal cancer were showed on T2W image. Average T2, FA,
MD, Da , Dr, MK values of the three ROI were 83.85ms, 0.251, 0.705um2
ms−1, 0.725 um2 ms−1, 0.612
um2 ms−1, 0.419.
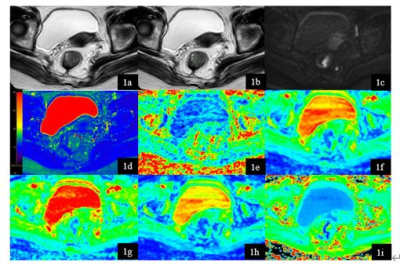
Figure 1. A 74-year-old
female rectal cancer patient with vascular invasion. T2W (1a), T2W with
ROI s(1b), DWI (1c), T2 mapping (1d) , FA (1e) , MD (1f), Da (1g), Dr (1h) , MK
(1i) map. Three ROIs of rectal cancer were showed on T2W image. Average T2, FA,
MD, Da , Dr , MK values of the three ROI were 80.47ms, 0.302, 1.013 um2
ms−1, 1.313 um2 ms−1, 0.866
um2 ms−1, 2.400.
-
Deep Learning Denoising to Accelerate Diffusion-Weighted Imaging of Rectal Cancer
Mohaddese Mohammadi1, Elena Kayee1, Youngwook Kee1, Jennifer Golia Pernicka 2, Iva Petkovska2, and Ricardo Otazo 2
1Medical physics, Memorial Sloan Kettering Cancer Center, New York, NY, United States, 2Memorial Sloan Kettering Cancer Center, New York, NY, United States
Both the denoised high b-value image and resulting denoised ADC map compare favorably to the original noisy results and approximate the results obtained with the reference image. This result indicates that accelerating rectal DWI by reducing the number of acquired averages is feasible.
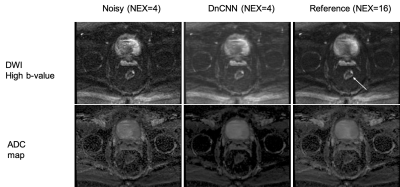
Figure 3. High b-value DWI and apparent diffusion coefficient (ADC) for noisy (NEX=4), denoised DnCNN (NEX=4), and reference (NEX=16). DnCNN denoises the original NEX=4 images and provides results that are closer to the reference (NEX=16). The arrow is pointing to the tumor location.
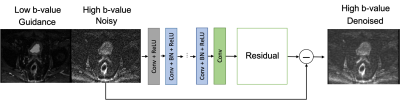
Figure 2. Application to the DnCNN to a test case. The inputs are the high b-value noisy image to be denoised and the low b-value image used for guidance. The estimated residual noise is subtracted from the noisy image to generate the denoised image.
-
Deep Learning Segmentation of Rectal Cancer on MRI
Endre Grøvik1,2, Darvin Yi3, Franziska Knuth4, Sebastian Meltzer5, Anne Negård5, and Kathrine Røe Redalen4
1Department for Diagnostic Physics, Oslo University Hospital, Oslo, Norway, 2Faculty of Health Sciences, University of South-Eastern Norway, Drammen, Norway, 3University of Illinois at Chicago, Chicago, IL, United States, 4Norwegian University of Science and Technology, Trondheim, Norway, 5Akershus University Hospital, Lørenskog, Norway
Our deep learning model demonstrates high performance in detecting and segmenting rectal cancers, equivalent to that of an expert reader. This work show the potential use of deep learning-based segmentation in a clinically relevant setting.
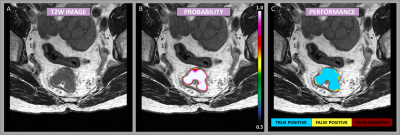
Figure
1: Example case showing the segmentation performance from the DeepLab V3
network. The image mosaic shows the T2-weighted image-series [A], the
predictions as probability maps [B] (voxel-wise ranging from 0.5 to 1 as
indicated by the color bar), and performance maps [C] classified as true
negative, false positive, and false negative as specified by the color code.

Table 1: Detection and segmentation performance
-
The effects of different manual segmentation on High-Resolution T2WI Based-Radiomics in the Preoperative T Staging of Rectal Cancer
Haidi LU1, Fu Shen1, Yuwei Xia2, and Jianping Lu1
1Changhai Hospital, Shanghai, China, 2Huiying Medical Technology Co., Ltd., Beijing, China
To investigate the different segmentation of radiomics analysis for the preoperative T staging based on
high-resolution T2WI. The result demonstrated
that differences in delineation of VOIs affected radiomics analysis.
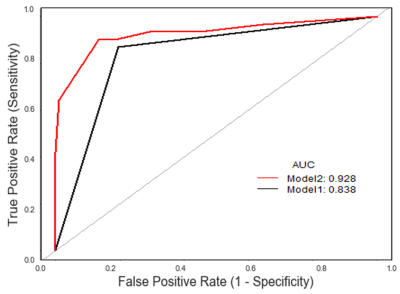
Figure 2. The ROC curves for two different methods.
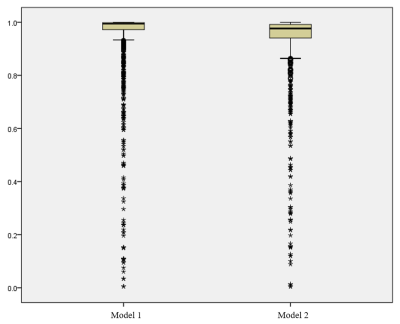
Figure 1. The intra-observer analysis of the segmentation.
-
The Value of Multiparametric Diffusion-Weighted Imaging in the Preoperative T Staging of Rectal Cancer
Fu Shen1 and Shaotinng Zhang1
1Changhai Hospital, Shanghai, China
Dt(P=0.042), Dapp(P=0.041), Kapp(P=0.001), ADC(P<0.0001)were correlated with T staging. The AUC of ROC curve of the combined model was 0.896, the specificity was 75.79%, and the sensitivity was 87.50%. The combined model was valuable in evaluating of preoperative T staging of rectal cancer.
A case of multi parameter combined model
-
AI Methods for Predicting Sensitivity of Total Neoadjuvant Treatment (TNT) in Rectal Cancer Based on Multiparameter MRI and Clinical Data
Ganlu Ouyang1, Zhebin Chen2,3, Jitao Zhou1, Meng Dou2,3, Xu Luo2,3, Han Wen2,3, Yu Yao2,3, and Xin Wang1
1Department of Radiation Oncology, Cancer Center, West China Hospital, Sichuan University, Chengdu, China, 2Chengdu Institute of Computer Application, Chinese Academy of Sciences, Chengdu, China, 3University of Chinese Academy of Sciences, Beijing, China
We
have built models for predicting sensitivity of neoadjuvant
chemoradiotherapy for rectal cancer based on MRI and clinical data base AI method. The model stratified patients into different sensitivity and response
groups that potentially might be used to guide selection of therapy regimes.
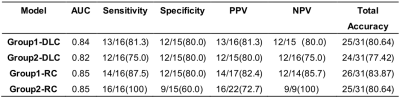
Table 2 Performance of models.
Abbreviations:
ACC, accuracy; AUC, the mean area under the ROC
curve; PPV, positive predictive value; NPV, negative predictive value
(NPV); DLC, deep learning-clinical model; RC, radiomics-clinical model.
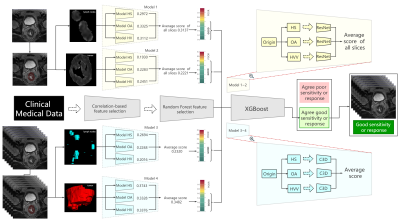
Figure 3 Flow chart and structure of deep learning-clinical model (DLC).
ROIs are
processed as heterogeneity in shapes (HS), heterogeneity in voxel values (HVV)
and overall appearance (OA), which represents the characteristics of ROI,
shape of ROI, ROI + perROI (5-pixel-circum surrounding ROI) respectively. Six ROIs are analyzed using six ResNet9 models and C3D8
models respectively. Average of scores are ensemble score,
two for ResNet9 and another two for C3D8. Outputs of the four deep learning models are combined with
clinical features to predict the final result using XGBoost11.
-
Multiparametric MRI of rectal cancer patients for early detection of therapeutic efficacy of neoadjuvant radio-chemotherapy
Martin Buechert1 and Arnd-Oliver Schäfer2
1Medizinische Fakultät, Universität Freiburg, Freiburg, Deutschland, Radiologische Klinik, Medizinphysik, Universitätsklinikum Freiburg, Freiburg, Germany, 2Klinik für Radiologie, Klinikum St. Georg Leipzig, Leipzig, Germany
Significant changes of tumor properties during and after neoadjuvant
radiochemo therapy are observed in DCE- as well as in DWI-MRI applied before,
48hours, 2, 4 and 12 weeks after treatment start in 55 patients with locally advanced
rectal cancer.
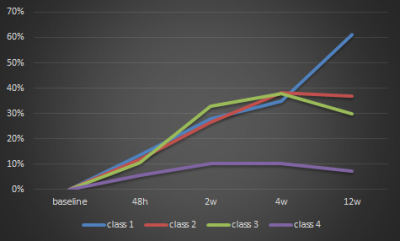
Fig. 2 Percentage change of ADC over time for the 4 patient groups. Patients with
no or minimal regression (class 1-3) show an strong increase in ADC over the
time, while patients with strong regression (class4) only showed a minimal
increase followed by a slight decrease of ADC over time.
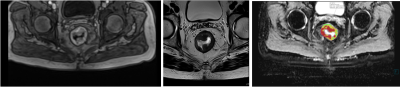
Fig. 1 T1- (left),
T2-weighted (center) and ADC (right) image of patient with advanced rectum
carcinoma.