-
General factors of white matter microstructure in the newborn human brain
Kadi Vaher1, Paola Galdi1, Manuel Blesa Cabez1, Gemma Sullivan1, Gill Black1, David Q Stoye1, Alan J Quigley2, Michael J Thrippelton3, Simon R Cox4, Mark E Bastin3, Debby Bogaert5, and James P Boardman1
1MRC Centre for Reproductive Health, University of Edinburgh, Edinburgh, United Kingdom, 2Department of Paediatric Radiology, Royal Hospital for Sick Children, Edinburgh, United Kingdom, 3Centre for Clinical Brain Sciences, University of Edinburgh, Edinburgh, United Kingdom, 4Lothian Birth Cohort Studies group, Department of Psychology, University of Edinburgh, Edinburgh, United Kingdom, 5Centre for Inflammation Research, University of Edinburgh, Edinburgh, United Kingdom
Applying PCA to tract-averaged diffusion MRI metrics reveals
substantial shared variance within and between DTI and NODDI metrics across 16
major white matter tracts in a neonatal population. This property enables
derivation of general factors, which associate with preterm birth.
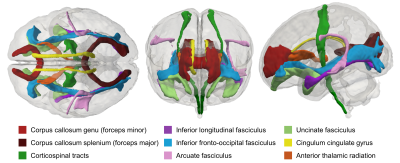
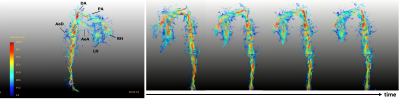
Figure 1. Visual
representation of the delineated white matter tracts in the neonatal atlas
space. Shown in superior (left), anterior (centre) and lateral (right) views.
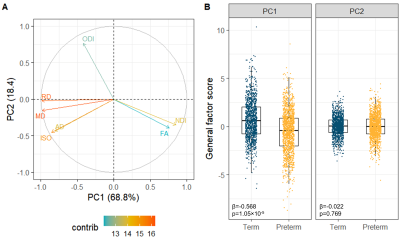
Figure 3. Multimodal
general factors. (A) PCA variable contribution plot; the colours represent the
contribution of the dMRI metric to the components. (B) Boxplots of the
multimodal g-factors showing differences between the term and preterm group.
Note that each participant is represented by 16 tracts. Reported statistics are
standardised β for the PC1 or
PC2 from linear mixed effect regression models and FDR-corrected p-values.
-
Learning 3D structures from 2D slices with scan-specific data for fast and high-resolution neonatal brain MRI
Yao Sui1,2, Onur Afacan1,2, Ali Gholipour1,2, and Simon K Warfield1,2
1Harvard Medical School, Boston, MA, United States, 2Boston Children's Hospital, Boston, MA, United States
We developed a methodology that enables learning 3D gradient structures from 2D slices for an individual subject without the need for large, auxiliary high-resolution datasets, and achieved high-quality neonatal brain MRI at an isotropic resolution of 0.39mm with six minutes of imaging time.
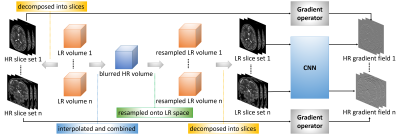
Design of our learning algorithm. The LR volumes are decomposed onto HR 2D slice stacks in the direction of slice selection, and their gradients are used as the output of the convolutional neural network (CNN) in the learning. On the other hand, all LR volumes are interpolated and combined into a blurred HR volume that is then resampled onto the LR image spaces to obtain the LR 2D slice stacks as the network input.
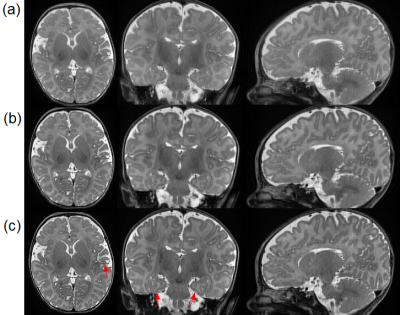
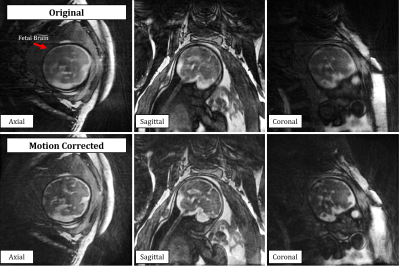
Reconstructed slices from a representative subject by our approach and the baselines on the clinical dataset. (a) SRCNN. (b) GGR. (c) Our approach (deepGG). Our approach achieved the highest quality in terms of image contrast and sharpness. The fine structures delineated by our approach are highlighted by the red arrows, in particular from the hippocampus in the coronal plane.
-
Relationship between brain temperature and prognosis during hypothermia in newborns with hypoxic-ischemic encephalopathy
Moyoko Tomiyasu1,2, Jun Shibasaki3, Yasuhiko Terada4, Katsuaki Toyoshima3, Tatsuya Higashi1, Takayuki Obata1, and Noriko Aida2
1Department of Molecular Imaging and Theranostics, National Institute for Quantum and Radiological Science and Technology, Chiba, Japan, 2Department of Radiology, Kanagawa Children’s Medical Center, Yokohama, Japan, 3Department of Neonatology, Kanagawa Children’s Medical Center, Yokohama, Japan, 4Institute of Applied Physics, University of Tsukuba, Tsukuba, Japan
The brain
temperature of neonates with hypoxic-ischemic encephalopathy was significantly
different during and after hypothermia, but was not significantly different
between favorable and adverse outcomes evaluated by neurodevelopmental testing at
18–22 months of age.
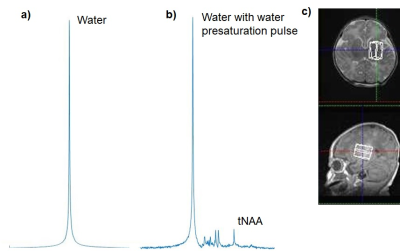
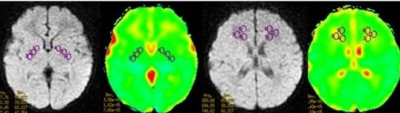
Figure 1. Representative in vivo proton MR spectra
for the deep gray matter obtained from a neonate with hypo-ischemic
encephalopathy: a) without and b) with water presaturation pulse in PRESS
sequence (TE/TR = 30/5000 ms). Scales of a) and b) are not proportional. c) White
voxel on the images show MR spectroscopy volumes of interest. tNAA =
N-acetylaspartate and N-acetylaspartylglutamate.
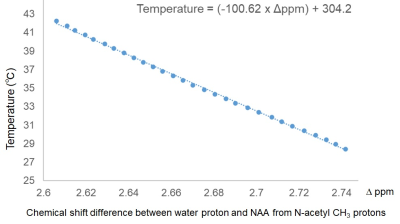
Figure
2. Calibration curve obtained from NAA aqueous solution.
-
Association between multi-modal term MRI biomarkers and early cerebral palsy risk in very preterm infants
Julia E. Kline1, Weihong Yuan1, Karen Harpster1, and Nehal A. Parikh1
1Cincinnati Children's Hospital Medical Center, Cincinnati, OH, United States
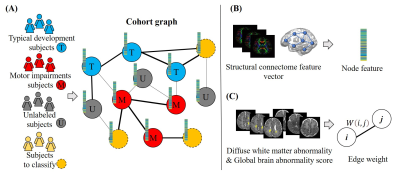
Very preterm infants are at high risk for motor impairments, such as cerebral palsy. Graph theory metrics from term diffusion MRI connectomes and cortical surface area and subcortical volumes derived from term structural MRI are associated with the early diagnosis of cerebral palsy.
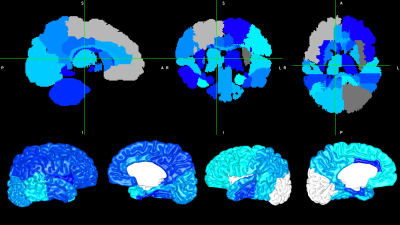
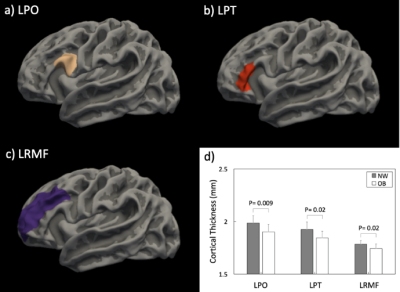
Figure 3: Subcortical and cortical volumes (top) and cortical surface area (bottom) for regions that were negatively associated with early diagnosis of cerebral palsy are shown in blue (shade is arbitrary). Grey/white regions are not significant.
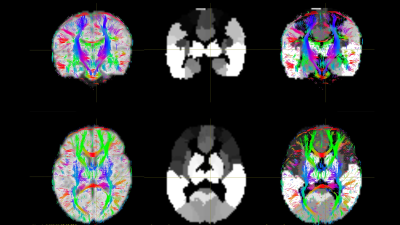
Figure 1: Alignment (3rd column) of the 90-region Automated Anatomical Labeling atlas (2nd column) with diffusion space tractography (1st column) for an example subject. From here, we calculate the mean fractional anisotropy for all streamlines connecting each regional pair as a 90x90 symmetrical matrix.
-
Optimizing Brain Injury Biomarkers in a piglet model of Neonatal Encephalopathy: combining perfusion with proton MRS
Hillary Idogwu1, Magdalena Sokolska2, Pang Raymand 3, Saiful Islam4, Christopher Meehan 3, Adnan Avdic-Belltheus 3, Kathryn Marinello 3, Ingran Lingam 3, Tatenda Mutshiya 3, Alan Bainbridge 2, Nikki Robertson 3, David Thomas1, and Xavier Golay1
1Brain Repair and Rehabilitation, Institute of Neurology, UCL Queen Square Institute of Neurology, London, United Kingdom, 2Medical Physics and Biomedical Engineering, UCLH NHS Foundation Trust, London, United Kingdom, 3Neonatology, UCL EGA Institute for Women's Health, London, United Kingdom, 4UCL Queen Square Institute of Neurology, London, United Kingdom
In this work, we hypothesised that the combination of CBF with BGT Lac/NAA would be more closely associated with quantitative cell death than either alone after HI or inflammation sensitized injury in a piglet model undergoing a variety of neuroprotective interventions.
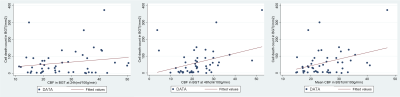
Figure 1. Plots of correlation of 24h, 48h and average CBF with Cell death in BGT. (CBF = cerebral blood flow, BGT = basal ganglia thalamus)
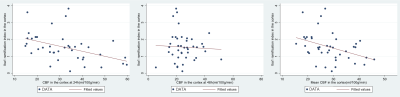
Figure 2. Plots of correlation of 24h, 48h and average CBF with Iba1 ramification index in the cortex. Iba1 = ionized calcium binding adaptor molecule 1 (CBF = cerebral blood flow)
-
Brain asymmetry and development of healthy preterm infants within half-year-old: a diffusion MRI study based on ROI and fixel methods
Tingting Liu1, Weihao Zheng1, Yuqing You2, Ying Lv2, Weijun Chen2, Zhiyong Zhao1, Fusheng Gao2, Hongxi Zhang2, Chai Ji2, and Dan Wu1
1ZheJiang University, Hangzhou, China, 2Children's Hospital, ZheJiang University School of Medicine, Hangzhou, China
Most
brain regions showed significant asymmetry and the asymmetry changed with brain
development. The MD-based LI showed an center-versus-peripheral pattern, and contrast
function lateralization with adult. Consistent leftward lateralization in white
matter was observed.
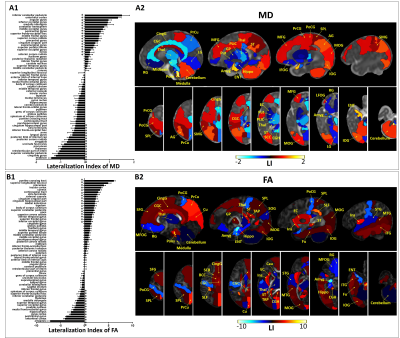
Figure 1.
Regions with significant left/right difference after multiple comparison
correction, based on MD (A) and FA (B). LIs of all 63 regions were plotted on
the left (A1 and B1), with the positive values indicating leftward asymmetry
and negative values indicating rightward asymmetry. *p < 0.05 by pairwise
t-test. Regions with significant asymmetry were overlaid on the corresponding
MD and FA maps in sagittal and axial views, with the color bar indicating the LI.
Positive values (red) represented leftward asymmetry, and negative values (blue)
represented rightward asymmetry.
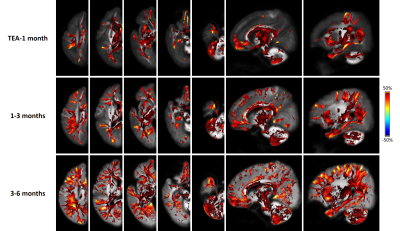
Figure 4.
FBA revealed extensive WM regions with significant asymmetry in terms of FDC.
The three rows from top to bottom show results for TEA-1month, 1-3 months, 3-6
months, respectively. The color bar indicates the LI, with positive values (red)
represent leftward asymmetry, and negative values (blue) represent rightward
asymmetry. A clear inside-to-outside developmental change can be
identified, with the lateralization primarily localizes in the central brain
and major WM at TEA, but extend to peripheral and subcortical WM at 1-3 months which
further increased at 3-6 months.
-
Accounting for Measurement Noise in a Multi-Site Newborn Diffusion Weighted Imaging Study
Jerod M Rasmussen1, Alice M Graham2, Pathik D Wadhwa1, Sonja Entringer3, Martin Styner4, Beatriz Luna5, Thomas G O'Connor6, Damien A Fair7, and Claudia Buss3
1UC Irvine, Irvine, CA, United States, 2Oregon Health Sciences University, Portland, OR, United States, 3Charité – Universitätsmedizin Berlin, Berlin, Germany, 4University of North Carolina, Chapel Hill, NC, United States, 5University of Pittsburgh, Pittsburgh, PA, United States, 6University of Rochester, Rochester, NY, United States, 7University of Minnesota, Minneapolis, MN, United States
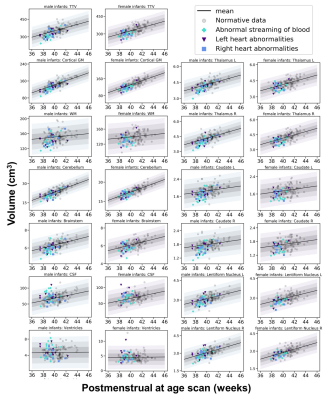
Whether within or across sites, including QC measures greatly increases FAWM variance explained by PMA. Thus, adjustment results in an improved capability for identifying reproducible small-effect size relationships in large multi-site infant imaging studies.
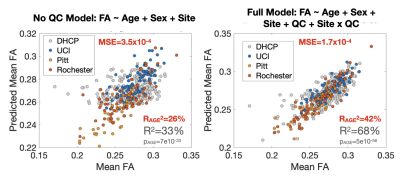
Figure 1. Multi-Site White Matter FA Model Without and With Consideration of Quality Control Measures. QC measures accounted for 47% of the remaining variance in FAWM after adjusting for PMA. Note the decrease in MSE and increase in the remaining variance in FAWM explained by PMA after adjusting for QC measures.
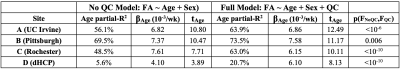
Table 2. Single Site Association Between Whole White Matter FA and Postmenstrual Age at Scan Modeled Without and With Controlling for Quality Control Measures. All sites demonstrated marked improvement in model performance when controlling for simple QC measures (mean FD, SNR, CNR). Improved performance is indicated by increased partial R-square values, t-scores, and increased consistency in age-FA slope estimates across sites. All age-FA associations were significant at a p<10-3 threshold for all models and sites.
-
High resolution diffusion imaging in the unfixed post-mortem neonatal brain
Wenchuan Wu1, Luke Baxter1,2, Eleri Adams2,3, Foteini Andritsou2, Matteo Bastiani1,4,5, Ria Evans Fry2, Robert Frost6,7, Sean Foxley8, Chris Gallagher1, Fiona Moultrie2, Vaneesha Monk2, David Andrew Porter9, Anthony Price10,11, Sebastian W Rieger1,12, Michael Sanders1, Anthony David Edwards11, Joseph V Hajnal10,11, Rebeccah Slater*1,2, and Karla L Miller*1
1Wellcome Centre for Integrative Neuroimaging, Nuffield Department of Clinical Neurosciences, University of Oxford, Oxford, United Kingdom, 2Department of Paediatrics, University of Oxford, Oxford, United Kingdom, 3Newborn Care Unit, John Radcliffe Hospital, Oxford University Hospitals NHS Foundation Trust, Oxford, United Kingdom, 4Sir Peter Mansfield Imaging Centre, School of Medicine, University of Nottingham, Nottingham, United Kingdom, 5NIHR Biomedical Research Centre, University of Nottingham, Nottingham, United Kingdom, 6Athinoula A. Martinos Center for Biomedical Imaging, Massachusetts General Hospital, Charlestown, MA, United States, 7Department of Radiology, Harvard Medical School, Boston, MA, United States, 8Department of Radiology, University of Chicago, Chicago, IL, United States, 9Imaging Centre of Excellence, College of Medical, Veterinary & Life Sciences, University of Glasgow, Glasgow, United Kingdom, 10Department of Biomedical Engineering, School of Biomedical Engineering and Imaging Sciences, King’s College London, King’s Health Partners, St. Thomas’ Hospital, London, United Kingdom, 11Centre for the Developing Brain, School of Biomedical Engineering and Imaging Sciences, King’s College London, King’s Health Partners, St. Thomas’ Hospital, London, United Kingdom, 12Department of Psychiatry, University of Oxford, Oxford, United Kingdom
Results from our high-resolution post-mortem neonatal imaging platform demonstrate the ability to resolve features that are less prominent in low-resolution in-vivo data and potentially provide new anatomical insight into the developing brain.
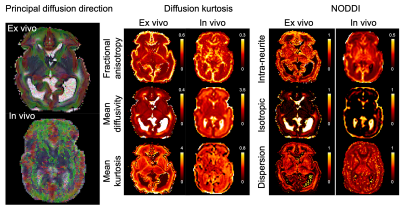
Figure 2. Diffusion kurtosis and NODDI parameters from the post-mortem infant and an age-matched in vivo infant. The mean diffusivity is expressed in μm2/ms.
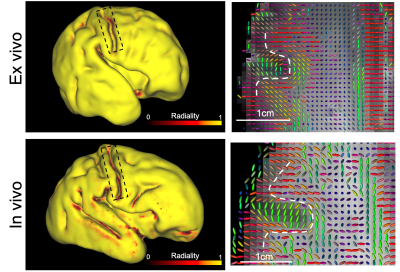
Figure 3. Left: Cortical radiality (dot product of principal diffusion direction and surface normal vector) of post mortem infant and an age-matched in vivo infant, calculated at mid-thickness. At the fundus of the central sulcus (black box), the post mortem data have high radiality but the in vivo data have low radiality. Right: principal diffusion directions for an axial plane containing central sulcus, the dashed white line indicates the grey white matter boundary. The principal diffusion directions at the fundus are radial in the post-mortem data but tangential in the in vivo data.
-
Grading of pediatric intracranial tumors: are intravoxel incoherent motion and diffusion kurtosis imaging superior to conventional DWI?
dejun she1, dairong cao1, shan lin1, zhongshuai zhang2, and Robert Grimm3
1The First Affiliated Hospital of Fujian Medical University, Fujian Fuzhou, China, 2SIEMENS healthcare diagnostic imaging, Shanghai, Pudong, Zhouzhu Highway 278, China, 3SIEMENS Healcare, Erlangen, Germany
To explore the correlations between parameters derived from conventional
diffusion-weighted imaging (DWI), intravoxel incoherent motion (IVIM), and
diffusion kurtosis imaging (DKI) with histopathologic features of pediatric
intracranial tumors.
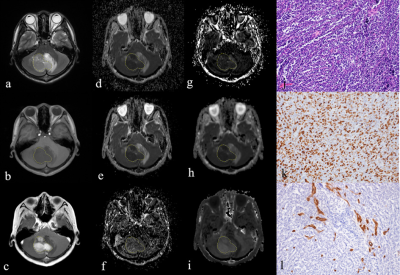
A 15-year-old boy with medulloblastoma in cerebellum (WHO grade Ⅳ). The lesion shows hyperintense on T2-weighted image(a), hypointense on
T1-weighted image (b), and enhancement on post-contrast T1-weighted image (c).
The lesion (ROI) demonstrates hypointense on the ADC map (d), D map (e), and Dk
map (h), and hyperintense on the D* map (f), f map (g), and K map (i). The pathologic
diagnosis was medulloblastoma with high cellularity of
4928(cell/mm2)(j), high Ki-67 index of 80% (k), and MVD of 1.4% (l) (magnification,
× 200).
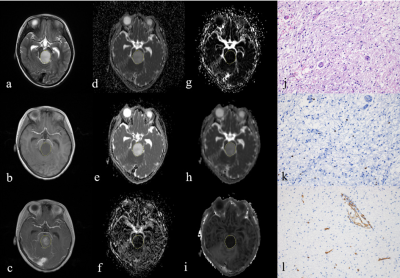
A 5-year-old boy with diffuse astrocytoma in brainstem
(WHO grade II). The lesion shows
hyperintense on T2-weighted image(a), hypointense on T1-weighted image (b), and
enhancement on post-contrast T1-weighted image (c). The lesion (ROI)
demonstrates hyperintense on the ADC map (d), D map (e), and Dk map (h), and
hypointense on the D* map (f), f map (g), and K map (i). The pathologic diagnosis was diffuse astrocytoma with
high cellularity of 1918(cell/mm2)
(j), high Ki-67 index of 1.1% (k), and MVD of 0.9% (l) (magnification, × 200).
-
Quantitative susceptibility mapping of the brain in neonates and infants
Sayo Otani1, Yasutaka Fushimi1, Satoshi Nakajima1, Akihiko Sakata1, Takuya Hinoda1, Sonoko Oshima1, Krishna Pandu Wicaksono1, Hiroshi Tagawa1, Yang Wang1, and Yuji Nakamoto1
1Kyoto University Graduate School of Medicine, Kyoto, Japan
We
evaluated magnetic susceptibility of a large number of pediatric subjects. Our
study showed that magnetic susceptibility of the basal ganglia and thalamus
increased with chronological age from birth to 2 years using volume-of-interest
analysis.
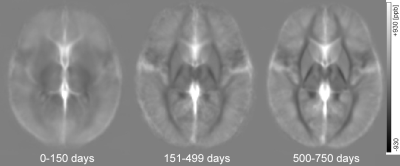
Figure 1. Averaged QSM maps for neonates
and infants with chronological age (CA) of 0-150 days, 151-499 days and 500-750
days. Magnetic susceptibility of the basal ganglia and thalamus increases with
age.
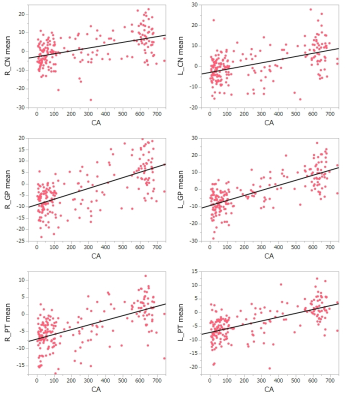
Figure 2. Scattered
plots of magnetic susceptibility of the basal ganglia and chronological age. Magnetic
susceptibility of the CN, GP and PT correlates with chronological age (CA).
-
Mapping developmental trajectories of the cortex and its adjacent white matter for preterm neonates using DTI
Shiyu Yuan1, Jingda Yang1, Mengting Liu1, Duan Xu2, James Barkovich2, and Hosung Kim1
1USC Stevens Neuroimaging and Informatics Institute, Keck School of Medicine of USC, University of Southern California, Los Angeles, CA, United States, 2Department of Radiology and Biomedical Imaging, University of California, San Francisco, San Francisco, CA, United States
The current results are best understood as increases in cyto- and myeloarchitectural complexity, characterized as DTI MD and FA changes, starting in the central region and propagating to other cortical regions with rapid elongation of dendrites and extensive expansion with maturation axons.
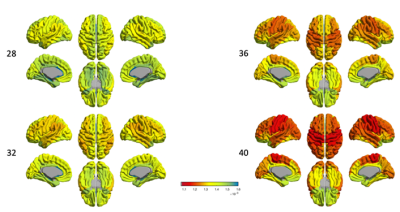
Fig. 1 spatiotemporal_MD_GM
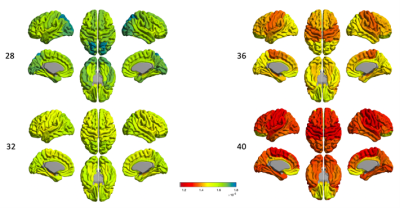
Fig. 2 spatiotemporal_MD_sWM
-
Disentangling neurite and soma contributions to cortical microstructural development in vivo
Sila Genc1, Maxime Chamberland1, Gareth Ball2, Erika Raven1, Isobel Ward1, Chantal Tax1, Marco Palombo3, and Derek Jones1
1Cardiff University Brain Research Imaging Centre (CUBRIC), Cardiff University, Cardiff, United Kingdom, 2Developmental Imaging, Murdoch Children's Research Institute, Parkville, Australia, 3Centre for Medical Image Computing and Department of Computer Science, University College London, London, United Kingdom
In a sample of children and adolescents aged 8-18 years, we study developmental patterns of cortical microstructure using diffusion MRI. Our findings suggest an increase in neurite signal fraction and orientation dispersion with age, and a decrease in apparent soma radius with age.
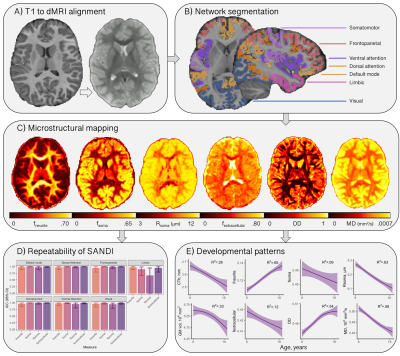
Figure 1: Cortical microstructure processing and analysis framework. A) T1-weighted data corrected for bias field and co-registered to an upsampled b=0 s/mm2 (1x1x1mm); B) T1-weighted data processed using Freesurfer[13,24], registered to MNI space to obtain 7 functionally defined networks[12], and resampled to dMRI space to obtain network labels intersecting the cortical ribbon; C) representative maps of microstructural measures; D) high repeatability of SANDI measures at 300mT/m[9]; E) developmental patterns of macro- and microstructure averaged over the cortical ribbon
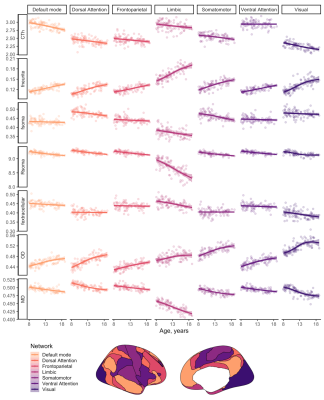
Figure 2: Relationship between cortical microstructure and age, grouped by measure and coloured by network type. Abbreviations: CTh = cortical thickness, in mm; f = signal fraction; MD = mean diffusivity, in 10-3 mm2/s; OD = orientation dispersion; R = apparent radius, in µm. Note: MD was estimated using b=0,6000 s/mm2 to improve sensitisation to cortical microarchitecture[17]
-
Multivariate Associations Among Symptoms, Cognition, Behavior, and White Matter across ADHD and typically developing children
Xuan Bu1,2, Yingxue Gao1, Kaili Liang1, Weijie Bao1, Lu Lu1, Ying Chen1, Lanting Guo3, Qiyong Gong1, Susumu Mori2, and Xiaoqi Huang1
1Radiology Department, Sichuan University, Chengdu, China, 2The Russell H. Morgan Department of Radiology and Radiological Science, Johns Hopkins University School of Medicine, Baltimore, MD, United States, 3Psychiatry Department, Sichuan University, Chengdu, China
Complex ADHD phenotypes are associated with specific patterns of abnormal white matter microstructure during brain development
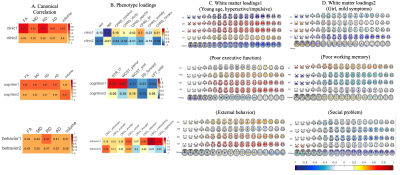
Figure
1. Canonical correlations (A) and loadings (B-D) for each analysis. Colors show
the loading strength of phenotype (B) and white matter (C, D) measures on their
respective latent variates for each canonical correlation analysis. Warmer
colors indicate stronger positive loadings (higher values on an individual
measure); cooler colors indicate stronger negative loadings (lower values on an
individual measure). For clarity, loadings between -0.2 and 0.2 are shown in
white.
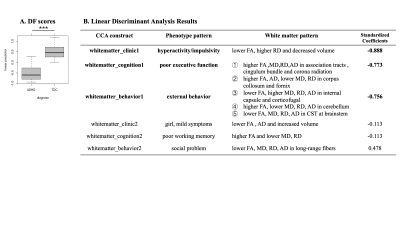
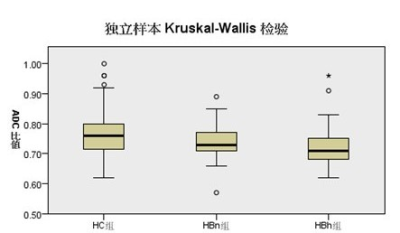
Figure
2 A. Boxplot
for differences in discriminant function between ADHD and TDC. (p<0.001) B. Table shows CCA constructs for each
analysis, the effect they represent, and the standardized coefficients resulted
from the linear discriminant analysis.
-
Increased glutamate + glutamine correlates with altered tactile perception and sensory responsivity in children with autism spectrum disorder
Georg Oeltzschner1,2, Jason He3, Mark Mikkelsen1,2, Alyssa DeRonda4, Deana Crocetti4, Stewart H. Mostofsky4,5,6, Richard A.E. Edden1,2, and Nicolaas A.J. Puts3
1Russell H. Morgan Department of Radiology and Radiological Science, The Johns Hopkins University School of Medicine, Baltimore, MD, United States, 2F. M. Kirby Research Center for Functional Brain Imaging, Kennedy Krieger Institute, Baltimore, MD, United States, 3Department of Forensic and Neurodevelopmental Sciences, Sackler Institute for Translational Neurodevelopment, Institute of Psychiatry, Psychology, and Neuroscience, King's College London, London, United Kingdom, 4Center for Neurodevelopmental and Imaging Research, Kennedy Krieger Institute, Baltimore, MD, United States, 5Department of Psychiatry, The Johns Hopkins University School of Medicine, Baltimore, MD, United States, 6Department of Neurology, The Johns Hopkins University School of Medicine, Baltimore, MD, United States
This study investigates relationships between
sensory impairment in ASD, vibrotactile perceptual thresholds, and edited MRS
measures of GABA and Glx. Results suggest that higher Glx levels in
sensorimotor cortex may be related to abnormal touch perception.
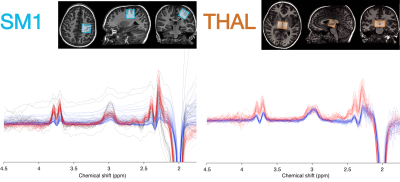
Figure
1: Example voxel placement in the primary sensorimotor cortex (SM1) and thalamus
(THAL), along with respective data. Spectra are color-coded by acquisition
phase: gray = macromolecule-suppressed MEGA-PRESS (Phase 1); blue =
macromolecule-suppressed MEGA-PRESS with prospective frequency correction (Phase
2); red = HERMES (Phase 3).
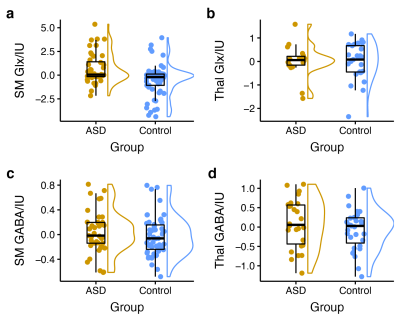
Figure
2: Group comparison of tissue-corrected metabolite
levels (residuals after linear-mixed effects model accounting for age, sex, and
acquisition phase) between children with ASD and typically developing children.
Sensorimotor Glx levels are significantly higher in children with ASD (a),
while no significant group differences were found for thalamus Glx (b),
sensorimotor GABA (c), or thalamus GABA (d).
-
Prenatal maternal distress during the COVID-19 pandemic and its effects on infant brain connectivity
Kathryn Y. Manning1,2,3, Xiangyu Long1,2,3, Lianne Tomfohr-Madsen2,4,5, Gerald Giesbrecht2,4,5,6, and Catherine Lebel1,2,3
1Radiology, University of Calgary, Calgary, AB, Canada, 2Alberta Children's Hospital Research Institute, Calgary, AB, Canada, 3Hotchkiss Brain Institute, Calgary, AB, Canada, 4Psychology, University of Calgary, Calgary, AB, Canada, 5Pediatrics, University of Calgary, Calgary, AB, Canada, 6Community Health Sciences, Calgary, AB, Canada
We investigated the effects of prenatal psychological distress in pregnant Canadian mothers during the COVID-19 pandemic on the developing infant brain. Relatively less mature tracts and lower amygdala-prefrontal functional connectivity were related to higher prenatal distress.
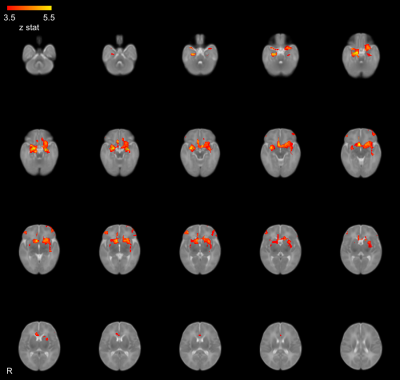
Figure 2: The average amygdala functional connectivity across all subjects coloured by z-statistic.
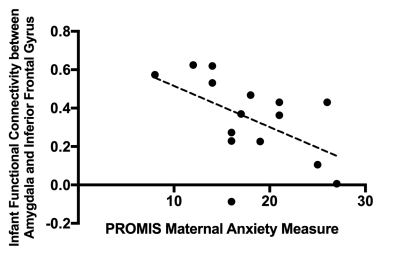
Figure 5: The relationship between the PROMIS maternal anxiety measures and infant amygdala-prefrontal functional connectivity.
-
Orientation dependence of T2 in newborn white matter shows dipole-dipole interaction effects
Lara Bartels1,2, Jonathan Doucette1,2, Christoph Birkl2,3,4, Yuting Zhang5,6,7,8, Alexander Mark Weber2,9, and Alexander Rauscher1,2,9,10
1Department of Physics & Astronomy, University of British Columbia, Vancouver, BC, Canada, 2UBC MRI Research Centre, University of British Columbia, Vancouver, BC, Canada, 3Department of Neuroradiology, Medical University of Innsbruck, Innsbruck, Austria, 4Department of Neurology, Medical University of Graz, Graz, Austria, 5Department of Radiology, Children's Hospital of Chongqing Medical University, Chongqing, China, 6Ministry of Education Key Laboratory of Child Development and Disorders, Chongqing Medical University, Chongqing, China, 7Key Laboratory of Pediatrics in Chongqing, Chongqing Medical University, Chongqing, China, 8Chongqing International Science and Technology Cooperation Center for Child Development and Disorders, Chongqing, China, 9Division of Neurology, Department of Pediatrics, University of British Columbia, Vancouver, BC, Canada, 10Department of Radiology, University of British Columbia, Vancouver, BC, Canada
We show that the tissue orientation dependency of $$$R_2$$$ relaxation in the unmyelinated newborn brain is best described by dipole-dipole interactions. In the absence of myelin, this finding suggests the alignment of water with neurofilaments or microtubuli.
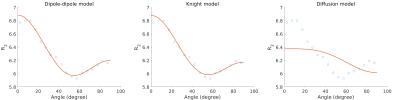
Geometric mean $$$R_2$$$ as a function of fiber angle in newborns and best fits for the dipole-dipole model, the Knight model and the diffusion model.
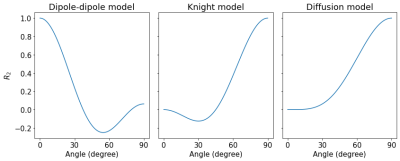
Predictions for the $$$R_2$$$ orientation dependence for the dipole-dipole model, the Knight model and the diffusion model.
-
Early Sensorimotor Tract Integrity and Development of Cerebral Palsy in High Risk Infants
Rahul Chandwani1, Julia Kline1, Karen Harpster2,3,4, Jean Tkach5,6,7, and Nehal Parikh1,2
1Perinatal Institute, Cincinnati Children's Hospital Medical Center, Cincinnati, OH, United States, 2Department of Pediatrics, University of Cincinnati College of Medicine, Cincinnati, OH, United States, 3Division of Occupational Therapy and Physical Therapy, Cincinnati Children's Hospital Medical Center, Cincinnati, OH, United States, 4Department of Rehabilitation, Exercise and Nutrition Sciences, University of Cincinnati College of Allied Health Sciences, Cincinnati, OH, United States, 5Department of Radiology, Cincinnati Children's Hospital Medical Center, Cincinnati, OH, United States, 6Imaging Research Center, Department of Radiology, Cincinnati Children's Hospital Medical Center, Cincinnati, OH, United States, 7Department of Radiology, University of Cincinnati College of Medicine, Cincinnati, OH, United States
Very preterm infants are at high risk of developing motor
impairments such as cerebral palsy. We report macro and microstructural
biomarkers of sensorimotor tract integrity, derived from diffusion MRI at
term-equivalent age, that are associated with the early diagnosis of cerebral
palsy.
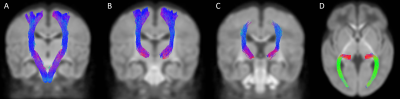
Figure 3. Bilaterally segmented
sensorimotor tracts. (A) corticospinal tract in coronal view; (B) superior
thalamic radiations (motor) in coronal view; (C) superior thalamic radiations (sensory)
in coronal view; (D) posterior thalamic radiations in axial view
*All fibers of the STRS are not
visible in coronal view, as the tract continues from the thalamus to the
post-central gyrus
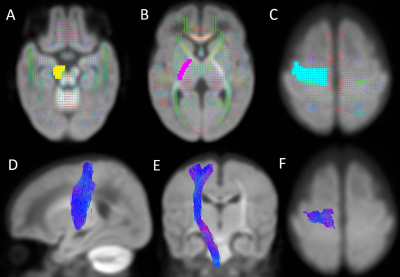
Figure 2. Location of regions of
interest (ROIs) on the group fixel plot and the segmented right corticospinal
tract. (A) Seed point ROI covering the right cerebral peduncle on an axial
view; (B) Waypoint ROI covering the right posterior limb of the internal
capsule on an axial view; (C) Waypoint ROI covering the right precentral gyrus
on an axial view; (D-F) Right corticospinal tract on sagittal, coronal and
axial views, respectively.
-
Breastmilk exposure is associated with improved MRI biomarkers of myelination in preterm infants
Gemma Sullivan1, Manuel Cabez1, Kadi Vaher1, Paola Galdi1, Gill Black1, David Q Stoye1, Alan J Quigley2, Elizabeth N York3, Michael J Thrippleton3, Mark E Bastin3, and James P Boardman1,3
1MRC Centre for Reproductive Health, University of Edinburgh, Edinburgh, United Kingdom, 2Department of Paediatric Radiology, Royal Hospital for Sick Children, Edinburgh, Edinburgh, United Kingdom, 3Centre for Clinical Brain Sciences, University of Edinburgh, Edinburgh, United Kingdom
By combining nutritional data with myelin-weighted imaging, we show that early breast milk exposure after preterm birth is associated with improved white matter myelination at term-equivalent age.
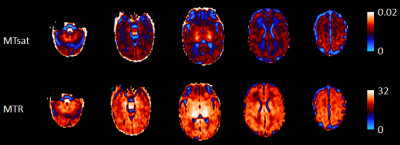
Figure 1. Example neonatal MTsat and MTR parametric maps.
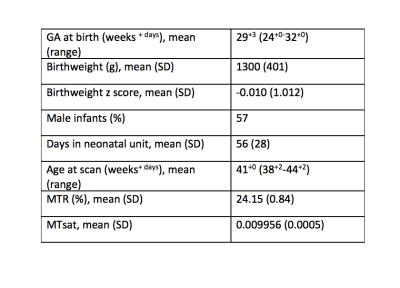
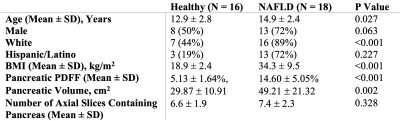
Table 1. Participant demographics.
-
Patterns of De Novo Myelination Identify Functionally Relevant Brain Networks
Sean Deoni1, Lexie Volpe2, Jennifer Beauchemin2, and Viren D'Sa3
1Bill & Melinda Gates Foundation, Seattle, WA, United States, 2Advanced Baby Imaging Lab, Rhode Island Hospital, Providence, RI, United States, 3Pediatrics, Rhode Island Hospital, Providence, RI, United States
Infancy and childhood are important developmental periods of brain and cognitive development. Here we use longitudinal neuroimaging and cognitive measures to delineate functionally-specific structural networks across infancy and early childhood for the first time.
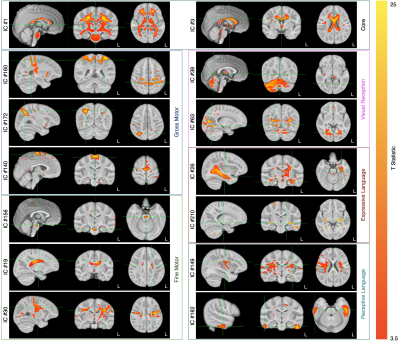
Figure 1. Representative functionally-related and specific IC maps overlaid on the study template.
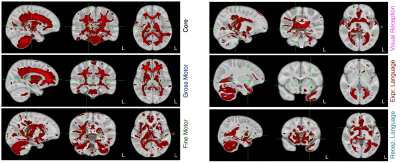
Figure 2. Overlay of the compiled core, fine and gross motor, expressive and receptive language, and visual receptive network masks.
-
Alterations in vascular injury, rsfMRI signal variability and verbal memory in young patients treated with radiation therapy for a brain tumor.
Melanie Morrison1, Sivakami Avadappian1, Angela Jakary1, Erin Felton2, Schuyler Stoller3, Sabine Mueller3, and Janine Lupo1
1Radiology, UCSF, San Francisco, CA, United States, 2UCSF, San Francisco, CA, United States, 3Neurology, UCSF, San Francisco, CA, United States
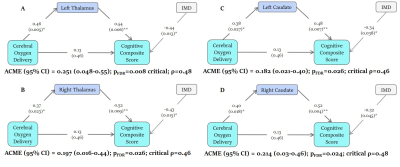
Functional and vascular imaging data can be used together to provide a biomarker of cognition.
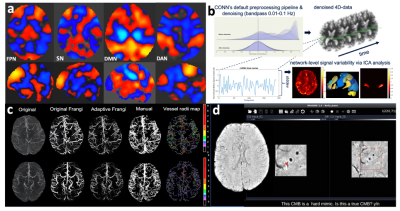
Figure 2: Group-level large-scale brain networks derived from ICA analysis (a; orange = positive correlation, blue = negative correlation; FPN = frontoparietal network, SN= salience network, DMN = default mode network, DAN = dorsal attention network) and the methods for extracting local rsfMRI variability (b), cerebroarterial density (c) and cerebral microbleed (CMB) burden (d).
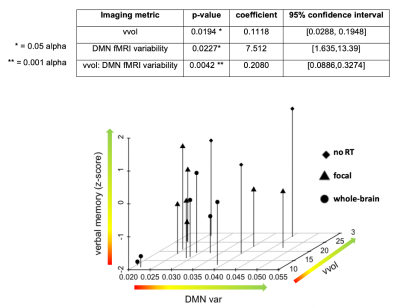
Figure 4: Relationship between imaging parameters and verbal memory performance (dependent variable). DMN var = default mode network variability, vvol= normalized vessel volume.