Spectroscopy: Acq/Recon/Analysis
Cancer/Spectroscopy/Molecular Imaging/Pre-Clinical Tuesday, 18 May 2021

Oral Session - Spectroscopy: Acq/Recon/Analysis
Cancer/Spectroscopy/Molecular Imaging/Pre-Clinical
Tuesday, 18 May 2021 14:00 - 16:00
  • xSPEN spectroscopy: a self-navigated fast chemical shift encoded echo planar imaging acquisition
    Ke Dai1, Hao Chen1, Hongda Shao2, Jianjun Liu2, and Zhiyong Zhang1
    1School of Biomedical Engineering, Shanghai Jiao Tong University, Shanghai, China, 2Departments of Nuclear Medicine, Renji Hospital, School of Medicine, Shanghai Jiao Tong University, Shanghai, China
    We propose an alternative fast magnetic spectroscopy imaging termed as xSPEN spectroscopy. The xSPEN spectroscopy has no limitation of spectral bandwidth, a unique J-decoupled spectrum capability and the robustness to in-plane motion.
    Figure 2 The representative spectra obtained by conventioal EPSI, xSPEN spectroscopy and J-decouped xSPEN spectroscopy from the spatial location marked by the red dot in the phantom using a spectral bandwidth of 1000 Hz(a) and 2000 Hz(b)
    Figure 3 (a) EPSI chemical shift maps from multiplets (b) The map of singlet from J-decoupled xSPEN spectroscopy.
  • Fast Adiabatic Spin-Echo MRSI Sequence for Whole-Brain 5mm-isotropic metabolic imaging
    Antoine Klauser1,2, Sebastien Courvoisier1,2, Michel Kocher1,2, and François Lazeyras1,2
    1Radiology and Medical Informatics, University of Geneva, Geneva, Switzerland, 2CIBM Center for Biomedical Imaging, Geneva, Switzerland
    Whole-brain High-resolution data were measured on volunteers with a 1H 3D Adiabatic Spin-Echo MRSI sequence and compared to FID-MRSI measurement. The overall spectral quality are equivalent but usage of spin-echo enable further spectral editing technique.
    Comparison between 3D metabolite volumes resulting from ADISE-MRSI and FID-MRSI acquisition sequences acquired subsequently in one volunteer. Bottom, two sample spectra at same location for both sequences are shown on the same scale and exhibit a slightly lower signal with ADISE-MRSI sequence, consequence of the longer TE. Signal loss due to B0 inhomogeneity in frontal lobe is present with both sequences.
    Comparison of spectral quality parameters between Fast ADISE-MRSI and FID-MRSI sequences on the same session. Left, the signal loss due to the longer TE for ADISE-MRSI is visible over the whole brain in the SNR map. FWHM maps exhibits no marked difference. Right, the histograms of the Cramer-Rao Lower Bound (CRLB) resulting from both sequences are displayed side to side. Most metabolites show a slight shift towards higher CRLB values for ADISE-MRSI. This is particularly visible for Glu+Gln that are known to be more difficult to quantify at longer TE due to J-coupling modulations.
  • Diffusion-weighted Echo Planar Spectroscopic Imaging Using semi‐LASER Localization at 3T: A Pilot Study
    Manoj Kumar Sarma1,2, Andres Saucedo3, and M. Albert Albert Thomas3
    1Advanced Imaging Research Center, UT Southwestern Medical Center, Dallas, TX, United States, 2Radiology, UT Southwestern Medical Center, Dallas, TX, United States, 3Radiology, UCLA School of Medicine, Los Angeles, CA, United States
    We propose an echo planar-based diffusion weighted spectroscopic imaging using semi‐LASER localization and bipolar diffusion gradient. Initial results show good spectral quality and spatial localization.
    Figure 1: Schematic representation of the DW-sL-EPSI sequence showing RF pulses with bipolar DW gradients placed around the slice selective refocusing HS RF pulses. δ = gradient duration, sum of the durations of four lobes; Δ = diffusion time, time between the first lobe of the dephasing diffusion gradient group and the first lobe of the re-phasing diffusion gradient group. Water suppression was performed with WET. An EPI-based readout was used to capture the k-t data.
    Figure 2: Results from a brain phantom scan. (A) T1-weighted localization image showing the VOI; also shown is the DW-sL-EPSI spectra obtained from the 3x3 region within the VOI at the b-values (B) 36 s/mm2 and (C) 3996 s/mm2.
  • Quantification of Human Brain Metabolites using Two-Dimensional J-Resolved Metabolite-Cycled semiLASER at 9.4 T
    Saipavitra Murali-Manohar1,2, Tamas Borbath1,2, Andrew Martin Wright1,3, and Anke Henning1,4
    1High Field Magentic Resonance, Max Planck Institute for Biological Cybernetics, Tuebingen, Germany, 2Faculty of Science, University of Tuebingen, Tuebingen, Germany, 3IMPRS for Cognitive Neuroscience, Tuebingen, Germany, 4Advanced Imaging Research Center, UT Southwestern Medical Center, Dallas, TX, United States
    2D J-resolved metabolite cycled semiLASER is implemented at 9.4 T in the human brain and the spectral fitting is performed using ProFit2.0 for in vivo data. Quantification of metabolites is performed using internal water referencing after accounting for relaxation effects and tissue content.
    Figure 2: a) Two-dimensional J-resolved MC semiLASER spectrum (TEstart: 24 ms, TR: 6000 ms, $$$n$$$=85, $$$∆t$$$=2 ms) acquired at 9.4T from a Braino phantom. Lactate peaks at 1.31 and 4.09 ppm (maximum separated in the upfield proton spectrum) were considered to calculate reduction in the intensity of the J-refocused peaks according to the equation given in Lin et al17. This resulted in 86% reduction in the intensity and hence, there are barely any J-refocused peaks in the spectrum. b) Two-dimensional J-resolved MC semiLASER spectrum from a representative subject acquired at 9.4T.
    Figure 1: a) 2D J-resolved MC semiLASER sequence implemented at 9.4 T. The excitation and adiabatic pulse bandwidths are 8000Hz. This leads to a chemical shift displacement of 10% between NAA (2.008 ppm) and mI (4.05 ppm). This means that even after accounting for the displacement in all three directions still there is a 73% voxel overlap occurring in the voxels for the two mentioned resonances. b) High-resolution MP2RAGE images showing the voxel positioning for the acquisition of in vivo data. Tissue segmentation resulted in GM/WM/CSF content: 67.3 ± 8.6/ 28.5 ± 8.6/ 3.7 ± 1.5%.
  • GABA measurement at 7T: short-TE or MEGA editing?
    Song-I Lim1,2 and Lijing Xin1,2
    1CIBM Center for Biomedical Imaging, Lausanne, Switzerland, 2Animal Imaging and Technology, EPFL, Lausanne, Switzerland
    The comparison of short-TE and MEGA editing methods and verification of reproducibility of GABA measurement in the motor cortex at 7T.
    Figure 1 MR spectra acquired in the motor cortex using (A) MEGA-sSPECIAL and (B) sSPECIAL sequences. The edit-on, edit-off, and difference spectra are illustrated in (A). The absence of choline peak at 3.2 ppm implies that creatine is completely subtracted and two sub-spectra were well corrected and aligned to each other.
    Table 1 Reproducibility test results for sSPECIAL and MEGA-sSPECIAl sequence.
  • Using selective RF pulses in diffusion-weighted MRS for lactate diffusion measurements with minimal J-modulation
    Eloïse Mougel1, Sophie Malaquin1, Melissa Vincent1, and Julien Valette1
    1Université Paris-Saclay, Commissariat à l'Energie Atomique et aux Energies Alternatives (CEA), Centre National de la Recherche Scientifique (CNRS), Molecular Imaging Research Center (MIRCen), Laboratoire des Maladies Neurodégénératives, Fontenay aux Roses, France
    Diffusion-weighted MR spectroscopy may allow investigating lactate cellular compartmentation in the brain. We investigate the ability of selective pulse to suppress J-modulation and thus provide more robust information on lactate diffusion.
    Figure 2: Stimulated echo spectra comparison for different diffusion-weighting values. A-B) spectra acquired during the same experimental session, respectively with STE using broad pulse (BP) and STE using selective pulse (SP). C-D) Lactate peaks as extracted with LCModel. E) Average S/S0 ratio over four blocks of 32 averages as a function of diffusion weighting (b). F) CoV of S/S0 for each b-value and each metabolites. G) Calculated ADC with STE BP data and STE SP data.
    Figure 4: Stimulated echo using BP versus spin echo using SP. A-B) spectra acquired respectively with STE using BP and SE using SP. C-D) Lactate peaks as extracted with LCModel. E) Average S/S(b=0) = S/S0 ratio over four blocks of 32 averages as a function of diffusion weighting (b). F) CoV of S/S0 for each b-value and each metabolites. G) Calculated ADC with STE BP data and SE SP data.
  • Short-TE ECLIPSE for Macromolecular-Nulled MRSI in the Human Brain
    Chathura Kumaragamage1, Anastasia Coppoli1, Peter B Brown1, Scott McIntyre1, Terence W Nixon1, Henk M De Feyter1, Graeme Mason1, and Robin A de Graaf1
    1Department of Radiology and Biomedical Imaging, Magnetic Resonance Research Center, Yale University, New Haven, CT, United States
    An ECLIPSE-IVS method with a TE = 22.2 ms utilizing GOIA-WURST RF pulses (Tp = 3ms, BW = 15 kHz) was developed for macromolecule-nulled MRSI acquisitions. Results demonstrate robust extracranial lipid suppression with artifact-free metabolic maps.
    Figure 4. MRSI data acquired (TE/TR = 22.2/2500 ms, 10.2 min acquisition time, 1 x 1 cm2 grid) with IR and no-IR methods. (A) The axial slice imaged, with the nine voxel regions overlaid. (B-C) NAA maps from both methods. (D) Voxel locations from the grid illustrated in (A). Both methods demonstrate high quality spectra, despite the overall reduced amplitude with the IR method. The IR data demonstrate minimal macromolecular resonances evident by the flat baseline, compared to the No-IR data.
    Figure 5. Summary of MRSI (TE/TR = 22.2/2500 ms) data in Figure 4 with LCModel fitting of the IR data. (A) The corresponding axial slice image, with four voxel locations marked. (B) LCModel fitting of spectral locations in (A). In each panel the residual, fitted spectra overlaid on the measured spectra, and the baseline are illustrated. (C-F) Metabolic maps referenced to water for NAA, tCr, Ins, and Glx. (G-J) illustrate corresponding CRLB maps for the metabolic maps in (C-F).
  • T2* of human brain metabolites estimated from a single proton MRS acquisition
    Chloé Najac1, Marjolein Bulk1, Hermien E. Kan1, Andrew G. Webb1, and Itamar Ronen1
    1C.J. Gorter Center for High Field MRI, Department of Radiology, Leiden University Medical Center, Leiden, Netherlands
    Quantification of cell-specific brain metabolite T2* values using a set of time-shifted data from a single 1H magnetic resonance spectroscopy acquisition in vivo in the human brain.
    Figure 1: Illustration of the T2* calculation procedure. (A) A set of FIDs with different time-shifts (Δt) was generated (shift between 0ms and 30ms in 5ms interval) by progressively discarding the first points (represented in grey) of the originally acquired FID. (B) FIDs were Fourier transformed (spectra shown in black) and fitted with LCModel (fits shown in red). A basis-set was generated using a Matlab® routine for each Δt. (C) A linear regression was used to fit the logarithm of the signal of five brain metabolites as a function of Δt. T2* values were estimated as -1/slope of the fit.
    Figure 3: (A) Logarithm of the signal of metabolites was quantified at all time-shifts (Δt) and fitted with a linear regression. The data (circle) and fit (black line) for the mean over all participants is shown. The error bars represent the standard deviation over subjects and the dashed grey line indicates the 95% confidence interval. (B) T2* values of five brain metabolites are shown, suggesting lower values in astrocytes cells. Paired Student’s t-test was used to estimate differences (*p< 0.05, ***p< 0.001). The error bars represent the standard deviation over subjects.
  • A method for high quality magnetic resonance spectroscopy of discs during normal breathing
    Frida Johansson1,2, Helena Brisby2,3, Hanna Hebelka2,4, Maria Ljungberg1,2, and Kerstin Lagerstrand1,2
    1Medical Physics and Biomedical Engineering, Sahlgrenska University Hospital, Gothenburg, Sweden, 2Institute of Clinical Sciences, Gothenburg University, Gothenburg, Sweden, 3Department of Orthopaedics, Sahlgrenska University Hospital, Gothenburg, Sweden, 4Department of Radiology, Sahlgrenska University Hospital, Gothenburg, Sweden
    The study shows that respiratory motion affects the disc phase signal and should be taken into consideration when evaluating the disc using MRS. The proposed method improved the quality of the MRS-spectrum and showed feasibility in measuring the molecular disc content during normal breathing.
    Figure 3. Example of spectra without processing (upper) and with the proposed method (lower) where the black line is the modelled peaks. It appears to be less noise with the proposed method.
    Figure 1. Positioning of the volume of interest (red box and the yellow box is the shifted water volume) inside the disc and the four saturation slabs around the disc. Sagittal (left), coronal (middle) and axial (right).
  • NIfTI MRS: A standard format for spectroscopic data
    William T Clarke1, Tiffany Bell2,3,4, Uzay Emir5,6, Mark Mikkelsen7,8, Georg Oeltzschner7,8, Benjamin C Rowland9, Amirmohammad Shamaei10,11, Brian J Soher12, Sofie Tapper7,8, and Martin Wilson13
    1Wellcome Centre for Integrative Neuroimaging, NDCN, University of Oxford, Oxford, United Kingdom, 2Department of radiology, University of Calgary, Calgary, AB, Canada, 3Hotchkiss brain institute, University of Calgary, Calgary, AB, Canada, 4Alberta Children’s Hospital Research Institute, University of Calgary, Calgary, AB, Canada, 5School of Health Sciences, Purdue University, West Lafayette, IN, United States, 6Weldon School of Biomedical Engineering, Purdue University, West Lafayette, IN, United States, 7Russell H. Morgan Department of Radiology and Radiological Science, The Johns Hopkins University School of Medicine, Baltimore, MD, United States, 8F. M. Kirby Research Center for Functional Brain Imaging, Kennedy Krieger Institute, Baltimore, MD, United States, 9Division of Cancer Science, School of Medical Sciences, Faculty of Biology, Medicine and Health, University of Manchester, Manchester, United Kingdom, 10Institute of Scientific Instruments of the CAS, Brno, Czech Republic, 11Department of Biomedical Engineering, Faculty of Electrical Engineering and Communication, Brno University of Technology, Brno, Czech Republic, 12Center for Advanced MR Development, Department of Radiology, Duke University Medical Center, Durham, NC, United States, 13Centre for Human Brain Health and School of Psychology, University of Birmingham, Birmingham, United Kingdom
    An MRS data format standard is proposed to solve the issue of diverse data formats in MRS research. A standard based on an extended NIfTI format will simplify use, analysis of, and dissemination of MRS data.
    Figure 5. NIfTI MRS will be supported from the start by eight MRS analysis packages, covering five major programming languages. Several packages (FSL, SUSPECT and spant shown here) already can load NIfTI format data.
    Figure 1. Schematic of the NIfTI MRS format. The NIfTI header is retained and used for its original purpose. Additional MRS specific meta-data is stored in a JSON formatted NIfTI header extension. Complex time-domain data is stored in the fourth dimension, after three spatial dimensions, and before three optional flexible-use dimensions.
Back to Top
Digital Poster Session - Spectroscopy: Acq/Recon/Analysis
Cancer/Spectroscopy/Molecular Imaging/Pre-Clinical
Tuesday, 18 May 2021 15:00 - 16:00
  • Ultrahigh-field echo-planar spectroscopic imaging with semi-adiabatic spatial-spectral pulses
    Gaurav Verma1, Rebecca Emily Feldman2, and Priti Balchandani1
    1Radiology, Icahn School of Medicine at Mount Sinai, New York, NY, United States, 2Medical Physics, University of British Columbia, Kelowna, BC, Canada
    An echo-planar spectroscopic imaging (EPSI) sequence has been demonstrated combining semi-adiabatic spatial-spectral pulses and echo-planar readout to facilitate fast magnetic resonance spectroscopic imaging (MRSI) at ultra-high field (7T)
    Figure 1: Pulse sequence diagram of the EPSI sequence showing semi-adiabatic point-resolved spectroscopy (PRESS) sequence and bi-polar echo-planar readout.
    Figure 4: Fully-reconstructed data showing spatially-resolved spectra with peaks of Creatine (Cr), Choline (Cho) and N-acetyl aspartate (NAA) visible and labeled in one spectrum. Horizontal axes are in parts-per-million (ppm) and vertical axes in arbitrary units representing signal amplitude.
  • Double Spin Echo Spectroscopic Imaging Using Optimized 3D Spectral-Spatial Pulses for Brain Studies at 10.5T
    Xiaoxuan He1, Edward J. Auerbach1, Michael Garwood1, Naoharu Kobyashi1, Alireza Sadeghi‐Tarakameh1, Yigitcan Eryaman1, Xiaoping Wu1, and Gregory J. Metzger1
    1Center for Magnetic Resonance Research, University of Minnesota, Minneapolis, MN, United States
    A parallel transmit optimized 3D spatial-spectral pulse is developed for spectroscopic imaging for brain studies at 10.5T with reduced SAR, intrinsic water suppression and field inhomogeneity mitigation. Phantom studies are used to compare the new method with a conventional approach.
    Figure 1. The proposed spectroscopy acquisition at 10.5T using (a) a double spin-echo sequence with (b) 3D SPSP adiabatic pulses for refocusing. The design of the 3D SPSP pulse was shown in (b), where a train of pTx spiral sub-pulses are modulated by an adiabatic envelope. With pTx, the peak amplitude can be effectively reduced and hard constrained by optimal control method as shown in (c). To further increase the spectral bandwidth at 10.5T, an inhomogeneous spatial profile can be used for the sub-pulse while still achieving a homogeneous inversion by the 3D SPSP pulses as shown in (d).
    Figure 2. A brief summary of the 3D SPSP pulse performance. The phantom setup was shown in (a), where FOV and VOI were indicated by the white and yellow box. The B0 mapping was shown in (b). By simulation, the pulse provided an approximately 920 Hz for the 95% passband along with stopband at ±750 Hz for water and lipid suppression as shown in (c), with overall mild chemical shift displacement errors as shown in (d), (e). The spatially resolved spectra acquired with the proposed method as shown in (f) matched with the simulated profiles.
  • Simultaneous Water and Lipid Suppression Using Chemical Selective Adiabatic Refocusing Pulses Echo Planar Spectroscopic Imaging (EPSI) at 7T
    Guodong Weng1, Sulaiman Sheriff2, Claus Kiefer1, Irena Zubak3, Andrew A Maudsley2, and Johannes Slotboom1
    1Institute for Diagnostic and Interventional Neuroradiology, Support Center for Advanced Neuroimaging (SCAN), University of Bern, Bern, Switzerland, 2Department of Radiology, University of Miami School of Medicine, Miami, FL, United States, 3Inselspital Bern and University Hospital, Bern, Switzerland
    A whole brain EPSI-variant sequence is developed in this study. The results show a 77% reduction of CSDA, homogeneous refocusing map, water suppression factor ≥ 1000 within 8 minutes as well as an acceptable SAR both in vitro and in vivo measurement.
    Figure1: (a.) EPSI pulse sequence using spatial selective amplitude modulated excitation and refocusing RF-pulses. (b.) Proposed EPSI variant of this abstract: the slice selective Mao pulse typed refocusing pulse is replaced by a chemical shift selective adiabatic complex hyperbolic-secant 2π-pulse pair. All the measurements were performed with a volume of interest of 280 X 220 X 100 mm.
    Figure 2: (a-d) water maps: comparison of non-adiabatic excitation and refocusing using Mao pulses (a,c) with complex hyperbolic secant RF-pulses (b,d). (a’-d’) corresponding histograms of the images (a-d) over the phantom area. TE = 82 ms, TR = 1500 ms, BW = 1.4 kHz with a resolution of 4.3 X 11 X 13.8 mm.
  • Atlas-based adaptive Hadamard-encoded Acquisition for Multiband 2D MRSI at 3T
    Huawei Liu1, Adam Autry1, Duan Xu1, Peder Larson1, and Yan Li1
    1Department of Radiology and Biomedical Imaging, University of California, San Francisco, San Francisco, CA, United States
    By combining atlas-based prescription and adaptive Hadamard pulses, we developed an automatic multi-slice 2D MRSI acquisition method which provided better time-efficiency, SNR efficiency and reproducibility, and may improve 2D MRSI utilization in clinical research.
    Figure 1. The diagram for double-band MRSI acquisition with atlas prescription and adaptive Hadamard pulses. A special atlas template was designed to cover superior and deep gray matter regions. After prescription, Hadamard pulses were automatically generated to excite top slice and bottom slice in S/I direction. Finally, 2D MRSI can be reconstructed from a two-echo Hadamard-encoded acquisition.
    Figure 5. Hadamard 2D GABA+/Cr map of top slices and bottom slices in all three subjects overlaying T1-weighted images. Voxels with GABA+ fitting error > 30% or GABA FWHM > 30 Hz were all excluded.
  • Potential of Dual-SPECIAL sequence in revealing interregional differences in human brain metabolite concentrations
    Masoumeh Dehghani1,2 and Jamie Near1,2
    1McGill university, Montreal, QC, Canada, 2Centre d'Imagerie Cérébrale, Douglas Mental Health University, Montreal, QC, Canada
    • Demonstrated feasibility of performing simultaneous 1H MRS localization at multiple brain regions using dual-Special sequence
    • Revealed interregional significant differences between anterior and posterior cingulate cortices, and medial supplementary motor area and adjacent lateral WM

    Figure 1. (a) Three-dimensional T1-weighted anatomical images were acquired using MPRAGE. Green boxes covering two voxels illustrate the shimming volume in first scan. ACC (blue box) and PCC (red box) regions were selected for 1H MRS acquisition. (b) Localized water suppressed 1H spectrum (blue) along with spectral fit (orange), residual (black) and baseline (red) obtained from LCModel quantification.
    Figure 2. (a) Green boxes covering two voxels illustrate the shimming volume in second scan in the anatomical MPRAGE image. GM-rich (red box) and WM-rich (blue box) regions were selected for 1H MRS acquisition. (b) Localized water suppressed 1H spectrum (blue) along with spectral fit (orange), residual (black) and baseline (red) obtained from LCModel quantification.
  • GOIA-WURST optimisation for ultra-high field single-voxel MRS at short-TE
    Adam Berrington1, Joseph S Gillen2,3, and Vincent Boer4
    1Sir Peter Mansfield Imaging Centre, School of Physics and Astronomy, University of Nottingham, Nottingham, United Kingdom, 2Russell H. Morgan Department of Radiology and Radiological Science, Johns Hopkins University School of Medicine, Baltimore, United Kingdom, 3F.M. Kirby Research Centre, Kennedy Krieger Institute, Baltimore, MD, United States, 4Danish Research Centre for Magnetic Resonance,Centre for Functional and Diagnostic Imaging and Research, Copenhagen University Hospital, Hvidovre, Denmark
    An optimized GOIA-WURST(50,10) inversion pulse shape was found to improve off resonance inversion profile for low B1 field (15 μT) at 4.5 ms and reduced the minimum echo time at ultra-high field for semi-LASER to 23 ms.
    Fig.2: Simulated inversion profiles for a) HS b) FOCI5 c) GOIA-W(16,4) and GOIA-W(50,10) at 15 μT maximum B1 field and for 0,1 and 2 ppm off-resonance at 7T. GOIA-W(50,10) shows compromise between passband ripple and CSD for 4.5ms.
    Fig.4: Single-voxel semi-LASER MRS on a brain metabolite phantom (after line broadening) using three different adiabatic inversion pulses a) GOIA-W(50,10) b) FOCI5 and c) HS resulting in a minimum echo time of 23, 31 and 37 ms respectively.
  • Spectral registration for real-time frequency correction of single-voxel GABA-edited MRS data: Proof of concept
    Mark Mikkelsen1,2, Steve C. N. Hui1,2, and Richard A. E. Edden1,2
    1Russell H. Morgan Department of Radiology and Radiological Science, The Johns Hopkins University School of Medicine, Baltimore, MD, United States, 2F. M. Kirby Research Center for Functional Brain Imaging, Kennedy Krieger Institute, Baltimore, MD, United States
    We implemented a novel spectral registration (SR) approach for real-time B0 frequency correction for GABA-edited MRS. SR allows for full shot-to-shot, voxel-localized center frequency updates without the need for separate image-based navigators. Proof-of-concept results are presented.
    Figure 1. Schematic of interleaved water referencing (IWR) and spectral registration (SR) for real-time center frequency (F0) updating of MEGA-PRESS acquisitions. IWR and acquisition of the SR reference, Sref(t), occur every ith and ith + 1 TRs, depending on the desired number of unsuppressed water reference acquisitions. For example, for a MEGA-PRESS scan with 320 water-suppressed averages and 8 unsuppressed water references, IWR will occur every 40th TR. OVS, outer-volume saturation; WS, water suppression.
    Figure 2. Phantom experimental results. Top row: Relative changes in center frequency (ΔF0) over each of the four ~5-min GABA-edited MEGA-PRESS scans before and after an ~8-min EPI scan with and without interleaved water referencing (IWR) and spectral registration (SR). Bottom row: GABA-edited difference spectra for each of the four scans. The corresponding SNR of the 3.0 ppm edited GABA signal is shown.
  • SLOW:  Whole Brain Spectral Editing EPSI Based Technique using Chemical Selective Adiabatic 2π-Refocusing Pulses applied to 2HG and GABA Editing
    Guodong Weng1, Claus Kiefer1, Irena Zubak2, and Johannes Slotboom1
    1Institute for Diagnostic and Interventional Neuroradiology, Support Center for Advanced Neuroimaging (SCAN), University of Bern, Bern, Switzerland, 2Department of Neurosurgery, Inselspital Bern and University Hospital, Bern, Switzerland
    A new spectral editing scheme was developed in EPSI sequence for whole brain MRSI at 7T, which is B1-insensitive and has shown its capability to be an alternative method for MEGA editing.
    Figure 1: EPSI-SLOW spectral editing sequence scheme. a) Chemical selectively refocusing the full range of interested spins. b) Chemical selectively refocusing the partial range of interested spins.
    Figure 2: a) Simulation of the adiabatic pulse (used as inversion pulse in the simulation for simplicity). The passband and transition band are indicated by blue/orange and light blue/orange respectively for editing full and editing partial pulses. b) The editing full/partial pulse bandwidth is 840 Hz but with a different carrier frequency. TR = 1500 ms, volume of interest (VOI) = 280 X 220 X 100 mm, voxel size = 4.3 X 11 X 13.8 mm, and total measurement time = 6 mins.
  • Long-TE mixed flip angle editing of GABA
    Sofie Tapper1,2, Muhammad G. Saleh3, Helge J. Zöllner1,2, Steve C.N. Hui1,2, and Richard A.E. Edden1,2
    1Russell H. Morgan Department of Radiology and Radiological Science, Johns Hopkins University School of Medicine, Baltimore, MD, United States, 2F. M. Kirby Research Center for Functional Brain Imaging, Kennedy Krieger Institute, Baltimore, MD, United States, 3Department of Diagnostic Radiology and Nuclear Medicine, University of Maryland School of Medicine, Baltimore, MD, United States
    Long-TE mixed flip angle (MFA) editing for GABA detection was implemented and validated using phantom- and one in vivo measurement. The preliminary results show potential for further work where the GABA-editing selectivity could be increased by allowing for longer editing pulse duration.
    Figure 4. Resulting water-scaled in vivo difference spectra.
    Figure 2. Simulations compared to Phantom measurements. For visualization purposes, the simulated data have been line-broadened to match the linewidth of the difference spectrum for the phantom data.
  • Improved prospective frequency correction for macromolecule-suppressed GABA editing with metabolite cycling at 3T
    Kimberly Chan1, Andreas Hock2, Richard Edden3,4, Erin MacMillan5, and Anke Henning1,6
    1The University of Texas Southwestern, Dallas, TX, United States, 2MR Clinical Science, Philips Health Systems, Horgen, Switzerland, 3Russell H. Morgan Department of Radiology and Radiological Science, The Johns Hopkins University School of Medicine, Baltimore, MD, United States, 4. M. Kirby Research Center for Functional Brain Imaging, Kennedy Krieger Institute, Baltimore, MD, United States, 5UBC MRI Research Centre, University of British Columbia, Vancouver, BC, Canada, 6Max Planck Institute for Biological Cybernetics, Tübingen, Germany
    Metabolite cycling is combined with J-difference editing to allow for continuous prospective frequency correction without additional acquisitions to reduce B0 field instability and macromolecule (MM) contamination in MM-suppressed GABA-editing.
    3. (a) Voxel location in the OCC and example spectra in two different subjects acquired with and without prior DWI. In both cases, the WS-MEGA and MC-MEGA spectra are qualitatively similar to one another. (b) Voxel location in the medial prefrontal cortex and example spectra in two subjects. In one case, the WS-MEGA spectrum displays a significantly larger Cho artifact than the MC-MEGA spectrum.
    4. Metrics of the water frequency across subjects. (a) Boxplots comparing the magnitude average ΔF0 between the MC-MEGA and WS-MEGA scans. The average ΔF0 is 68% lower in the MC-MEGA scans than in the WS-MEGA scans in the OCC. In the mPFC, the average ΔF0 is 65% lower in the MC-MEGA scans than in the WS-MEGA scans (b) Boxplots comparing the standard deviation of the water frequency between WS-MEGA and MC-MEGA experiments. The water frequency standard deviation is 26% lower in the MC-MEGA scans than in the WS-MEGA scans in the OCC and 75% lower in the MC-MEGA scans than in the WS-MEGA in the mPFC.
  • Detection and quantification of NAD+ in the human brain at 3 T: Comparison of three different localization techniques
    Martyna Dziadosz1, Maike Hoefemann1, André Döring2, Malgorzata Marjanska3, Edward Auerbach3, and Roland Kreis1
    1Departments of Radiology and Biomedical Research, University of Bern, Bern, Switzerland, 2Cardiff University Brain Research Imaging Centre (CUBRIC), School of Psychology, Cardiff University, Cardiff, United Kingdom, 3Department of Radiology, Center for Magnetic Resonance Research, University of Minnesota, Minnesota, MN, United States
    In this study we compare three techniques to access NAD+ quantification – standard WS semiLASER and two nWS(MC semiLASER and 2D I-CSE). NAD+ was detected with all techniques with a limited visibility for the WS semiLASER. While utilizing nWS concept allows to detect NAD+ at the visibility of 66%.
    Fig 2. Cohort-averaged downfield spectra from 10 subjects each, plotted in the range between 6.5 and 10 ppm. The cohort averages were formed after scaling by unsuppressed water to assure equal weight for each subject. Appropriate scaling was also applied to guarantee a comparable scale between techniques. For better visibility of the NAD+ signals spectra are plotted with 6x vertical scale on the right-hand side along with the simulated NAD+ pattern (peaks at 8.2 and 8.4 ppm removed to minimize interference with larger overlapping signals). Dashed lines indicate the NAD+ peaks fitted.
    Table 1. NAD+ concentrations and Cramer Rao lower bounds and their cohort standard deviations (SD) as obtained with all three localization techniques, without and with correction for T2 relaxation with an assumed T2 of 80 ms (assumption based on Ref 12 reporting 54±5 ms at 11.7 T). For a fair comparison considering equal scan times for all methods, the CRLB for MC semiLASER and 2D ICSE should be reduced by 30%, which yields almost the same CRLB for both semiLASER approaches.
  • Mapping of downfield resonances in the human brain using 1H-MRSI with binomial spectral-spatial excitation and selective refocusing
    Michal Považan1, Michael Schär1, Joseph S Gillen1,2, and Peter B Barker1,2
    1Department of Radiology and Radiological Science, The Johns Hopkins University School of Medicine, Baltimore, MD, United States, 2Kennedy Krieger Institute, F. M. Kirby Research Center for Functional Brain Imaging, Baltimore, MD, United States
    Novel method for mapping proton downfield resonances on a 3T scanner using 2D 1H-MRSI in combination with binomial spectral-spatial excitation and selective refocusing.
    Fig.1 – A – 2D Spin echo MRSI sequence with binomial spectro-spatial excitation (red) and selective refocusing (green). B – Placement of the MRSI FOV in vivo.
    Fig. 4 – An example of MRSI downfield spectra from three subjects shown for grey-matter rich (red voxel) and white-matter rich (white voxel) voxels. 3Hz Gaussian line-broadening was applied. Spectral pattern consists of resonances at 6.1, 6.8, 7.1, 7.3, 7.5, 7.9 and 8.2 ppm peaks.
  • Effect of digitization in gradient modulated adiabatic pulses with a spatial offset.
    Jan Willem van der Veen1 and Jun Shen1
    1Magnetic Resonance Spectroscopy Core, NIH, NIMH, Bethesda, MD, United States
    Phase modulation of adiabatic pulses with a modulated selection gradient may exceed Nyquist limits when a spatial offset is applied.
    Figure 2. Simulated voxel profiles a) pulse 1 and b) pulse 2. Spatial offsets range from 0, 2, .., 12 cm. The vertical dotted lines show the Nyquist frequencies.
    Figure 1. Point to point phase increments of two popular GOIA-WURST(16-4) adiabatic pulses, number of points, sample interval, bandwidth range, B1 max level, and gradient amplitude modulation factor: a) pulse1: 175, 20 us, -10 kHz … 10 kHz, 817 Hz, 0.90 from (3), and b) pulse2: 450, 10 us, 5 kHz … 5 kHz, 640 Hz, 0.85) from (1). The Nyquist limit at 180 degrees is shown as the dotted line. The number at the left in the plot indicate the spatial shift of the pulse in cm.
  • Accelerate Magnetic Resonance Spectroscopy with Deep Low Rank Hankel Matrix
    Yihui Huang1, Jinkui Zhao1, Zi Wang1, Di Guo2, and Xiaobo Qu1
    1Department of Electronic Science, National Institute for Data Science in Health and Medicine, Xiamen University, Xiamen, China, 2School of Computer and Information Engineering, Xiamen University of Technology, Xiamen, China
    we proposed a deep learning reconstruction method based on unrolling the iterative process of a state-of-the-art model-based low rank Hankel matrix method, which provides a better approximation of low rank and preserves the low-intensity signals much better.
    Figure 1. The architecture of DHMF. (a) the general process of the k-th block, (b) P and Q modules with time domain convolution in the basic DHMF, (c) P and Q modules with frequency domain convolution in the enhanced DHMF, (d) dense convolutional neural network.
    Figure 2. The reconstructed spectra and singular values at each block. (a) fully sampled spectrum, (b-f) the reconstructed spectrum by the 1st to 5th blocks, (g) the nuclear norm of Hankel matrix of time-domain signal, and (h-l) denote corresponding singular values of the output of each block. Note: To show small singular value clearly, there exists a break from 0.084 to 0.085 in Y axis of (h-l).
  • Unsupervised anomaly detection using generative adversarial networks in 1H-MRS of the brain
    Joon Jang1, Hyeong Hun Lee1, Ji-Ae Park2, and Hyeonjin Kim3,4
    1Department of Biomedical Sciences, Seoul National University, Seoul, Korea, Republic of, 2Division of Applied RI, Korea Institute of Radiological & Medical Science, Seoul, Korea, Republic of, 3Department of Medical Sciences, Seoul National University, Seoul, Korea, Republic of, 4Department of Radiology, Seoul National University Hospital, Seoul, Korea, Republic of
    Our unsupervised deep learning-based approach could be an option in addition to the previously reported supervised deep learning-based approaches in the binary classification of the quality of human brain spectra at 3.0T with an extended abnormal spectra regime.
    Fig. 1. A schematic of the optimization of the AnoGAN. First, the generator G and the discriminator D are simultaneously trained. Second, using the trained G and D, the noise vector in the latent space is iteratively optimized by latent space mapping. Third, the NMSE and 2SD are obtained for all data in the validation sets. Then, the optimal threshold NMSE and 2SD values in the classification of spectra into normal and abnormal classes are determined from the NMSE-2SD space. Finally, the optimal threshold NMSE and 2SD values are used on the test sets.
    Fig. 2. The representative query, AnoGAN-generated, and residual spectra for the abnormal spectra groups. (A)-(G) The input (query) spectra to the AnoGAN from (A) Spec­ano.SNR, (B) Spec­ano.LW, (C) Specano.GABA, (D) Specano.mI, (E) Specano.NAA, (F) Specano.multimeta, and (G) Spec­ano.all. (H)-(N) The corresponding AnoGAN-generated spectra. (O)-(U) The residual spectra between the input and the AnoGAN-generated spectra. The abnormal spectral parameters and their values in the simulation are shown in (A)-(G) (the unit of the metabolite concentration is mmol/L).
  • SNR-Enhancing Reconstruction for Multi-TE MRSI Using a Learned Nonlinear Low-dimensional Model
    Yahang Li1,2, Zepeng Wang1,2, and Fan Lam1,2
    1Department of Bioengineering, University of Illinois Urbana-Champaign, Urbana, IL, United States, 2Beckman Institute for Advanced Science and Technology, University of Illinois Urbana-Champaign, Urbana, IL, United States
    A new learning-based method that exploits the nonlinear low-dimensional representations of multi-TE MRSI data was proposed for SNR enhancement. Simulation and experimental results demonstrated the effectiveness and superior performance over alternative denoising methods.
    Figure 1: The proposed DCCAE and training strategy. X denotes the collection of multi-TE FID training data with length T and M TEs. Complex units are used where different TEs are treated as different channels in the input. For each complex convolution block, data dimensions were reduced by half while the channel dimension (K) increased by a small amount. The fully connected part followed an encoder-decoder structure and a middle feature layer with dimension $$$L$$$ (referred to as the model order). Errors between $$$\textbf{X}$$$ and $$$\hat{\textbf{X}}$$$ is minimized.
    Figure 2: Representation efficiency of the learned model: a) Relative $$$\ell_2$$$ errors of the proposed model approximation with different model orders $$$L$$$’s for 3-TE data (orange curve), compared to linear subspace models (TE-combined subspace in the blue curve and TE-dependent subspace in a yellow curve). For the TE-dependent subspaces, $$$L$$$ is the total dimension of the three subspaces. b) Approximations of a test spectra at different TEs (30, 80, and 130 ms) using the three models with $$$L = 42$$$. A more accurate representation is achieved by our learned model.
  • Highly accelerated variable-density MultiNet CAIPIRINHA for 1H MRSI and augmented MRSI neural network training
    Kimberly Chan1 and Anke Henning1,2
    1The University of Texas Southwestern, Dallas, TX, United States, 2Max Planck Institute for Biological Cybernetics, Tübingen, Germany
    Neural network reconstruction of new CAIPIRINHA-based variable-density k-space undersampling schemes and an approach to train the neural networks by augmenting the MRSI data with the non-water suppressed is introduced and evaluated.  Both are shown here to reduce lipid artifacts in MRSI.
    1. (a) K-space undersampling schemes for the originally proposed 6x and 9x-acceleration (first row) as well as the newly proposed variable-density CAIPIRINHA schemes for 5x and 6x acceleration. (b) Schematic for augmenting the MRSI data with water-removed NWS data to provide more k-space points as well as a larger k-space region for training the neural networks based off the lipid behavior.
    5. Glutamate + glutamine (Glx) maps over total creatine (tCr) in one subject across different sampling schemes and reconstruction methods. Of the maps featured, the Glx/tCr maps from the variable-density CAIPIRINHA schemes are most similar to the Glx/tCr map from the fully-sampled dataset.
  • k-Space-based Coil Combination via Geometric Deep Learning for Reconstruction of non-Cartesian MR Spectroscopic Imaging Data
    Stanislav Motyka1, Lukas Hingerl1, Bernhard Strasser1, Gilbert Hangel1, Eva Heckova1, Asan Agibetov2, Georg Dorffner2, and Wolfgang Bogner1
    1Department of Biomedical Imaging and Image-guided Therapy, Medical University of Vienna, Wien, Austria, 2Section for Artificial Intelligence and Decision Support (CeMSIIS), Medical University of Vienna, Wien, Austria
    MRSI data of volunteers were coil combined in non-Cartesian kspace via Geometric Deep Learning. The results were compared to conventional coil combination, providing similar results. The method can be used to strongly accelerate image reconstruction.
    Figure 5 - Metabolic maps of tNAA/tCr and tCho/tCr and example spectra from two locations are presented for both coil combination methods. The contrast of the ratio maps appear similar in all three orthogonal projection for both methods. The position are marked with the small letters. The spectra in the same column belong to the same coil combination method. The appearance of the spectra for different methods differ mainly in the course of the baseline.
    Figure 2 – Comparison of kspCC and cCC maps of the spectral data quality. Both methods produced similar results in terms of spatial distribution of parameters. The SNR values for kspCC are a bit lower compared to the cCC but approximately the same volume is covered. The FWM maps look very similar and from the maps themselves no underperformance can be observed.
  • Magnetic Resonance Imaging and Spectroscopy in Late-Onset GM2-Gangliosidosis
    Olivia E Rowe1, Rangaprakash Deshpande1, Akila Weerasekera1, Christopher Stephen2,3, Robert L Barry1,4, Florian Eichler3,5, and Eva-Maria Ratai1
    1Athinoula A. Martinos Center for Biomedical Imaging, Department of Radiology, Massachusetts General Hospital and Harvard Medical School, Charlestown, MA, United States, 2Movement Disorders Division and Ataxia Center, Department of Neurology, Massachusetts General Hospital and Harvard Medical School, Boston, MA, United States, 3Center for Rare Neurological Diseases, Department of Neurology, Massachusetts General Hospital and Harvard Medical School, Boston, MA, United States, 4Harvard-Massachusetts Institute of Technology Health Sciences & Technology, Cambridge, MA, United States, 5Leukodystrophy Clinic, Department of Neurology, Massachusetts General Hospital and Harvard Medical School, Boston, MA, United States
    Late-onset GM2-Gangliosidoses (LOGG), which are rare lysosomal storage disorders and include Tay-Sachs disease (LOTS) and Sandhoff disease (LOSD), have notable structural and metabolic effects on the cerebellum.
    Figure 1: T1-weighted MR images showing cerebellar atrophy. Defaced coronal and sagittal MRI slices (MNI space: x=0) of (A) patient presenting with late-onset Tay-Sachs disease showing profound cerebellar atrophy, (B) patient presenting with late-onset Sandhoff disease, and (C) healthy control.

    Table 1: Participant demographics and clinical assessment scores reported as mean ± standard deviation.

  • The impact of Marchencko-Pasteur principal component analysis denoising on high-resolution MR spectroscopic imaging in the rat brain at 9.4T.
    Dunja Simicic1,2,3, Jessie Julie Mosso1,2,3, Thanh Phong Lê3,4, Ruud B. van Heeswijk5, Ileana Ozana Jelescu1,2, and Cristina Cudalbu1,2
    1CIBM Center for Biomedical Imaging, Lausanne, Switzerland, 2Animal Imaging and Technology, EPFL, Lausanne, Switzerland, 3Laboratory of Functional and Metabolic Imaging, EPFL, Lausanne, Switzerland, 4Geneva School of Health Sciences, HES-SO University of Applied Sciences and Arts Western Switzerland, Geneva, Switzerland, 5Department of Radiology, Lausanne University Hospital (CHUV) and University of Lausanne (UNIL), Lausanne, Switzerland
    MRSI is a powerful tool for the non-invasive simultaneous mapping of metabolic profiles at multiple spatial positions. Aim of the present study was to implement an improved denoising technique (MP-PCA) on high resolution MRSI data acquired at 9.4T in the rat-brain.
    Figure 1. a) Fit of Marchenko-Patstur distribution to the lowest eigenvalues from PCA. B) Mean value of the standard deviation of noise (last 300 points of the FID) from all 120 spectra before and after denoising (upper and lower graphs, respectively). c) The noise distribution of 6 random selected spectra before and after denoising.
    Figure 2. A sub-set (5x8) of the full image matrix demonstrates the quality of the spectra before and after denoising.
Back to Top
Digital Poster Session - Spectroscopy: Analysis/Quantification
Cancer/Spectroscopy/Molecular Imaging/Pre-Clinical
Tuesday, 18 May 2021 15:00 - 16:00
  • ORYX-MRSI: A data analysis software for multi-slice 1H-MRSI
    Sevim Cengiz1, Muhammed Yildirim1, Abdullah Bas1, and Esin Ozturk-Isik1
    1Biomedical Engineering Institution, Bogazici University, Istanbul, Turkey
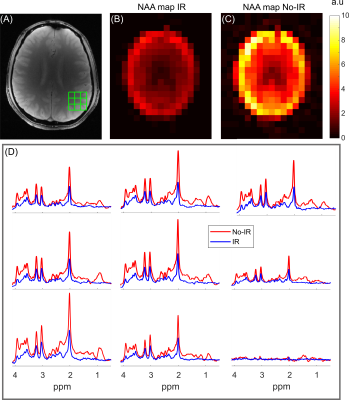
    Oryx-MRSI is a fully automated software for a comprehensive analysis of multi-slice proton magnetic resonance spectroscopic imaging (1H-MRSI) data.
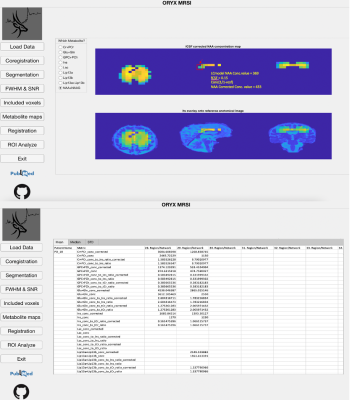
    fCSF corrected NAA concentration map and its overlay onto reference T2w MRI (figure 5a) and ROI analysis of an example dataset on 400 brain parcellations defined on 17 rs-fMRI networks (figure 5b).
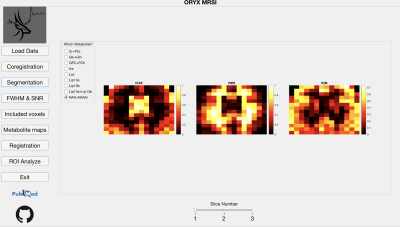
    Segmentation module shows fCSF, fWM and fGM maps for a selected metabolite (NAA+NAAG) at different slices.
  • ProFit-v3: accuracy and precision evaluation of a new spectral fitting software
    Tamas Borbath1,2, Saipavitra Murali-Manohar1,2, Johanna Dorst1,3, Andrew Martin Wright1,3, and Anke Henning1,4
    1High-field Magnetic Resonance, Max Planck Institute for biological Cybernetics, Tübingen, Germany, 2Faculty of Science, University of Tübingen, Tübingen, Germany, 3IMPRS for Cognitive & Systems Neuroscience, Tübingen, Germany, 4Advanced Imaging Research Center, UT Southwestern Medical Center, Dallas, TX, United States
    The newly developed ProFit-v3 fitting algorithm, including an adaptive baseline stiffness control and a new cost function, was evaluated for accuracy and precision using both simulated and in vivo spectra. Fitted metabolite concentration results were also compared against LCModel.
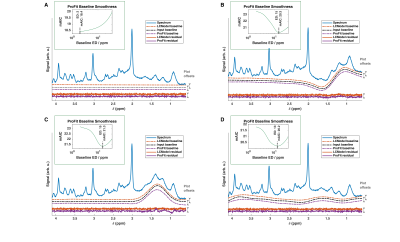
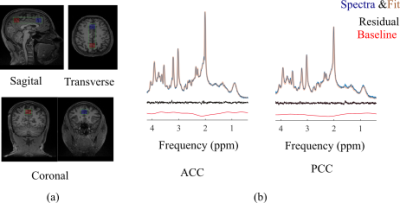
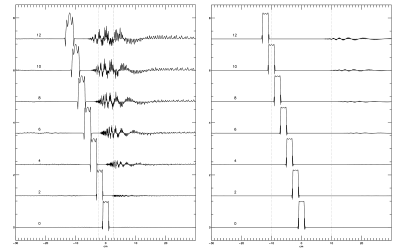
    Fig. 2: Fit results for the baseline simulations are shown. The blue line shows the input spectrum; the black line the input baseline. Fitted baselines (dashed lines) and resulting residuals (continuous lines) are shown in red for LCModel and purple for ProFit-v3. Offsets used for plotting are indicated on the right of each subplot. Inlays show the mAIC curves for the ProFit-v3 fitting. These spectra show a simulated zero baseline, an in-phase (φ0 = 0°) and an out of phase (φ0 = 90°) lipid peak at 1.3 ppm, but also an extracted baseline from a previous LCModel fit of an in vivo spectrum.
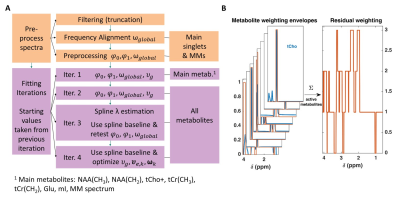
    Fig. 1 A: The ProFit-v3 algorithm is depicted with the successive optimization steps: first preprocessing steps affect the spectrum to be fit while the fitting iterations optimize the linear combination of the basis sets. In later iterations, more metabolites are added, and additional metabolite specific local degrees of freedom are allowed while keeping the previously optimized global parameters. B: Metabolite weighting envelopes are displayed in red. Summing the weights of active metabolites for the fit iteration gives the weights of the spectral residual RX shown on the right.
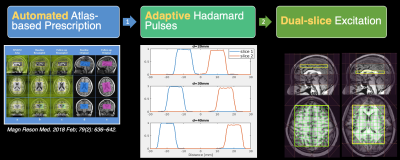
  • Reproducibility and Coverage of Human Whole-brain 1H FID MRSI at 9.4 T after Processing Pipeline Optimization
    Theresia Ziegs1,2, Andrew Martin Wright1,2, and Anke Henning1,3
    1MRZ, MPI for Biological Cybernetics, Tuebingen, Germany, 2IMPRS for Cognitive and Systems Neuroscience, Tuebingen, Germany, 3Advanced Imaging Research Center, University of Texas Southwestern Medical Center, Dallas, TX, United States
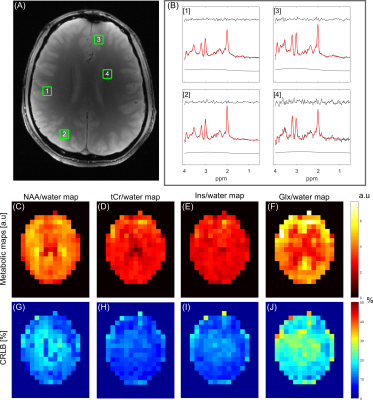
    Fully sampled 1H FID MRSI data were acquired at 9.4 T. An optimized processing pipeline lead to high quality concentration maps for tCr, tCho, NAA, Glu, and mI reflecting the expected concentration difference in gray and white matter for the major part of the brain.
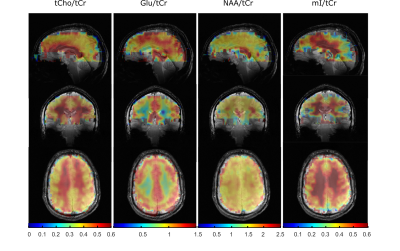
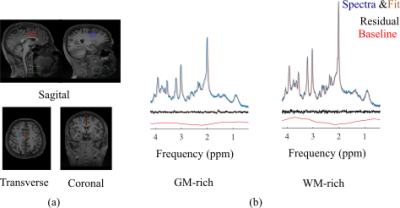
    Figure 4: 3D concentration maps for tCho/tCr, Glu/tCr, NAA/tCr, mI/tCr in arbitrary units showing the brain coverage achieved in this study with the optimized set-up using L2-regularization and including a simulated macromolecular baseline in the LCModel fit. The metabolite maps are underlayed with the anatomical images.
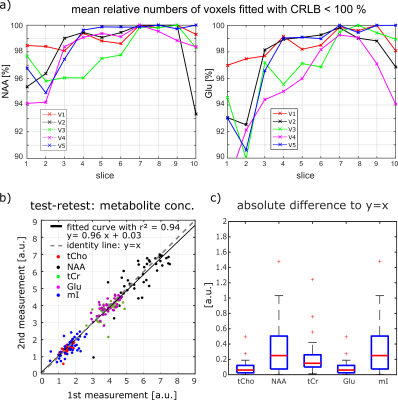
    Figure 5: Mean number of voxels fitted with CRLB < 100 % for each slice for NAA and Glu for one measurement of all volunteers. The test-retest figure in b) shows the mean concentration for each slice. Data is shown for all five volunteers and five different metabolites (Cho = red dots, NAA = black dots, tCr = green dots, Glu = purple dots, mI = blue dots). The black line is the curve fitted to the data with y = 0.96x + 0.03 and r2 = 0.94; the gray dotted line is the identity line with y = x. In c) the absolute difference of the dots in the test-retest figure to the ideal case of y = x is shown for five metabolites.
  • Reproducibility of High-Resolution 1H-MRSI at 7T Using SPICE
    Pallab K Bhattacharyya1, Rong Guo2, Yudu Li2, Yibo Zhao2, Zhi-Pei Liang2, and Mark J Lowe1
    1Cleveland Clinic Foundation, CLEVELAND, OH, United States, 2University of Illinois, Urbana, IL, United States
    1H SPICE was implemented at 7T and reproducibility of the technique was demonstrated at 3×3×3 mm3 spatial resolution.  
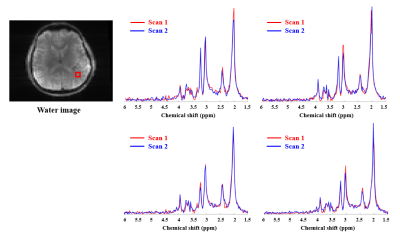
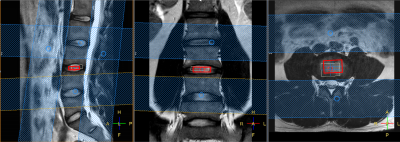
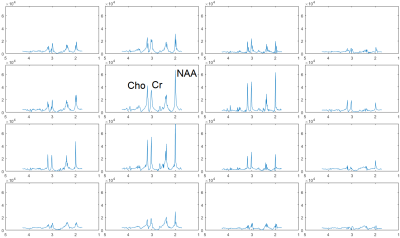
    Fig. 3. In vivo scan-rescan spectra from 4 voxels within the red box.
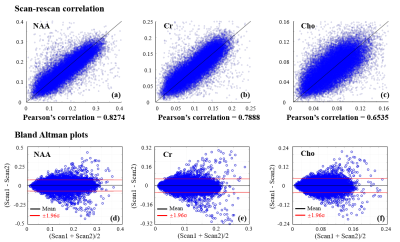
    Fig. 5. In vivo scan-rescan reproducibility: scan-rescan voxel-wise concentration correlation plots ((a), (b) and (c)), Bland Altman plots ((d), (e) and (f))
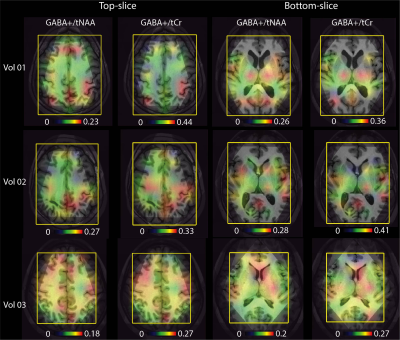
  • Relaxation corrected simulated MM model for improved fitting and quantification of 1H FID MRSI data
    Andrew Martin Wright1,2, Saipavitra Murali Manohar1,3, Theresia Ziegs1,2, and Anke Henning1,4
    1Max Planck Institute for Biological Cybernetics, Tübingen, Germany, 2IMPRS for Cognitive and Systems Neuroscience, Tübingen, Germany, 3University of Tübingen, Faculty of Science, Tübingen, Germany, 4Advanced Imaging Research Center, UT Southwestern Medical Center, Dallas, TX, United States
    A novel method to simulate macromolecule signals to improve MRSI metabolite mapping and quantification with very short TR 1H-FID MRSI. The method developed is compared more commonly used methods of accounting for macromolecule signals. Results show improved metabolite mapping.
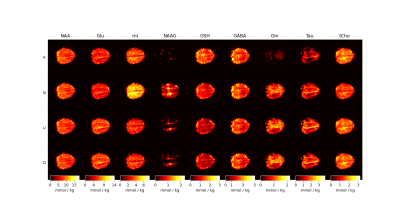
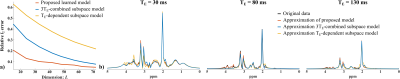
    Figure 4: Metabolite maps for the four approaches used for fitting MRSI data. Maps are reported with T1-relaxation corrections and in units of mmol / kg. It is apparent that using simulated MM basis vectors performs best generally when considering the poor fits of NAAG, mI, and Gln from Approach A and Approach B.
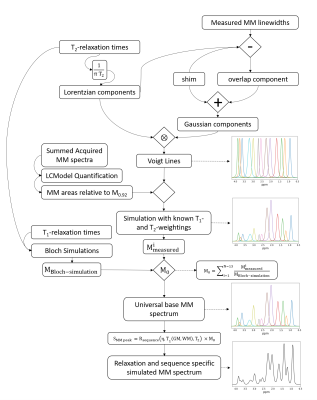
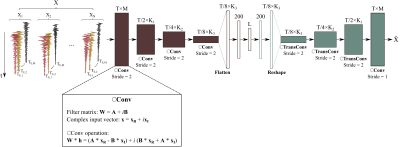
    Figure 1: The relaxation-corrected, sequence-specific MM simulation model algorithm diagram. Voigt lines are simulated using measured Gaussian and Lorentzian lineshapes. Voigt lines are then scaled by measured concentrations of MM from 9.4T and further processed with single-spin Bloch simulations to simulate a universal base MM spectrum which is then attenuated by sequence specific relaxation effects to yield a sequence specific MM basis vector.
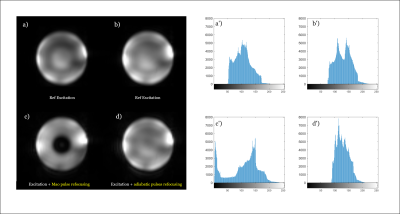
  • Automatic phase order correction in challenging MR spectra
    Maria Yanez Lopez1,2
    1Centre for the Developing Brain, School of Biomedical Engineering and Imaging Sciences, King's College London, London, United Kingdom, 2Biomedical Engineering Department, School of Biomedical Engineering and Imaging Sciences, King's College London, London, United Kingdom
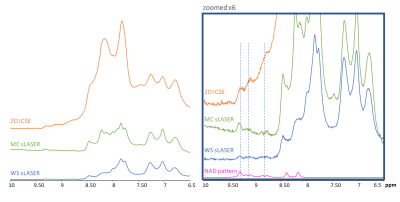
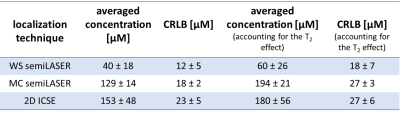
    The aim of this work is to develop an automatic zero and first order phase order correction and apply it to challenging spectra, using an MRS LASER sequence at 3T
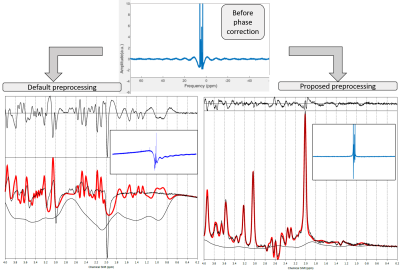
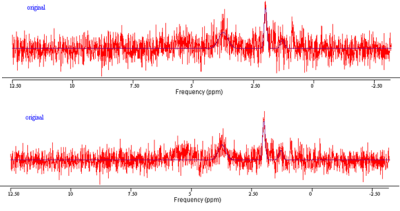
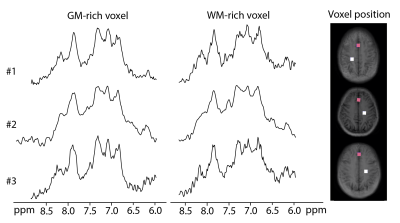
    Fig 2. Top: Representative spectrum following raw data reconstruction and spectral registration. Bottom: Fit results using default preprocessing (left, TARQUIN) and proposed preprocessing pipeline (right, Matlab). Inline images display the effects of the phase correction step on the baseline.
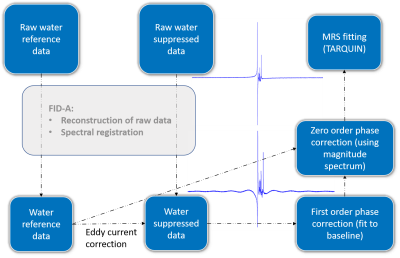
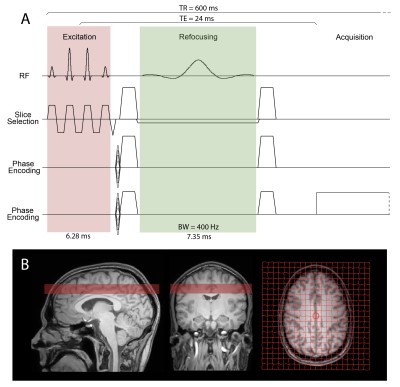
    Fig 1. Preprocessing pipeline (Matlab), including spectra alignment, eddy current correction and the proposed automatic zero and first order phase correction.
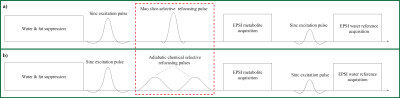
  • Phase Correction in IDEAL-type Rapid Spectroscopic Imaging
    Nour EL SABBAGH1, Carine CHASSAIN1, Hélène RATINEY2, Guilhem PAGES1, and Jean-Marie BONNY1
    1INRAE, AgroResonance, UR QuaPA, F-63122, Saint-Gènes-Champanelle, France, 2University of Lyon, INSA‐Lyon, Université Claude Bernard Lyon 1, UJM Saint-Etienne, CNRS, Inserm, CREATIS UMR 5220, U1206, F‐69621, Lyon, France
    In IDEAL-type sequences, sequence-dependent phase errors are likely to be accumulated alongside the CS's targeted phase, disturbing the spectral study. These phase errors are due to different frequency switching cases during the pulse sequence and slice or readout position shifting.
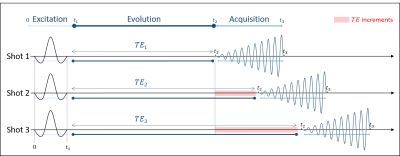
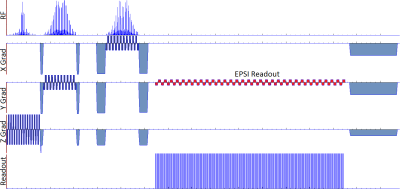
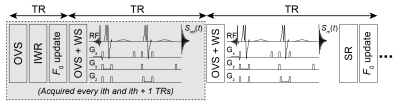
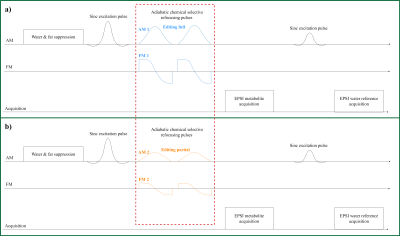
    Figure 1: Illustration of the IDEAL SPIRAL spectral encoding scheme. It consists of Radiofrequency (RF) pulses applied during an excitation time (t1), and acquisition with spiral-OUT spatial encoding (t3-t2) applied after an echo time (TE=t2-t1). Several shots are used to encode the spectral information, which is targeted during the evolution time (TE), while slightly increasing the TE after each shot (TEm is the echo time of the mth shot). Three shots are presented, but this pulse sequence is true for m shots.
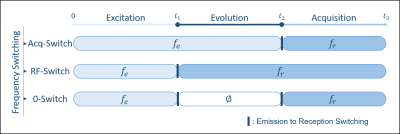
    Figure 2: Illustration of the different cases of the emission/reception frequency switching during the pulse sequence timing, leading to different frequency dependence during the evolution times. Acq-Switch case: fe-fr switch before the acquisition at t2, and the CS behaviour detection is done in reference to fe. RF-Switch case: fe-fr switch before the evolution time at t1, hence CS behaviour detection done in reference to fr. Double 0-Switch case: fe-0 switch for the evolution time at t1, 0-fr switch at the end of it at t2.
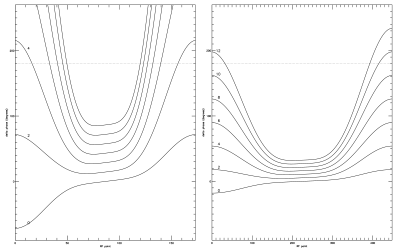
  • Computation of Cramér-Rao Lower Bounds (CRLB) for spectral baseline shapes
    Kelley M. Swanberg1, Martin Gajdošík1, Karl Landheer1, and Christoph Juchem1,2
    1Biomedical Engineering, Columbia University School of Engineering and Applied Science, New York, NY, United States, 2Radiology, Columbia University Medical Center, New York, NY, United States
    Here we treat spectral baselines as piecewise polynomial shapes akin to metabolite basis functions to show that amplitude Cramér-Rao Lower Bounds (CRLB) can under some circumstances offer precision estimates on baseline parameters themselves as well as increase metabolite CRLB accuracy. 
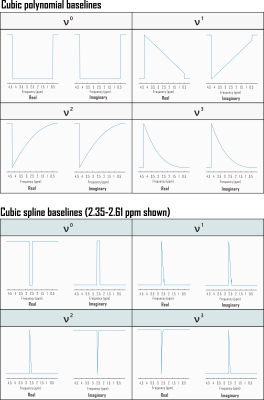
    Fig. 1. Partial derivatives of linear combination model with respect to complex baseline shapes for Fisher information matrix calculation. Shown here are the Fourier transforms of example real and imaginary polynomial and spline baseline components incorporated into the Fisher information matrix used to estimate Cramér-Rao Lower Bounds (CRLB) for linear combination model fits to simulated in vivo sLASER (TE 20.1 ms) metabolite proton spectra. Each shape is scaled by its corresponding polynomial coefficient for direct calculation of relative CRLBs. ppm: parts per million.
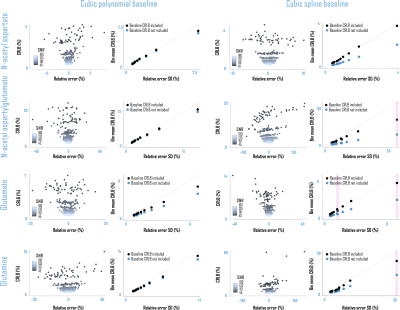
    Fig. 5. Baseline Cramér-Rao Lower Bounds (CRLB) improved metabolite CRLB accuracy. Calculating amplitude CRLBs for polynomial or spline baselines directly from the Fisher information matrix improved correspondence between metabolite amplitude CRLBs and parameter estimate standard deviations (S.D.) by SNR (before=blue; after=black). Correspondent with Fig. 4, non-normal distributions (pink), for which S.D. may not be an appropriate measure of parameter variability, were observed more often for fits using spline than polynomial baselines. ppm: parts per million.
  • Accounting for bias in estimated metabolite concentrations from cohort studies as caused by limiting the fitting parameter space
    Rudy Rizzo1 and Roland Kreis1
    1Department of Radiology and Biomedical Research, University of Bern, Bern, Switzerland
    Limiting the parameter space to meaningful values when fitting MR spectra introduces bias in cohort averaging. A correction term can reduce this bias whereas extending the parameter space can eliminate it.
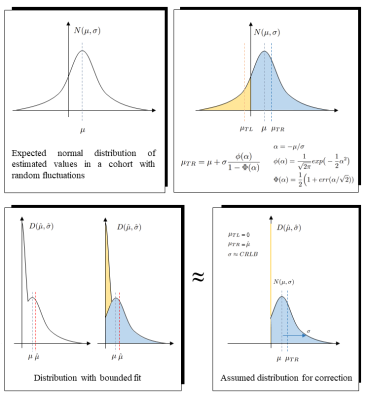
    Figure 2: Top: cohort distribution with unbounded fitting algorithm and pertinent formulae. µ: ground truth mean, σ: ground truth std. µTR: mean of right truncated distribution, µTL: mean of left truncated distribution. Bottom: cohort distribution with 0+ fitting boundary. Limiting parameter space skews the Gaussian distribution. The negative tail is mapped to a small interval around 0+. Assuming its contribution to equal 0, the true mean can be reconstructed from its distorted version.
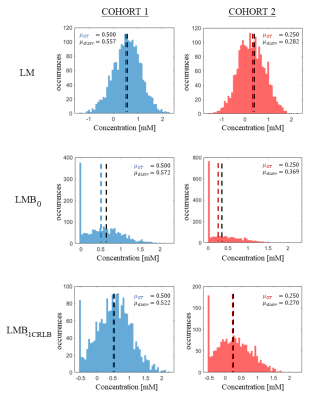
    Figure 3: histogram of estimated concentrations for GABA in three different parameter space settings. Cohort 1 is depicted in the left column and cohort 2 in the right. µGT: ground truth concentration. µdistr: distribution estimated concentration.
  • Data-driven bases optimization for fitting of in vivo MR spectra
    Alexander Saunders1,2 and Stefan Bluml1,2
    1Radiology, Children's Hospital Los Angeles/USC, Los Angeles, CA, United States, 2Rudi Schulte Research Institute, Santa Barbara, CA, United States
    Simultaneous fitting of sets of in vivo spectra could potentially be used to optimize basis spectra
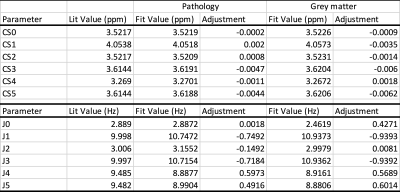
    Table 1: Comparison of published [3] vs. optimized chemical shift positions and J-couplings for myo-inositol
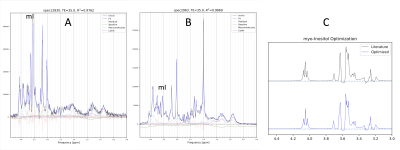
    Figure 1: Examples of individual 3T, PRESS TR=2000ms, TE=35ms spectra of abnormal tissue with prominent mI (A) and of normal grey matter (B). C: Myo-inositol basis spectra before and after optimization.
  • The effect of basis sets on the analysis of in vivo brain MRS data obtained with standard PRESS sequences
    Martin Gajdošík1, Karl Landheer1, Kelley M. Swanberg1, Lawrence S. Kegeles2,3,4, Dikoma C. Shungu5, Camilo de la Fuente-Sandoval6,7, and Christoph Juchem1,4
    1Department of Biomedical Engineering, Columbia University, New York City, NY, United States, 2Department of Psychiatry, Columbia University College of Physicians and Surgeons, New York City, NY, United States, 3New York State Psychiatric Institute, New York City, NY, United States, 4Department of Radiology, Columbia University Medical Center, New York City, NY, United States, 5Weill Cornell Medicine, New York City, NY, United States, 6Laboratory of Experimental Psychiatry, Instituto Nacional de Neurología y Neurocirugía, Mexico City, Mexico, 7Department of Neuropsychiatry, Instituto Nacional de Neurología y Neurocirugía, Mexico City, Mexico
    The impact of using realistic basis set, simulated with accurate RF pulses, timings, and other sequence details, versus a less realistic basis set, at the same TE is investigated here for PRESS spectra at 3 T. It is shown that inaccurate basis information leads to spectral quantification errors.
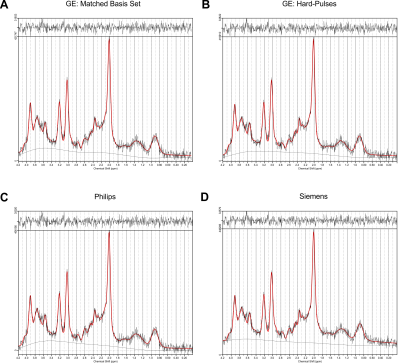
    Figure 2: Example spectrum measured with GE’s standard product implementation of the PRESS sequence and fitted with four different PRESS basis sets of matched TE 35 ms. The original data are in black, the fit is depicted in red. The upper part of the figures represents the residual signal after fitting. A – Matched GE basis set; B – Basis set based on GE timings, but using hard-pulses; C – Basis set for Philips’ PRESS; D – Basis set for the Siemens’ PRESS. Individual fits were printed from LCModel.
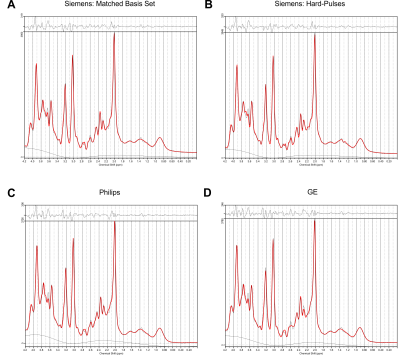
    Figure 3: Example spectrum measured with Siemens’s standard product implementation of the PRESS sequence and fitted with four different PRESS basis sets of matched TE 35 ms. The original data are in black, the fit is depicted in red. The upper part of the figures represents the residual signal after fitting. A – Matched Siemens basis set; B – Basis set based on Siemens timings, but using hard-pulses; C – Basis set for Philips’ PRESS; D – Basis set for the GE’s PRESS. Individual fits were printed from LCModel.
  • Bayesian deep learning-based 1H-MRS of the brain: Metabolite quantification with uncertainty estimation using Monte Carlo dropout
    HyeongHun Lee1 and Hyeonjin Kim1,2
    1Department of Biomedical Sciences, Seoul National University, Seoul, Korea, Republic of, 2Department of Radiology, Seoul National University Hospital, Seoul, Korea, Republic of
    The proposed Bayesian deep learning-based approach in 1H-MRS of the brain provides both metabolite content and corresponding uncertainty, and therefore can be advantageous over the standard convolutional neural networks approaches in consideration of clinical application.
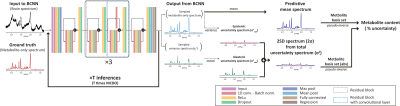
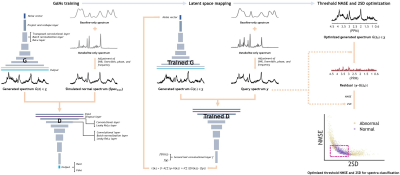
    Figure 1. The training of the BCNN and the estimation of metabolite content and corresponding uncertainty. The metabolite content is estimated by multiple regression using the metabolite basis set and the predictive mean spectrum that is the mean spectrum over the BCNN-predicted metabolite-only spectra (number of spectra = T (number of inferences)). The uncertainty in metabolite content is estimated by multiple regression using the 2SD spectrum. In this case, the metabolite basis set is used in absolute mode in accordance with the 2SD-spectrum.
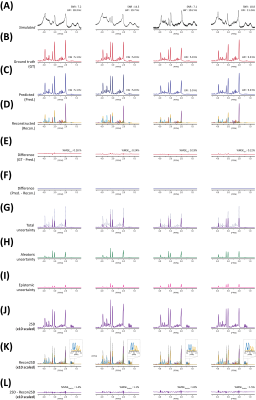
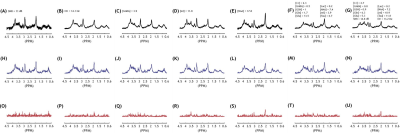
    Figure 2. (A) 4 representative simulated spectra (BCNN input). (B) Ground truth (GT) spectra. (C) BCNN-predicted spectra. (D) Reconstructed spectra using the estimated metabolite content and metabolite bases. (E) Difference spectra (GT – Predicted). (F) Difference spectra (Predicted – reconstructed). (G) Total uncertainty spectra (= (H) aleatoric + (I) epistemic uncertainty) (BCNN-predicted spectra shown in dotted line). (J) 2SD spectra. (K) Reconstructed 2SD spectra using the estimated uncertainty and metabolite bases. (L) Difference spectra (2SD – reconstructed 2SD).
  • Impact of training size on deep learning performance in in vivo 1H MRS
    Sungtak Hong1 and Jun Shen1
    1National Institute of Mental Health, National Institutes of Health, Bethesda, MD, United States
    The present study demonstrated that the benefit of larger training data sizes could be marginal after reaching a threshold number of datasets in training a convolutional neural network to restore degraded in vivo 1H MRS spectra. 
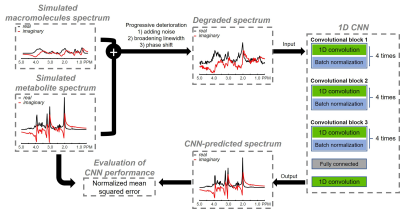
    Figure 1. Schematic overview illustrating the generation of dataset and the proposed network architecture featuring consecutive three convolutional blocks. A pair of 1D convolutional layer and batch normalization layer act as a fundamental component with four times repetitions for completing each block. Network training was conducted with pairs of ground truth spectra and progressively degraded spectra while minimizing the mean squared error using Adam optimization algorithm. Learning rate was set to 10-4.
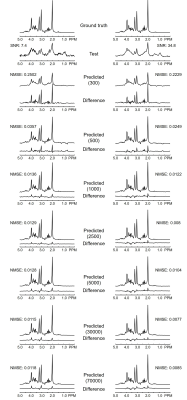
    Figure 2. Numerically calculated 1H MRS spectra at low SNR (left column) and high SNR (right column). CNN-predicted spectra, difference spectra (ground truth – predicted), and NMSE illustrate the impact from using different training sizes in CNN.
  • Application of Deep Leaning Model for Quality Control of Short-echo 7T MRSI with Various Disease Types
    Huawei Liu1, Emily Xie1, Helene Ratiney2, Michael Sdika2, and Yan Li1
    1Department of Radiology and Biomedical Imaging, University of California, San Francisco, San Francisco, CA, United States, 2Univ. Lyon, INSA-Lyon, Université Claude Bernard Lyon 1, UJM-Saint Etienne, CNRS, Inserm, Lyon, France
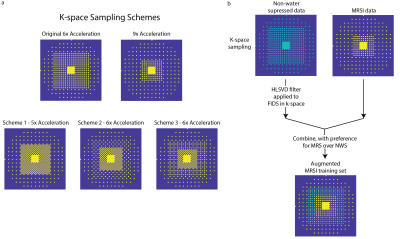
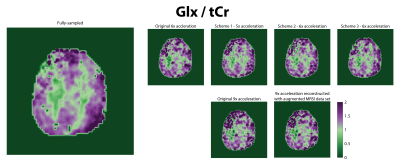
    Deep learning approach for artifacts filtering was explored and applied on in vivo 7T MRSI datasets acquired from healthy controls and patients with various diseases. An AUC of 0.966 was consistently achieved with different inputs combinations. Ongoing work is in progress for better metrics.
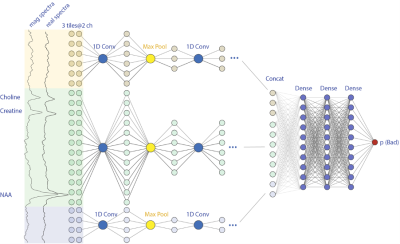
    Figure 1. The convolutional neuronal network diagram for taking 3 tiles separated real and magnitude spectra as inputs. The final output value indicates the probability for bad label.
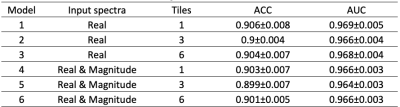
    Figure 2. Models with different spectra inputs and tiles and the tested ACC and AUC results. No difference was found between including or not tissue ratios.
  • Deep Learning Using Synthetic Data for Signal Denoising and Spectral Fitting in Deuterium Metabolic Imaging
    Abidemi Adebayo1, Keshav Datta2, Ronald Watkins2, Shie-Chau Liu2, Ralph Hurd2, and Daniel Mark Spielman2
    1Mechanical Engineering, Stanford University, Stanford, CA, United States, 2Radiology, Stanford University, Stanford, CA, United States
    Deuterium metabolic imaging, a promising tool to probe in vivo glucose metabolism, is severely limited by SNR. In this work we show that an autoencoder network trained using only synthetic data can reduce noise and provide a good spectral fit.
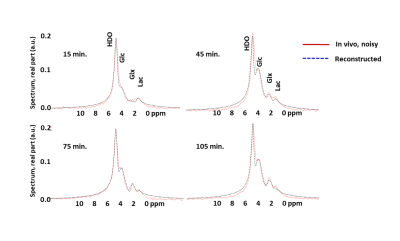
    Figure 3 Reconstructed spectra from the neural network (dotted blue lines), compared with the spectra from human brain obtained 15, 45, 75 and 105 minutes post oral ingestion of deuterated glucose (solid red lines).
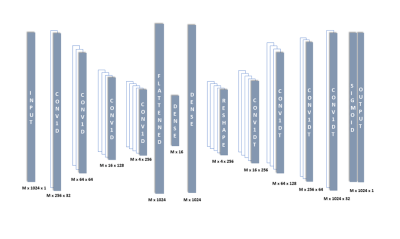
    Figure 1 Autoencoder architecture used for denoising and fitting the spectrum.
  • Deep Learning Based MRS Metabolite Quantification: CNN and ResNet versus Non Linear Least Square Fitting
    Federico Turco1, Irena Zubak2, and Johannes Slotboom1
    1Institute of Diagnostic and Interventional Neuroradiology / SCAN, University Hospital Bern and Inselspital, University Bern, Bern, Switzerland, 2Neurosurgery, University Hospital Bern and Inselspital, University Bern, Bern, Switzerland
    Deep learning based metabolite quantification of in vivo MRSI data using CNN and ResNet were performed and compared to traditional NLLS-quantification. Accuracy measures were given, and both methods seem a viable alternative state of the art NLLS quantification.
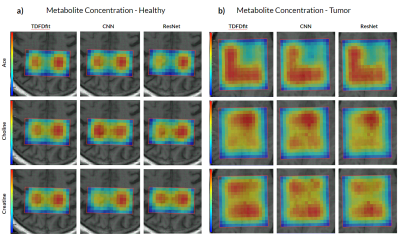
    Figure 3: Metabolite concentration mapping for Ace, Choline, and Creatine in rows 1, 2, and 3 respectively. Obtained by the three different methods, in (a) healthy brain spectra while (b) is a brain tumor.
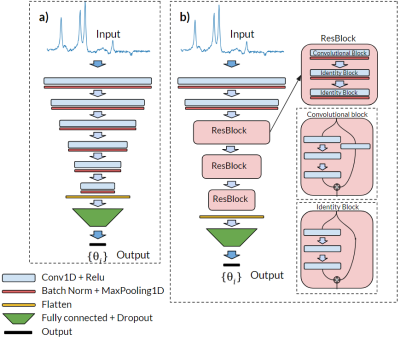
    Figure 1: Representation of both implemented neural networks, an CNN (a) and a ResNet (b). In both cases, the input and output are exactly the same, and all the convolutional layers have the same kernel size of 3.
  • Quantification of 2D-MRSI Datasets using Random Forest Regression Comparing to Prior Knowledge Based Spectral Fitting applied to  Brain Tumors
    Brigitte Schweisthal1, Federico Turco1, Raphael Meier1, Irena Zubak2, and Johannes Slotboom1
    1Neuroradiology / Support Center for Advanced Neuroimaging (SCAN), University Hospital and Inselspital, University Bern, Bern, Switzerland, 2Neurosurgery, University Hospital and Inselspital, University Bern, Bern, Switzerland
    This work deals with quantification of clinical 1H-MRSI data using machine learning. RF-regressors were determined based on 10000 simulated TD & FD responses obeying a prior knowledge model. RF-regression is a valid alternative for quantification with comparative accuracy as NLLS-fitting.
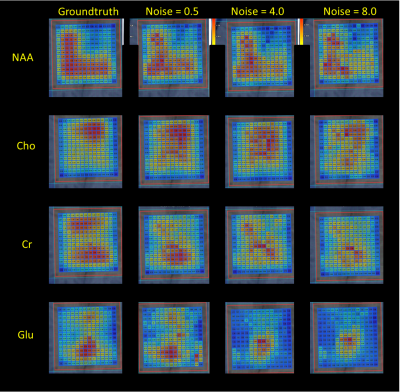
    Figure 3: The first column displays the GT peak area maps as found by TDFDFit. The second column displays the RF-regressor predicted maps for the noise level 0.5 of the in vivo semiLASER data sets. The third and the fourth column show the predicted maps of noise level = 4 and noise level = 0.5. Example signals with very poor and extreme poor SNR are displayed in Figure 4.
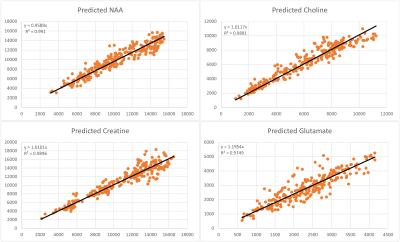
    Figure 4: This figure shows the x-y-scatter plots for NAA, Cho, Cr, and Glu peak area parameters: horizontally the GT value obtained with TDFDFit, and vertically the RF-regressor predicted area parameter values. For NAA the coefficient of determination is best namely R2=0.991, for Cho -> R2=0.988 ,for Cr -> R2=0.989 and for Glu the worst namely R2=0.975. Note that the slope of all linear regression lines is between 0.96 for NAA and maximum 1.26 for Glu, in accordance with Cramér-Rao minimum variance bounds.
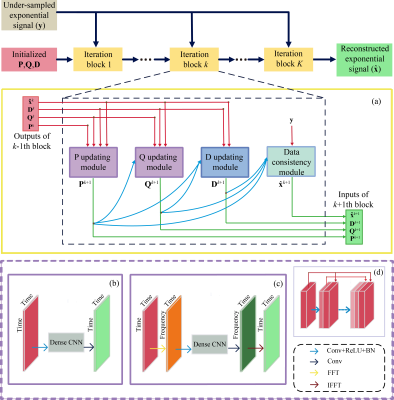
  • In vivo Cerebellum MRSI reconstruction by domain-transform manifold learning
    Neha Koonjoo1,2,3, Adam Berrington4, Bo Zhu2,3,5, Uzay E Emir6,7, and Matthew S Rosen2,3,5
    1Department of Radiology, A.A Martinos Center for Biomedical Imaging / MGH, Charlestown, MA, United States, 2Harvard Medical School, Boston, MA, United States, 3Department of Physics, Harvard University, Cambridge, MA, United States, 4Sir Peter Mansfield Imaging Centre, School of Physics and Astronomy, University of Nottingham, Nottingham, United Kingdom, 5Radiology, A.A Martinos Center for Biomedical Imaging / MGH, Charlestown, MA, United States, 6School of Health Sciences, Purdue University, West Lafayette, IN, United States, 7Weldon School of Biomedical Engineering, Purdue University, West Lafayette, IN, United States
    A deep neural network based on the AUTOMAP formalism to reconstruct metabolic cycle FIDs into spectral domain. Density matrix formalism was used to generate up/downfields of 1H FIDs of 27 metabolites. The proposed strategy was validated on noisy simulated FIDs and an in vivo cerebellum 3T data.
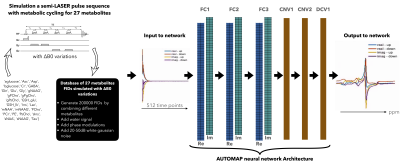
    Figure 1a: Proposed strategy to learn the entire end-to-end inverse function and low dimensional representations of spectroscopic signals – (from left to right) Building the training database: The 27 metabolites FIDs were simulated with a sLASER pulse sequence with metabolic cycling and B0 variations. The simulated metabolites FIDs were used to create the training database by combining metabolites, water signal, phase modulations and 20-50dB of gaussian noise. The input/output to the network was the real and imaginary component of metabolic cycle FIDs/spectra (see Methods).
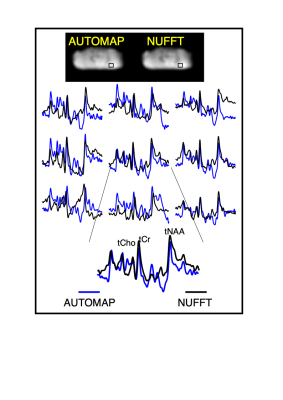
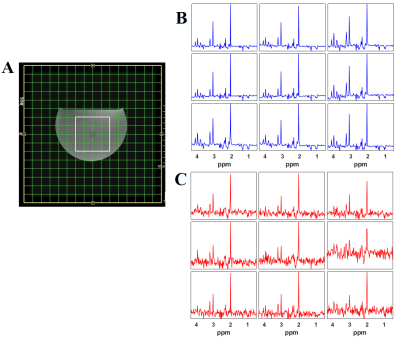
    Figure 3: In vivo cerebellum MRSI reconstruction with AUTOMAP. (from top to bottom) The AUTOMAP and NUFFT reconstructed summed image from the 1st time point are shown. The metabolite-only spectra with a range from 0.5 to 4.2 ppm from the 9 different voxels (represented by the black box in the images) are displayed in blue for AUTOMAP and in black for NUFFT. At the bottom an enlarged spectra with the corresponding metabolite peaks (total Choline (tCho), NAA (tNAA) and Creatine (tCr) is represented.
  • On the quantification of the striatum neurochemical profile using STEAM MRS: a comparison of 3T versus 7T in a cohort of elderly subjects
    Ana Gogishvili1,2, Christopher E. J. Doppler3,4, Ezequiel Farrher1, Aline Seger3,4, Michael Sommerauer3,4, Ketevan Kotetishvili2, and N. Jon Shah1,5,6,7
    1Institute of Neuroscience and Medicine 4, Medical Imaging Physics, Forschungszentrum Jülich, Jülich, Germany, 2Engineering Physics Department, Georgian Technical University, Tbilisi, Georgia, 3Institute of Neuroscience and Medicine 3, Forschungszentrum Jülich, Jülich, Germany, 4University of Cologne, Faculty of Medicine and University Hospital Cologne, Department of Neurology, Cologne, Germany, 5Institute of Neuroscience and Medicine 11, Forschungszentrum Jülich, Jülich, Germany, 6JARA BRAIN Translational Medicine, RWTH Aachen University, Aachen, Germany, 7Department of Neurology, Faculty of Medicine, RWTH Aachen University, Aachen, Germany

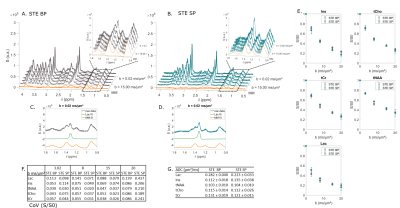
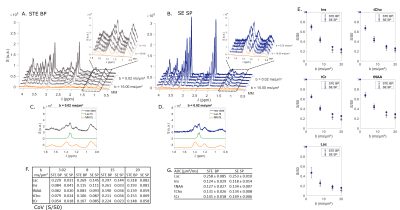
    We quantified the neurochemical profile of the human striatum in vivo in healthy control subjects acquired with a single voxel STEAM MRS sequence at 3T and 7T. To this end, we quantified the tissue differences for 12 reliably detected metabolites.

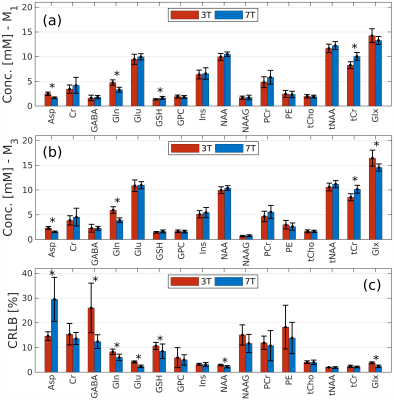
    Figure 4. The mean metabolite concentrations across the whole group of subjects, for methods M1 (a), M3 (b), and the CRLB values (c). Total concentrations tCho=GPC+PCh, tNAA=NAA+NAAG, tCr=Cr+PCr and Glx=Glu+Gln are additionally shown.
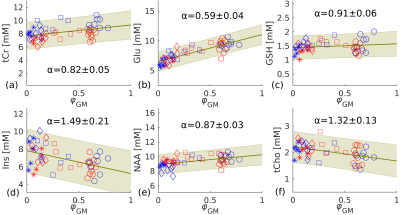
    Figure 3. Linear regression (green line) estimated for tCr (a), Glu (b), GSH (c), Ins (d), NAA (e), tCho (f) using pooled 3T and 7T data. Metabolite concentrations of individual subjects determined from pooled results (3T and 7T) and the calculated α value for each metabolite. Different shapes represent different brain areas (o: striatum; ⧠: frontal WM; ◊: parietal WM; *: occipital WM). Blue and red points represent data from 7T and 3T, respectively. The green shaded area highlights the 95% confidence band.
  • The influence of spectral registration on diffusion-weighted magnetic resonance spectroscopy ADC estimates.
    Christopher W Jenkins1
    1CUBRIC, Cardiff University, Cardiff, United Kingdom
    Simulated data are used to examine spectral registration and its new robust iteration in the context of diffusion-weighted MRS. The accuracy of these methods is examined across a broad range of SNR, and the effect they have on ADC estimates, investigated.
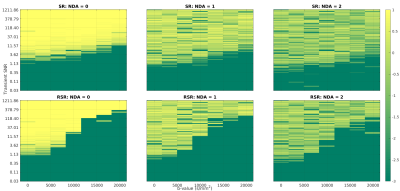
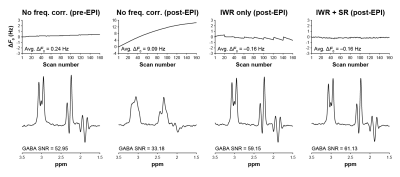
    Fig.1: Frequency correction fidelity for SR and RSR with two increments of direct averaging. A frequency correction fidelity of 1 indicates perfect correction, 0 indicates correction was as effective as no correction, and a value less than 0 is worse than no correction. RSR performs better for low b data than high b-value data, indicating a potential for bias in diffusion fits. While DA provides a marginal gain in the effective domain of both SR and RSR, it compromises the fidelity of higher SNR data.

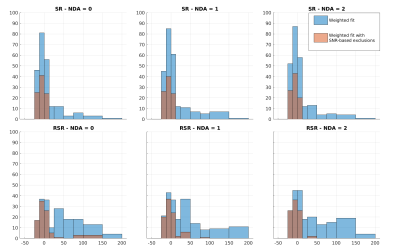
    Fig.4: Histograms of the percentage deviation from known the ADC. Data are pooled from the fits of TNAA, TCho, and MyI, and diffusion fits with $$$R^2$$$<0.75 were excluded. The blue bars represent fits of all data, while orange bars are data fit after excluding points with SNR < 2. Here a negative value indicates an underestimation of the ADC, while a positive value indicates overestimation. All methods tended to overestimation, suggesting that higher b-values were disproportionately affected by incoherent averaging. However, filtering based on SNR remedies this to an extent.