-
Limits of Turbulent Flow Spectrum Encoding using 4D Flow MRI
Hannes Dillinger1, Charles McGrath1, and Sebastian Kozerke1
1Institute for Biomedical Engineering, University and ETH Zurich, Zurich, Switzerland
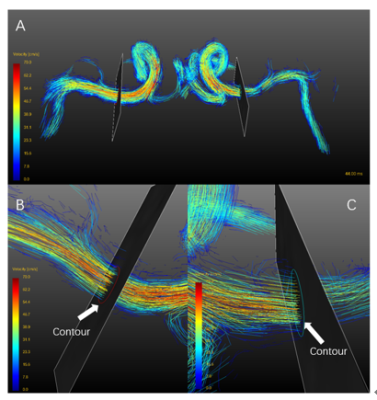
Using CFD and MRI particle tracking simulations, we demonstrate that velocity encoding gradients used in 4D Flow MRI lead to systematic underestimation of Reynolds Stress Tensor values of stenotic flows.
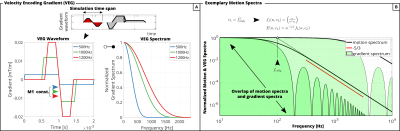
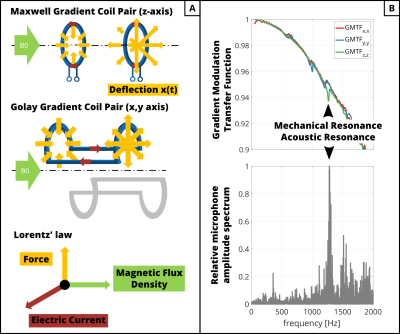
Figure 1: (A) VEG waveforms used in simulation and corresponding spectra. (B) The overlap of motion spectra and VEG spectra defines the encoding power of the VEG. Depending on the eddy frequency$$$\;f_{eddy}\;$$$, VEGs can exhibit insufficient spectral coverage.
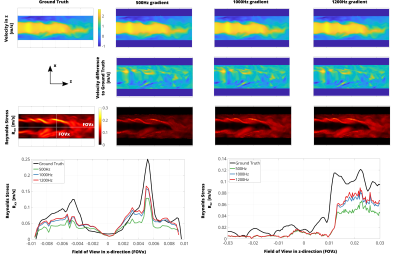
Figure 3: (A) Simulation results for VEGs of different frequencies. While mean velocity is estimated without bias, RST values are underestimated depending on VEG frequency. Increasing the VEG frequency reduces underestimation of RST values. (B) Profiles along FOVx and FOVz for estimated RST vs. Ground Truth.
-
Automatic and robust background phase correction on phase-contrast MRI using M-estimate SAmple Consensus (MSAC)
Carola Fischer1, Jens Wetzl1, Tobias Schäffter2,3,4, and Daniel Giese1
1Magnetic Resonance, Siemens Healthcare GmbH, Erlangen, Germany, 2Physikalisch-Technische-Bundesanstalt (PTB), Braunschweig and Berlin, Germany, 3Department of Medical Imaging, Technical University of Berlin, Berlin, Germany, 4School of Imaging Sciences and Biomedical Engineering, King's College London, London, United Kingdom
MSAC enables robust background phase correction
in presence of wrap-around without extensive parameter tuning. RMSE was reduced
from 1.71±0.34cm/s
(static fit correction) to 0.78±0.07cm/s (MSAC) for wrap-around cases.
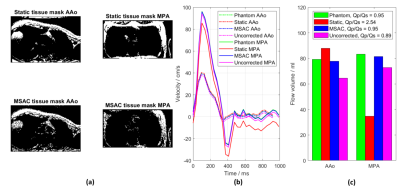
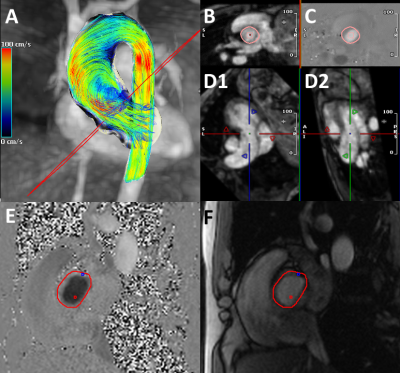
Figure 2: A
comparison of masks and flow curves in the AAo and MPA for one volunteer before
and after phantom/second-order correction. MSAC shows superior performance by
avoiding wrap-around regions compared to the static tissue mask (a). This leads
to a correction of the flow curves (b) similar to the phantom correction and
consequently to improved flow volumes and QP/QS-ratio (c).
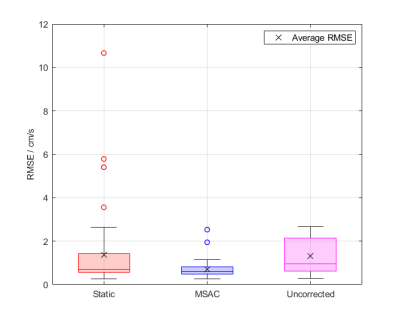
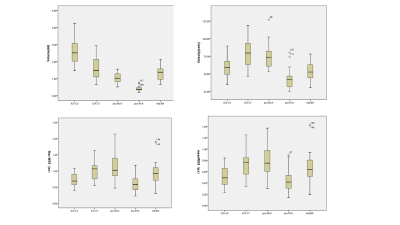
Figure 5: Boxplot
showing the RMSE performance over all acquisitions. While static fit corrections
are beneficial in most cases compared to no correction, MSAC shows best median
and interquartile performance over all cases. The MSAC outliers correspond to
two images, both with severe wrap-around leading to more wrap-around pixels than
no wrap-around.
-
Dual-venc Dual-echo 2D Cine Phase-contrast MRI
Jihye Jang1,2, Yansong Zhao1, Jouke Smink3, Andrew J Powell2, and Mehdi H Moghari2
1Philips Healthcare, Gainesville, FL, United States, 2Department of Pediatrics, Harvard Medical School, Boston, MA, United States, 3Philips Healthcare, Best, Netherlands
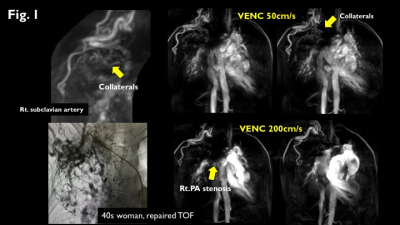
To
improve VNR without velocity aliasing, we developed a novel dual-venc dual-echo 2D cine PC sequence where high and low-venc data are acquired within a single
TR and used for velocity measurement. In 10 patients, the dual-venc PC
demonstrated higher VNR and similar blood flow measurements.
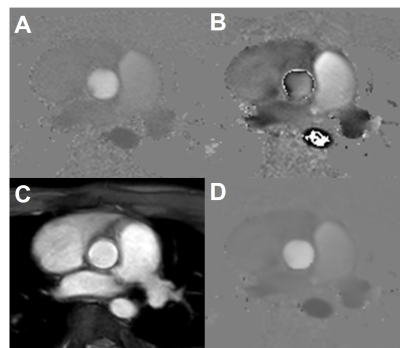
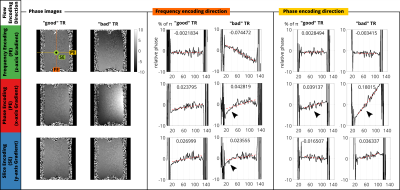
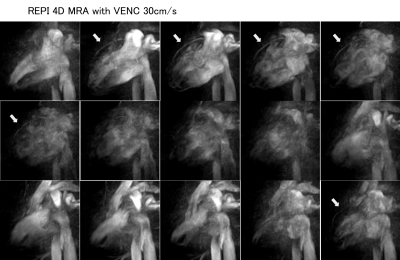
Figure
2. Velocity was measured by unwrapping the velocity of the low-venc and
using the high-venc phase image as an unwrapping threshold. A) Phase image from
a high-venc acquisition with a low VNR. B) Phase image from low-venc
acquisition with a high VNR and velocity aliasing. C) Magnitude image averaged
from both echoes. D) Combined phase image with the VNR of the lower venc image without
the velocity aliasing artifacts.
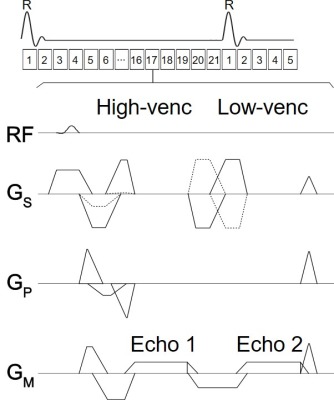
Figure
1. Sequence diagram of a retrospective ECG-gated 2D cine dual-venc
dual-echo PC MRI. High and low-venc data were acquired within a single TR to
minimize the acquisition time associated with the additional venc.
-
The impact of compressed sensing L1-ESPIRiT reconstruction on the velocity vector fields acquired by 4D-flow MRI: A comparison to L2-ESPIRiT
Ali Nahardani1,2, Simon Leistikow2,3, Martin Krämer1,4, Karl-Heinz Herrmann1, Wan-Ting Zhao1,2, Daniel Güllmar1, Lars Linsen3, Jürgen R. Reichenbach1, and Verena Hoerr1,2,5
1Medical Physics Group, Institute of Diagnostic and Interventional Radiology, Jena University Hospital - Friedrich Schiller University Jena, Jena, Germany, 2Center for Sepsis Control and Care, Jena University Hospital, Jena, Germany, 3Institute of Computer Science, Department of Mathematics and Computer Science, Westfälische Wilhelms-Universität Münster, Muenster, Germany, 4Institute of Diagnostic and Interventional Radiology, Jena University Hospital - Friedrich Schiller University Jena, Jena, Germany, 5Clinic for Radiology, University Hospital Muenster, Muenster, Germany
The L1-ESPIRiT reconstruction changes the spatial velocity profiles, preserves the directional information of the velocity vector field and underestimates its magnitude in comparison to L2-ESPIRiT for different undersampling factors.
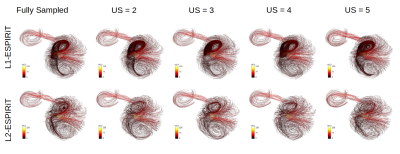
Representative streamline reconstructions from different measurements on Phantom-B with varying undersampling factors using the L1- and L2-ESPIRiT algorithm. The structure and density of streamlines were obviously preserved by the L1-ESPIRiT reconstruction in comparison to L2-ESPIRiT.
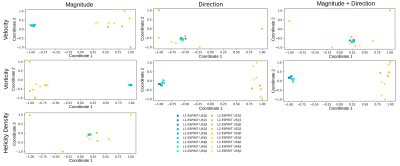
2D embedding of pairwise dissimilarities using MDS for velocity, vorticity, and helicity density fields, respectively, for Phantom B. The pairwise Euclidean distances between points resemble pairwise field dissimilarity. The axes are dimensionless and only depict the relative volumetric dissimilarity normalized to the maximum dissimilarity value.
-
Whole-heart 4D flow MRI: comparison between pseudo-spiral undersampling with compressed sensing reconstruction and EPI readout
Carmen P S Blanken1, Lukas M Gottwald2, Jos J M Westenberg3, Eva S Peper2, Bram F Coolen4, Gustav J Strijkers4, Aart J Nederveen2, R Nils Planken2, and Pim van Ooij2
1Radiology and Nuclear Medicine, Amsterdam UMC, Amsterdam, Netherlands, 2Radiology and Nuclear Medicine, Amsterdam UMC, location AMC, Amsterdam, Netherlands, 3Radiology, Leiden UMC, Leiden, Netherlands, 4Biomedical Engineering and Physics, Amsterdam UMC, location AMC, Amsterdam, Netherlands
We show that pseudo-spiral CS 4D flow MRI is at least as reliable as EPI-based 4D flow MRI in measuring blood flow across the heart valves and may be accelerated further to expedite clinical implementation.
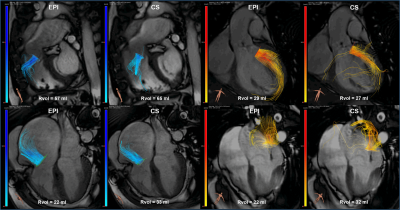
Figure 2: EPI and CS 4D flow MRI streamline visualizations in
four different patients with: pulmonary valve regurgitation (top left), aortic
valve regurgitation (top right), tricuspid valve regurgitation (bottom left)
and mitral valve regurgitation (bottom right). Semi-automated retrospective valve
tracking was performed on bSSFP cine images, on two orthogonal views for each
heart valve. Rvol = regurgitant volume.
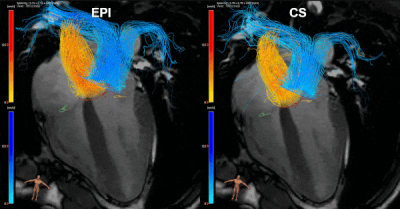
Figure
1: EPI and CS 4D flow MRI streamline visualizations of
blood flow through the aortic valve (yellow contour), mitral valve (orange),
pulmonary valve (blue) and tricuspid valve (green) in a 28-year old healthy
volunteer, resulting from semi-automated retrospective valve tracking. Valve
tracking was performed on bSSFP cine images, on two orthogonal views for each
heart valve. 4-chamber bSSFP view is visible in the background.
-
Echo Planar Imaging induced errors in intracardiac 4D MRI flow quantification
Jos J.M. Westenberg1, Hans C van Assen1, Pieter J van den Boogaard1, Jelle J Goeman1, Hicham Saaid2, Jason Voorneveld3, Johan Bosch3, Sasa Kenjeres4, Tom Claessens2, Pankaj Garg5, Marc Kouwenhoven6, and Hildo J Lamb1
1Leiden University Medical Center, Leiden, Netherlands, 2Ghent University, Ghent, Belgium, 3Erasmus Medical Center, Rotterdam, Netherlands, 4University of Technology Delft, Delft, Netherlands, 5Norwich University Hospital, Norwich, United Kingdom, 6Philips Healthcare, Best, Netherlands
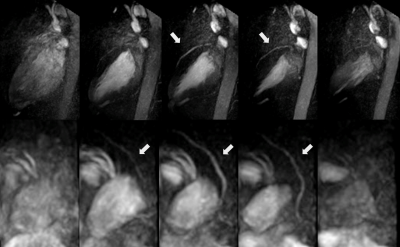
Echo Planar Imaging (EPI) is associated with
inaccurate velocity quantitation in 4D flow MRI and errors depend on
the orientation of readout and blip phase encoding gradient. This study evaluates EPI-related errors for in vivo intracardiac 4D flow MRI in a phantom and in healthy volunteers.
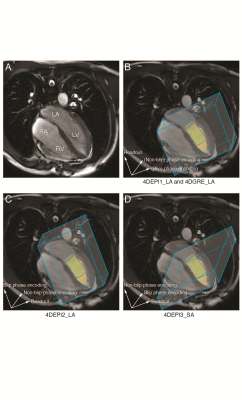
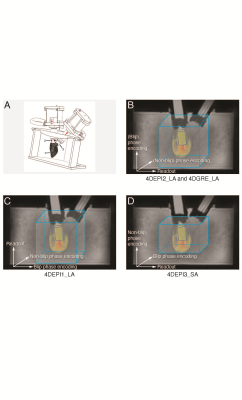
In
A, the 4-chamber is shown (LV: left ventricle, LA: left atrium, RV: right
ventricle, RA: right atrium). In B-D, gradient orientations for 4DEPI and 4DGRE
are shown, similar as for the LV phantom. 4DEPI1_LA: long-axis oriented EPI with
readout gradient parallel to the main flow, 4DEPI2_LA: long-axis oriented EPI with
blip phase encoding gradient parallel to the main flow, 4DEPI3_SA: short-axis
oriented EPI with both readout and blip phase encoding gradients perpendicular
to the main flow. A cylinder-shaped control volume is positioned below the
mitral valve.
In A,
1 indicates the LV phantom, 2 and 3 indicate bioprosthetic mitral and aortic
valve. In B-D, gradient orientations for 4DEPI and 4DGRE are shown. 4DEPI1_LA: long-axis
oriented EPI with readout gradient parallel to the main flow, 4DEPI2_LA: long-axis
oriented EPI with blip phase encoding gradient parallel to the main flow, 4DEPI3_SA:
short-axis oriented EPI with both readout and blip phase encoding gradients perpendicular
to the main flow. A cylinder-shaped control volume is positioned below the
mitral valve.
-
Playing with FIRE: a framework for on-scanner, in-line fully automated 4D-Flow MRI reconstruction, pre-processing and flow visualization
Justin Baraboo1, Michael Scott1, Haben Berhane1, Ashitha Pathrose1, Michael Markl1, Ning Jin2, and Kelvin Chow1,2
1Northwestern, Chicago, IL, United States, 2Cardiovascular MR R&D, Siemens, Chicago, IL, United States
4D Flow MRI suffers from manual off-line post processing. To
address this, we integrated our deep learning tools for automatic 4D Flow
processing within the on scanner reconstruction through Siemen’s Framework for
Image Reconstruction (FIRE) interface, testing on 11 patients and 1 control.
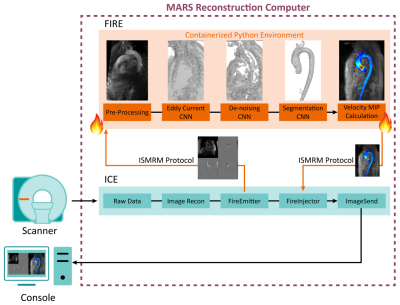
Fig 1. Siemen’s FIRE framework allows for augmentation to Siemen’s image
reconstruction environment (ICE), creating an interface where data can be
requested and sent back into the ICE pipeline via FIRE emitter and injector. Reconstructing
4D-Flow images are sent to a containerized Python environment. A 3D Phase
Contrast MRA is calculated prior to input to turnkey execution of our networks (CNN, outputs above). An aortic MIP cine is calculated from the
velocity data and aortic segmentation and sent back to the ICE pipeline to be
delivered to the console with reconstructed 4D-Flow data.
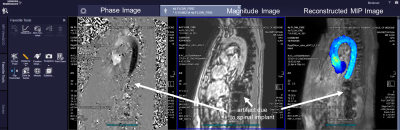
Fig 4. 4D-Flow with integrated aortic
velocity MIP cine visualization using FIRE in a healthy control. The processing
pipeline included deep learning pre-processing and segmentation with calculation
of an aortic velocity MIP cine. The MIP
cine is displayed on the console alongside the standard reconstruction of phase
and magnitude images. Deep learning processing and segmentation performed
successfully despite artifacts from a metallic spinal implant.
-
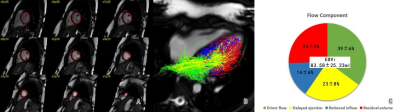
Regurgitant Mitral Valve Jet Flow Dynamics: Systematic Assessment of Flow Entrainment and Momentum Conservation by In-vitro 4D flow MRI
Jeesoo Lee1, Liliana Ma1, Michael Baran Scott1, Alexander Jonathan Barker2, James David Thomas3, and Michael Markl1
1Radiology, Northwestern University, Chicago, IL, United States, 2Radiology, University of Colorado Denver Anschutz Medical Campus, Aurora, CO, United States, 3Cardiology, Northwestern University, Chicago, IL, United States
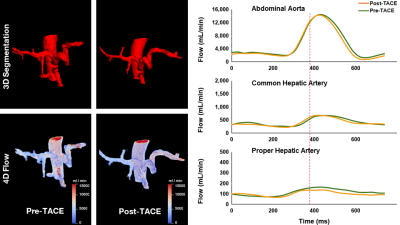
Flow entrainment and momentum conservation in an MR-mimicking jet were demonstrated in-vitro using 4D flow MRI. We
found that jet flow volume may overestimate RVol due to flow entrainment
effect whereas axial jet momentum can be a reliable metric for MR flow characterization using 4D flow MRI.
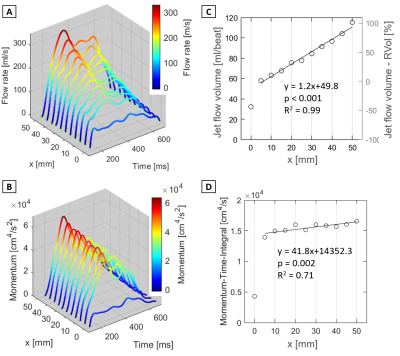
Figure 3. Quantification results of flow and
momentum along the jet axis (voxel size 1.5 mm3 results) A: Flow rate waveform
vs. x [mm] along the jet (see Fig.1 for details). B: Flow momentum
waveform vs. x [mm] along the jet. C:
Total jet flow volume vs. x [mm] along the jet . The right vertical plot axis
indicates the error between RVol by 2D PC MRI. D: Momentum-Time-Integral
vs. x [mm] along the jet. Regression statistics were acquired for x = 5-50 mm.
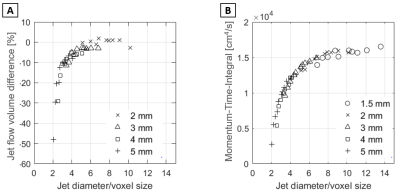
Figure 5. Relative voxel size dependency of flow
quantification. A: Difference in flow volume compared to voxel size 1.5
mm results vs. number of voxels across the jet cross-section. B: MTI vs.
number of voxels across the jet cross-section. The jet diameter was derived by
computing the diameter of a circle with the area equivalent to the peak jet
area.
-
A Pulse Wave Velocity Calculation Tool for 4D flow MRI – Data Requirements and Application in Marfan Patients
Eric Schrauben1, Mitzi van Andel2, Lukas Gottwald1, Aart Nederveen1, Maarten Groenink1,2, and Pim van Ooij1
1Department of Radiology & Nuclear Medicine, Amsterdam University Medical Centers, location AMC, Amsterdam, Netherlands, 2Department of Cardiology, Amsterdam University Medical Centers, location AMC, Amsterdam, Netherlands
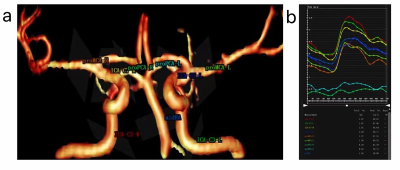
This work develops an
open-source 4D flow MRI pulse wave velocity tool. With it, data
sampling requirements are shown to be reducible by an additional 30% to successfully detect differences between
healthy controls and Marfan syndrome patients.
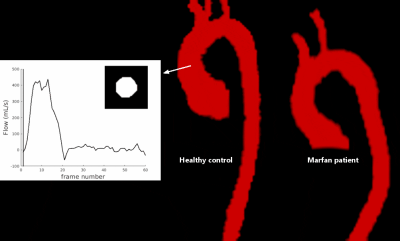
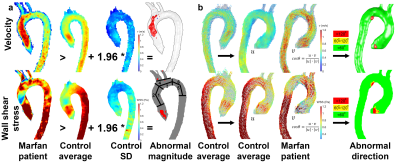
Figure 2. (Animated GIF) Example time-resolved segmentations in subjects
from Figure 1, generated automatically through non-rigid registration of
phase-contrast MR angiographic images at each cardiac time point to a reference
volume. Inset: time-resolved contour in the ascending aorta and resulting flow
waveform over 60 cardiac frames.
-
Impact of gadolinium contrast on image quality and quantitative flow assessment using conventional and compressed sensing 4D flow prototypes
Tilman Stephan Emrich1,2,3, Natalie Ring2, U. Joseph Schoepf1, Ning Jin4, Daniel Sebastian Dohle5, Fei Xiong4, Anna Lena Emrich5,6, Karl-Friedrich Kreitner2, and Akos Varga-Szemes1
1Department of Radiology and Radiological Science, Medical University of South Carolina, Charleston, SC, United States, 2Radiology, University Medical Center Mainz, Mainz, Germany, 3DZHK, Partner-Site Rhine-Main, Mainz, Germany, 4Siemens Medical Solutions USA, Inc., Chicago, IL, United States, 5Department of Cardiothoracic Surgery, University Medical Center Mainz, Mainz, Germany, 6Department of Cardiothoracic Surgery, Medical University of South Carolina, Charleston, SC, United States
In our study, both conventional and CS-accelerated 4D
flow techniques provided accurate flow assessment regardless of the presence of contrast
agent, therefore 4D flow
acquisitions can be performed either before or after GBCA administration.
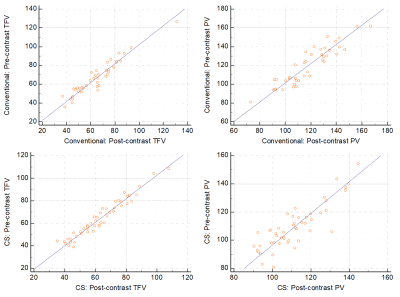
Scatter plots demonstrating correlation between pre-
and post-contrast Total Forward Volume (TFV) and Peak Velocity (PV) measured by
the conventional and CS 4D flow techniques.
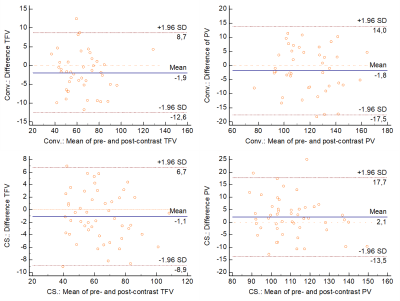
Bland-Altman plots representing the agreement in
pre- and post-contrast Total Forward Volume (TFV) and Peak Velocity (PV)
between the conventional and CS-based 4D flow techniques. Blue solid lines show
the mean of differences, while the dotted lines indicate the upper and lower
limits of agreement (±1.96 SD).
-
Evaluating ICOSA6 4D-Flow in a Compliant Aortic Dissection Model with Large Velocity Range and Complex Flow Patterns.
Judith Zimmermann1,2, Michael Loecher1,3, Tyler Cork1,4, Kathrin Bäumler1, Alison Marsden5,6,7, Dominik Fleischmann1,7, and Daniel Ennis1,3,7
1Radiology, Stanford University, Stanford, CA, United States, 2Computer Science, Technical University of Munich, Munich, Germany, 3Radiology, Veterans Affairs Health Care System, Palo Alto, CA, United States, 4Bioengineering, Stanford University, Palo Alto, CA, United States, 5Pediatrics, Stanford University, Stanford, CA, United States, 6Bioengineering, Stanford University, Stanford, CA, United States, 7Cardiovascular Institute, Stanford University, Stanford, CA, United States
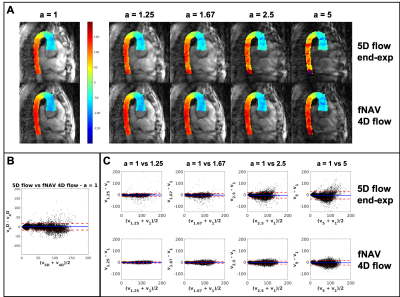
Multi-directional (ICOSA6) 4D-flow
encoding compares well to Cartesian 4D-flow if performed with adequate
sampling. Highly under-sampled (R>40) ICOSA6 4D-flow, however, impairs
qualitative flow visualization, underestimates net flow, results in inaccurate
peak flow measurements.
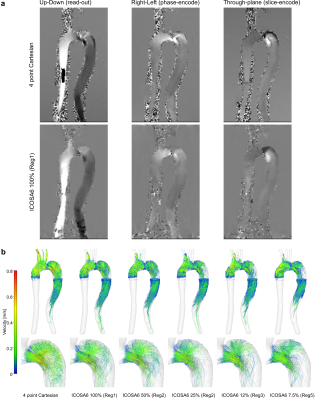
Fig. 2 (a) Phase data for four-point Cartesian and ICOSA6 100%. Smoothing effects
were observed in ICOSA6 data, particularly where
helical flow with a large velocity range is present. Four-point Cartesian included
aliased pixels prior to the model inlet, which was not present in ICOSA6 data. (b) End-diastolic pathlines based on four-point
Cartesian and ICOSA6 data. With increased under-sampling, the pathline travelling
range decreased, the detection of helical flow in the proximal FL becomes more
challenging, and jet flow velocities (entry tear) become smaller.
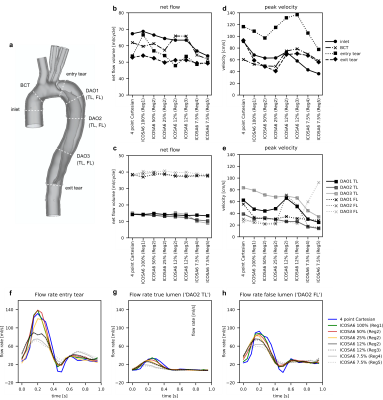
Fig. 3 (a) TBAD cross-sections. (b, c) Calculated net flow and (d, e) peak velocity for four-point Cartesian
and ICSOA6. Conservation of mass dictates that net flow through ‘inlet’ versus
‘BCT, ‘entry tear’ versus ‘exit tear’, all TL sections, as well as all FL
sections should be equal. Flow waveforms shown for the entry tear (f), true lumen (g), and false lumen (h).
Overall, flow waveforms between the four-point Cartesian (blue) and ICOSA6 100%
(green) as well as 50% (red) correspond well. With increased under-sampling of
ICOSA6 reconstructions, peak flow rates decrease by up to 49.1%.
-
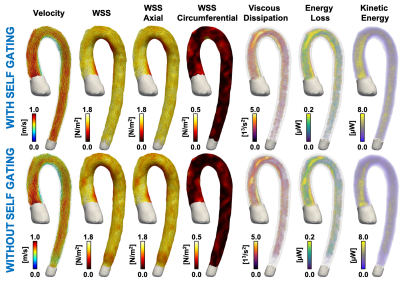
Evaluating Pilot Tone and self-gating for retrospective cardiac binning in highly accelerated, whole heart 4D flow imaging
Aaron Pruitt1, Yingmin Liu1, Ning Jin2, Peter Speier3, Chong Chen1, Orlando Simonetti1, and Rizwan Ahmad1
1The Ohio State University, Columbus, OH, United States, 2Siemens Medical Solutions USA, Inc., Columbus, OH, United States, 3Siemens Healthcare GmbH, Erlangen, Germany
We combine the recently proposed Pilot Tone technology with our previously described highly accelerated fully self-gated whole heart 4D flow framework. We demonstrate good agreement in flow quantification between 4D flow images reconstructed us ECG-, SG-, and PT-based cardiac binning.
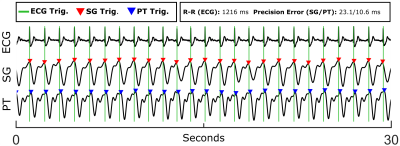
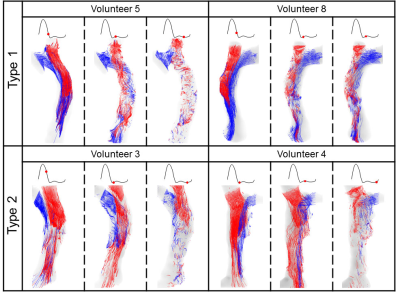
Figure 1. Example
ECG, SG, and PT signal traces with corresponding cardiac triggers from a
healthy volunteer (Volunteer 1). A 30 second window is shown for clarity.
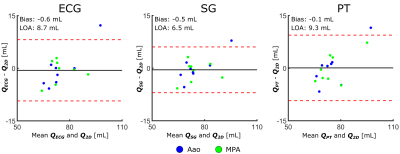
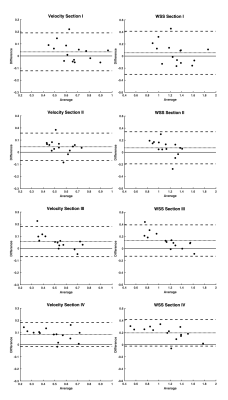
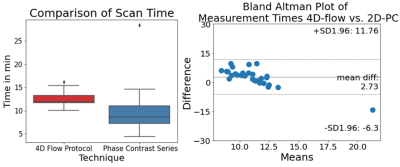
Figure 2. Bland-Altman plots comparing net volumetric flow,
Q, quantified from the ECG-, SG-, and PT-binned 4D flow reconstructions with
respect to the 2D-PC reference. Biases and limits-of-agreement (LOAs) were
computed from the aggregate of Aao and MPA measurements. The y-axis is in terms
of milliliters.
-
A small-vessel MRI phantom for quantitative analysis of diffusion-weighted images: a validation study with numerical computation
Hajime Tamura1, Hideki Ota2, Tatsuo Nagasaka3, Ryuichi Mori3, Chihiro Kato1, Kohsuke Gonda1, and Kenichi Funamoto4
1Department of Medical Physics, Tohoku University, Graduate school of medicine, Sendai, Japan, 2Department of Advanced MRI Collaboration Research, Tohoku University, Graduate school of medicine, Sendai, Japan, 3Department of Radiology, Tohoku University hospital, Sendai, Japan, 4Institute of Fluid Science, Tohoku University, Sendai, Japan
We designed a 3-dimensional unicursal channel phantom
to simulate small vessels and obtained diffusion-weighted images with varying
infusion rate of water. Comparison of the signal intensities with theoretical simulation
will help understanding the behavior of IVIM imaging.
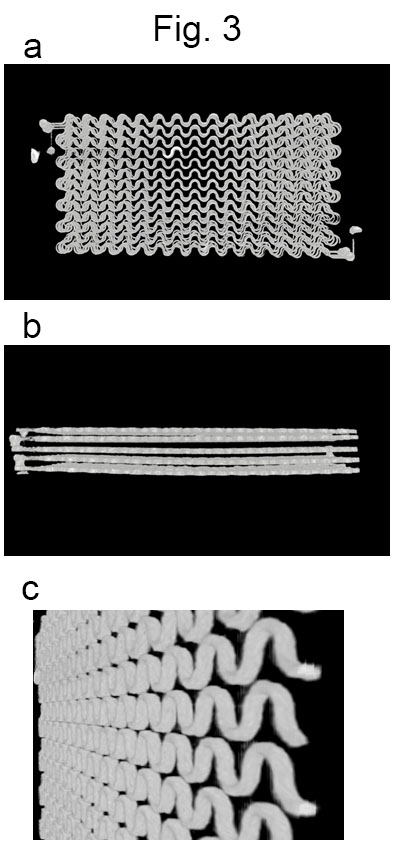
Images obtained
by a micro CT unit (SKYSCAN1176, Bruker)
a. A front view.
b. A side view.
c. A tilted view of one layer.
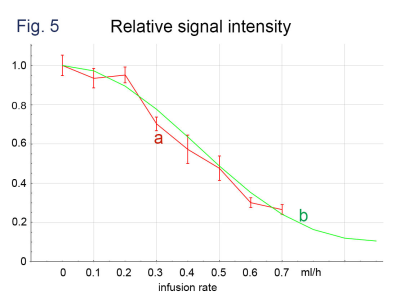
Comparison of (a) signal intensities of phantom
imaging (b = 50 s/mm2, MPG of the phase encoding direction) with (b) those obtained
by computer simulation. The intensities are normalized
to those with the infusion rate = 0.
-
Deep 2D Residual Attention U-net for Accelerated 4D Flow MRI of Aortic Valvular Flows
Ruponti Nath1, Sean Callahan1, Marcus Stoddard2, and Amir Amini1
1ECE, University of Louisville, Louisville, KY, United States, 2Department of Medicine, University of Louisville, Louisville, KY, United States
We propose a novel deep learning-based approach for accelerated 4D Flow MRI by reducing artifact in complex image domain from undersampled k-space.
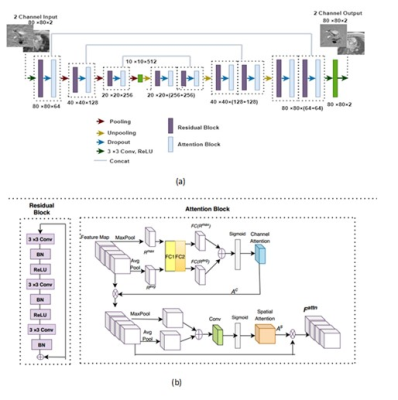
Figure
1: (a) The overall architecture of proposed architecture. Back to back residual block and attention block is adopted as
the backbone of a U-Net. Each residual attention (RA) block is followed by
maxpooling in encoder network and upsampling and concatenation in decoder
network. (b) shows the architecture of a RA block. Each residual block consists
of 3 convolutional layer followed by batch normalization and ReLU. Attention block consists of channel attention
and spatial attention.
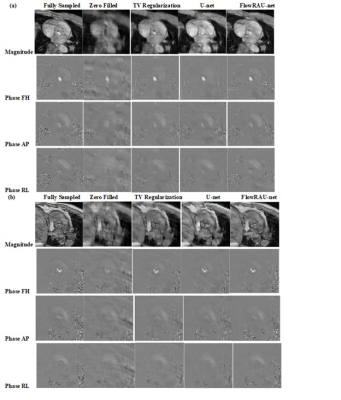
Figure 2: (a) & (b) shows
magnitude image and Phase Image
at FH, AP and RL direction from reference complex image, undersampled
complex image, image reconstructed
by U-net, TV regularization and image
reconstructed by proposed method for two subjects. The image is in the peak systole phase of the
cardiac cycle and is exactly at the location of the aortic valve for both
subjects.
-
Patient-Specific, In-Vitro Modeling of Aortic Coarctation Using 4D Flow MRI and Particle Image Velocimetry
James Rice1, Labib Shahid1, Haben Berhane2, Joshua Robinson3, Lindsay Griffin3, Cynthia Rigsby3, Michael Markl2, and Alejandro Roldan-Alzate1
1University of Wisconsin-Madison, Madison, WI, United States, 2Northwestern University, Evanston, IL, United States, 3Lurie Children's Hospital, Chicago, IL, United States
In-vitro modeling of COA using 4D flow MRI simulated hemodynamics and improved blood flow visualization of complex flow features. PIV results trended towards those from 4D flow MRI at the center of the aorta, suggesting its use as a method for 4D flow MRI validation of COA hemodynamics.
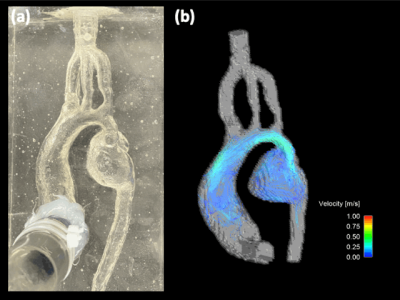
Figure 2: (a) Pre- COA intervention in-vitro silicone model used for flow 4D flow MRI and PIV experiments. (b) Hemodynamic velocity maps obtained by 4D flow MRI with an average inflow rate of 2.6 LPM. Enhanced visualization of complex flow features in the mycotic aneurysm are observed.
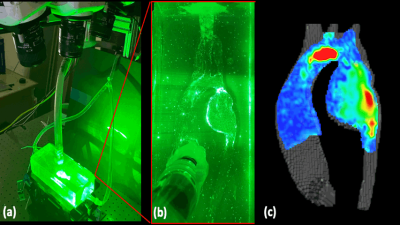
Figure 4: (a) Tomographic (3 camera) PIV setup. A laser is pulsed through a plane cutting a cross section of the model and synced with the acquisition of the high-speed camera. (b) Visualization of particle traces seeded in the aortic flow, illuminated by the laser. The high-speed cameras track the displacement of the particles over the cardiac cycle which are used for velocity quantification. (c) Preliminary velocity map at a cut-plane at the center of the aortic model at peak systole. The high velocity jet extends from the aortic arch to the aneurysmal portion of the descending aorta.
-
Personalized 3D-printed compliant aortic valve phantom enhances the use of full velocity profile for trans-valvular pressure drop estimation
Joao Filipe Fernandes1, Harminder Gill1, Julio Sotelo2,3,4, Shu Wang1, Alessandro Faraci1, Cristian Montalba5, Jesus Urbina6, Ronak Rajani1, David A. Nordsletten1,7, Kawal Rhode1, Sergio Uribe6,8,9, and Pablo Lamata1
1School of Biomedical Engineering and Imaging Sciences, King’s College, London, United Kingdom, 2School of Biomedical Engineering, Universidad de Valparaiso, Valparaiso, Chile, 3Biomedical Imaging Center, Pontificia Universidad Católica de Chile, Santiago, Chile, 4Millennium Nucleus for Cardiovascular Magnetic Resonance, ANID - Millennium Science Initiative Program, Santiago, Chile, 5Biomedical Imaging Center, Pontificia Universidad Cat�olica de Chile, Santiago, Chile, 6Radiology Department, School of Medicine, Pontificia Universidad Catolica de Chile, Santiago, Chile, 7Departments Biomedical Engineering and Cardiac Surgery University of Michigan, Ann Arbor, MI, United States, 8Biomedical Imaging Center, Pontificia Universidad Catolica de Chile, Santiago, Chile, 9Millennium Nucleus for Cardiovascular Magnetic Resonance, Santiago, Chile
The study provides a 4D-flow-MRI in-vitro way to assess tailored compliant 3D-printed aortic valves.The results offer further proof that no-invasive pressure drop (∆P) based on full velocity profileovercomes the maximal velocity ∆P used clinically.
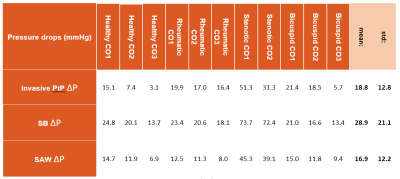
Experiments results of transvalvular
pressure drop (ΔP) measured invasively via peak-to-peak and
non-invasively via simplified advective work-energy relative pressure
(SAW) and simplified Bernoulli (SB). CO1, CO2 and CO3 represent
respectively the pulsatile with a maximal flow rate of 150ml/s, 200ml/s
and 250ml/s.
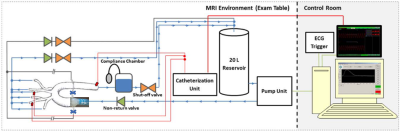
Phantom set-up representation, with the illustration where the valves were implemented.
-
Comparison of turbulent flow based on 4D flow encoding versus icosahedral flow encoding using compressed sensing
Kyoung-Jin Park1,2, Ho-Jin Ha3, Kang-Hyun Ryu4, Yang-Dong Hyun2, and Dong-Hyun Kim1
1Electrical & Electronic Engineering, Yonsei University, SEOUL, Korea, Republic of, 2Radiology (Cardiovascular Imaging), University of Ulsan College of Medicine, Asan Medical Center, SEOUL, Korea, Republic of, 3Mechanical and Biomedical Engineering, Kangwon University, Chooncheon, Kangwon-do, Korea, Republic of, 4Radiology, Stanford University, Stanford, CA, United States
Using CS technique, we investigated the correlation between velocity error and turbulent flow, TKE estimation error for two motion encoding schemes (i.e., conventional 4D Flow vs ICOSA6).
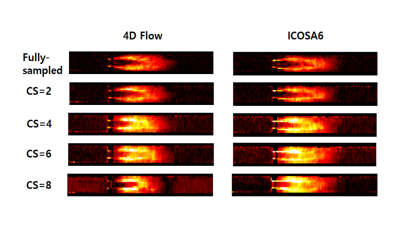
TKE mapping in 4D Flow & ICOSA6 with CS reconstruction.
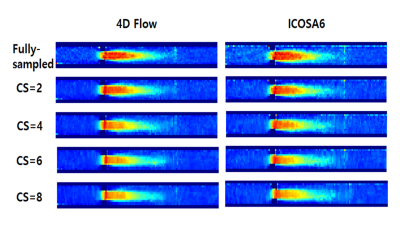
Velocity mapping in 4D Flow & ICOSA6 with CS reconstruction.
-
Simulation of Flowing Spins in MRI using the Lattice Boltzmann Method
Ansgar Adler1, Jost M. Kollmeier2, Nick Scholand1, Sebastian Rosenzweig1, Yong Wang3, and Martin Uecker1,4
1Institute for Diagnostic and Interventional Radiology, (UMG) University Medical Center Göttingen, Göttingen, Germany, 2Biomedical NMR, Max Planck Institute for Biophysical Chemistry, Göttingen, Germany, 3Max Planck Institute for Dynamics and Self-Organization, Göttingen, Germany, 4DZHK (German Centre for Cardiovascular Research), Göttingen, Germany
The lattice Boltzmann method (LBM) is a versatile numerical technique for simulating complex fluid dynamical systems and beyond. Here, we describe an extension of the LBM to flow systems in external magnetic fields. The model is verified numerically and by a simple flow experiment.
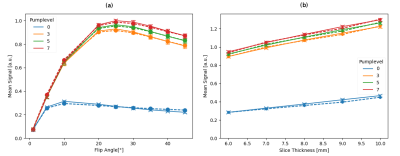
Figure 3: The mean signal values from the center region are shown in dependency of flip angle (a) and slice thickness (b) for different pump levels for numerical simulation (dashed) and experiment (solid). The error bar shows the standard deviation. The left figure is for a slice thickness of 6 mm and the right is for a flip angle of 20°.
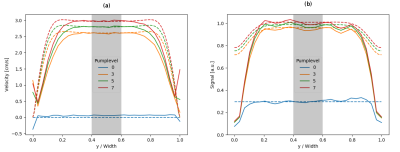
Figure 2: The numerical (dashed) and experimental (solid) velocity (a) and signal (b) profiles for different pump-levels are plotted for the intersecting line inside the pipe. The region in the center is used in further comparisons (gray).
-
High resolution of 4D flow MRI with joint 4D flow simulation to optimize magnetic resonance navigation of microrobots at the bifurcation.
Cyril Tous1, Ivan Dimov1, Ning Li1, Simon Lessard1, and Gilles Soulez1
1Radiology, Centre de recherche du Centre hospitalier de l’Université de Montréal, Montreal, QC, Canada
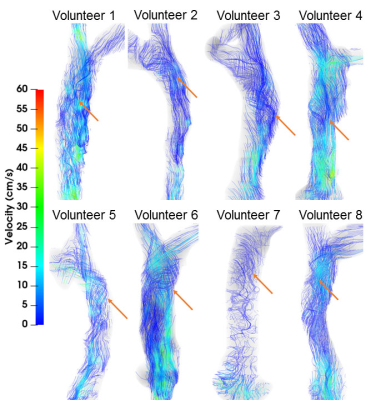
Fluid flow in 4mm diameter phantoms can be quantitatively and qualitatively evaluated with 4D flow MRI. 4D flow reveals eddies at the bifurcation that stop microrobots from proceeding downstream.
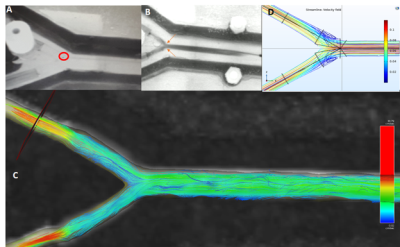
Figure 3) A microrobot (A, red circle) in the 60 degree bifurcation PVA phantom stuck in an eddie visualized using ink (B, orange arrows) and 4D flow (C) (0.4x0.4mm2 in plane resolution). The eddies were simulated with streamlines (D).
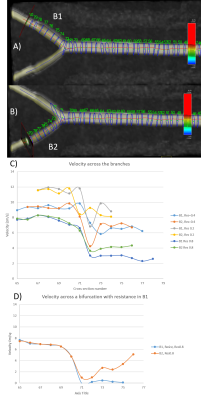
Figure 4) Measurement of the flow velocity according to the resolution of acquisition and the cross section without and with resistance in the branch (B1, left).
-
Quantitative 4D flow vessel estimation using conventional (aorta 4D flow) and whole heart 4D flow sequence.
Himanshu Singh1, S Senthil Kumaran1, and Ganesan Karthikeyan2
1Department of NMR, All India Institute of Medical Sciences, New Delhi, India, 2Department of Cardiology, All India Institute of Medical Sciences, New Delhi, India
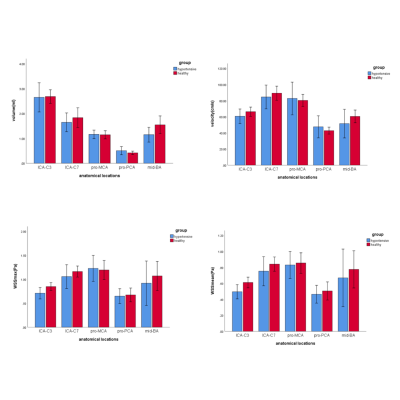
Estimation of large
vessel alongside ventricle dynamics can be estimated without several 4D flow acquisition
with appropriate motion compensation techniques.
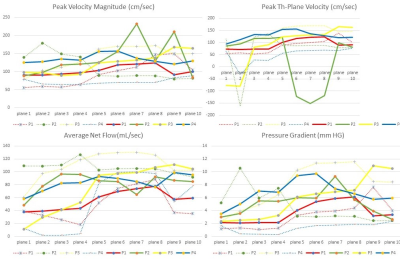
Figure 1. Flow metric estimation
showing quantitative representation between aortic flow sequence (dotted lines)
and Whole heart sequence (hard lines) across different subjects.
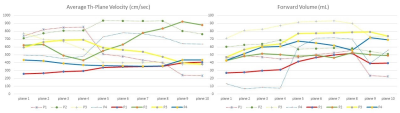
Figure 2. Flow metric estimation of
velocity and volume between aortic flow sequence (dotted lines) and Whole heart
sequence (hard lines) across different subjects.