-
Multi-echo BOLD Index: Figuring out false positive and providing detailed activation patterns in task fMRI
Wenchao Yang1, Burak Akin1, Xiang Gao1, Benedikt Poser2, and Jürgen Hennig1
1Department of Radiology, Medical Physics, Faculty of Medicine, Medical Center - University of Freiburg, Freiburg, Germany, 2Maastricht Brain Imaging Centre, Faculty of Psychology and Neuroscience, Maastricht University, Maastricht, Netherlands
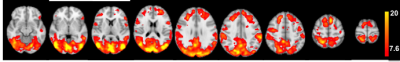
We introduced a BOLD Index to figure out the true BOLD response and false positive/non-BOLD signal in task fMRI. This index also shows detailed
cortex active patterns on gray matter rather than t-test the high value are on CSF or vein in fissure or sulci.
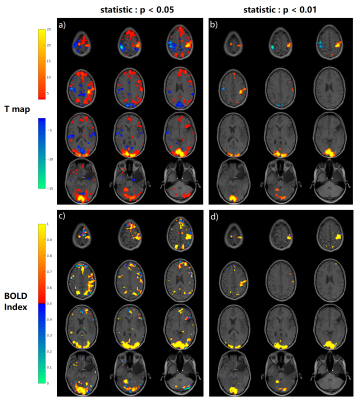
Fig.
4, The T map and BOLD Index mapping under the threshold of p=0.05
and p=0.01. In order to simplify the display, for the BOLD Index, only the
positive activation regions are displayed. The parameter K in BOLD Index equals 1. If
the BOLD Index is bigger than 0.5 which means the voxel is a BOLD signal, and if the BOLD Index is smaller than 0.5 which means the voxel is a non-BOLD signal/false positive. So the blue color in c),d) labels non-BOLD/false positive
regions. There are more blue regions in c) under p<0.05 than in d) under p<0.01.
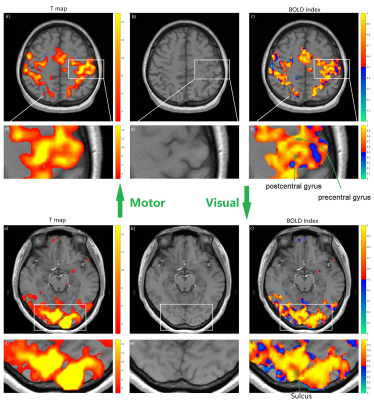
Fig.
5, The T map from standard analysis and BOLD index in smaller voxel size 2*2*3mm3.
The upper part shows the results of the motor cortex and the lower part shows the
results of the visual cortex. a) shows the T map under the threshold of p=0.05; b)
provides the anatomical structure to show where the activation is; c) displays the BOLD index inside the mask from the T map. d), e) and f) are the magnified interest region from a), b) and c) respectively. The parameter K=4 is selected for BOLD Index
to display the detailed activation patterns.
-
A setup for 3 T submillimeter layer-dependent fMRI weighted toward microvasculature
Lasse Knudsen1 and Torben Ellegaard Lund1
1Center of Integrative Neuroscience, Aarhus University, Århus N, Denmark
We present a setup for layer-dependent fMRI, which is feasible at highly available and clinically approved 3T systems, while maintaining sufficient SNR for detection of robust layer-dependent responses. Furthermore, the method seems to have a strong weighting toward microvasculature.
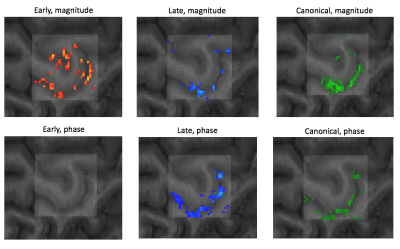
Figure 2: Thresholded statistical maps for each of the early, late and canonical responses, for both the magnitude (upper row) and phase time series (lower row). The shaded square illustrates the hand knob ROI used as an exclusive mask for the TDM and GLM analysis as well as image realignment.
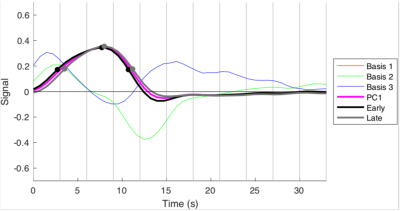
Figure 1: The two waveforms (early and late) extracted from the magnitude images, using the TDM method. The profiles are seen to differ slightly on their rising edge, and at the post stimulus undershoot.
-
Evaluation of spin-echo generalized Slice Dithered Enhanced Resolution (gSLIDER) for high-resolution fMRI at 3T.
Alexander JS Beckett1,2, Salvatore Torrisi1,2, Kawin Setsompop3, David A Feinberg1,2, and An T Vu4,5
1Helen Wills Neuroscience Institute, University of California, Berkeley, CA, United States, 2Advanced MRI Technologies, Sebastopol, CA, United States, 3Radiological Sciences Laboratory, Stanford University, Stanford, CA, United States, 4Radiology, University of California, San Francisco, CA, United States, 5San Francisco Veteran Affairs Health Care System, San Francisco, CA, United States
We demonstrate the use of generalized Slice Dithered Enhanced Resolution (gSLIDER) for high-resolution spin-echo (SE) fMRI. Activations were comparable to standard SE fMRI at varying levels of regularization, demonstrating the suitability of this method for high-resolution fMRI.
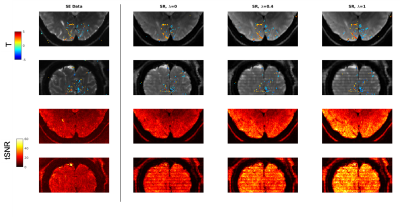
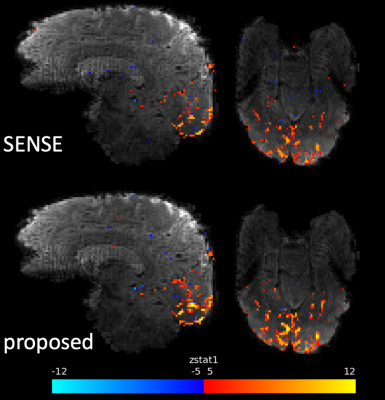
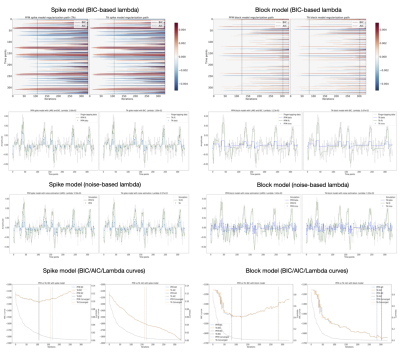
Figure 2 – Activation maps for 1mm Spin Echo (SE) and gSlider Super Resolution (SR) data with different levels of regularization (Lambda).
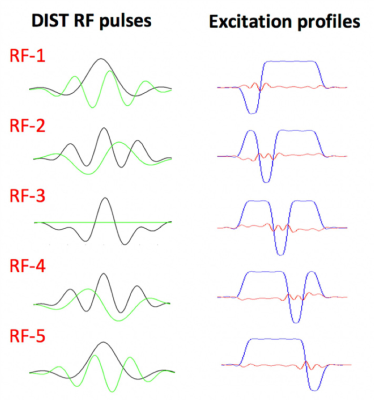
5×-gSlider with ‘slice-phase dither’ encoding to provide highly independent basis, while maintaining high image-SNR in each individual slab acquisition. The DIST RF pulses are shown in the left column, with real and imaginary parts shown in black and green respectively. The corresponding slab profiles are shown in the middle column, each with a π phase dithering applied to a different sub-slice.
-
The influence of undersampling scheme and labeling approach on functional arterial spin labeling with single-shot 3D GRASE readout at 3T
Dimo Ivanov1, Josef Pfeuffer2, Anna Gardumi1, Kâmil Uludağ3, and Benedikt A Poser1
1Faculty of Psychology and Neuroscience, Maastricht University, Maastricht, Netherlands, 2Siemens Healthineers, Erlangen, Germany, 3Techna Institute & Koerner Scientist in MR Imaging, Joint Department of Medical Imaging and Krembil Brain Institute, Toronto, ON, Canada
Arterial spin labeling (ASL) fMRI is valuable, but suffers from low temporal signal-to-noise ratio (tSNR). We compared GRAPPA- and CAIPI-accelerated optimized short-TR single-shot 3D GRASE PASL and PCASL approaches at 3T to compare the effects of tSNR and number of samples on the fMRI results.
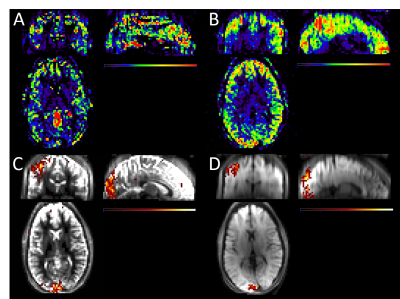
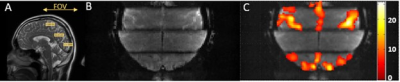
Figure 2: Single-subject perfusion tSNR maps and functional activation maps overlaid on the mean 3D GRASE images for PASL CAIPI (A,C) and PCASL CAIPI (B,D). Note the identical colorbar scaling for A and B and C and D, respectively.
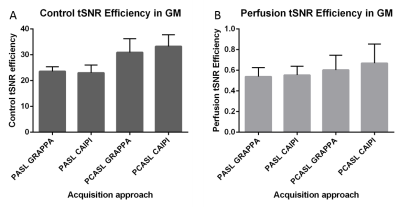
Figure 3: Group mean and standard deviations of the grey matter control tSNR (A) and perfusion tSNR (B) efficiencies across labeling approaches and acceleration schemes.
-
Improving task fMRI reliability at brain regions of high‐susceptibility using a multi-band PSF-mapping-based reverse-gradient approach
Myung-Ho In1, Daehun Kang1, Hang Joon Jo2, Uten Yarach3, Joshua D Trzasko1, Nolan K Meyer1,4, Bardwell Speltz J Lydia 1,4, John Huston III1, Matt A Bernstein1, and Yunhong Shu1
1Department of Radiology, Mayo Clinic, Rochester, MN, United States, 2Department of Physiology, College of Medicine, Hanyang University, Seoul, Korea, Republic of, 3Department of Radiologic Technology, Faculty of Associated Medical Sciences, Chiang Mai University, Chiang Mai, Thailand, 4Mayo Clinic Graduate School of Biomedical Sciences, Mayo Clinic, Rochester, MN, United States
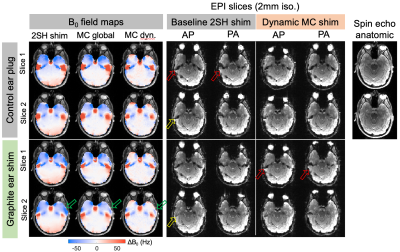
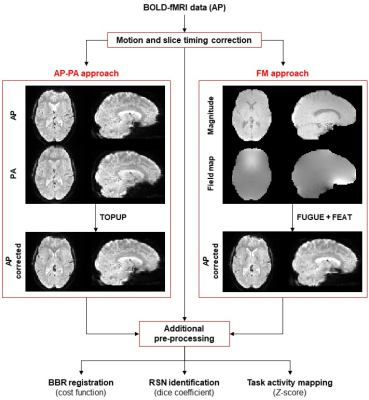
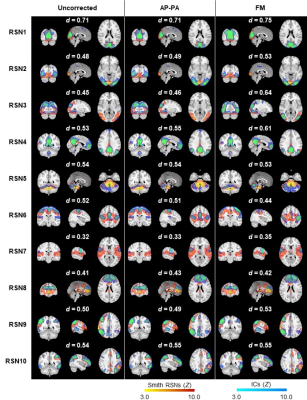
We performed breath-holding, reverse-gradient
fMRI with a PSF mapping-based distortion correction scheme and demonstrated the
effectiveness in improving fMRI reliability for each individual and the entire
group, especially in brain regions of rapid susceptibility change.
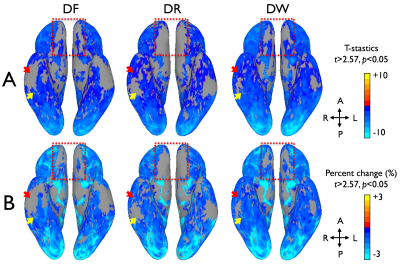
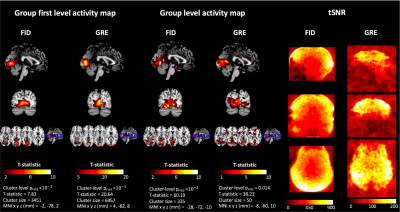
Figure 3. Comparison of group functional contrast maps between the
distortion-corrected forward (DF), the reverse (DR), and the combined EPI images
(DW) on a 3D inflated surface model. Group average maps of GLM T-statistics (A)
and signal percentage changes (B) are present for the comparison.
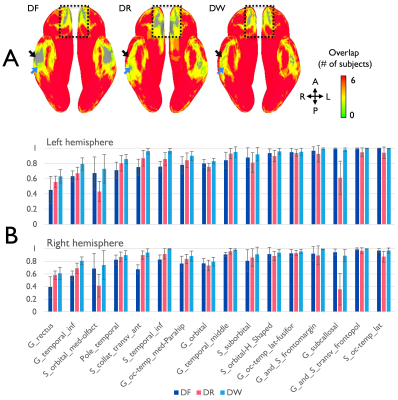
Figure 2. Comparison
of cortical coverage ratio between the distortion-corrected forward (DF), the
reverse (DR), and the combined EPI images (DW). (A) The cortical coverage for
six subjects is visualized on the inferior view of 3D inflated surface model.
(B) The coverage ratios at the local areas of both hemispheres are present as
the mean and standard deviation. The specific locations presenting apparent
coverage ratio differences are indicated by arrows and dashed-rectangular boxes
in (A).
-
Recurrent U-Net Based Temporal Regularization for Dynamic Undersampled Reconstruction in OSSI fMRI
Shouchang Guo1 and Douglas C. Noll2
1Electrical Engineering and Computer Science, University of Michigan, Ann Arbor, MI, United States, 2Biomedical Engineering, University of Michigan, Ann Arbor, MI, United States
The proposed recurrent U-Net with two levels of temporal regularization presents higher quality fMRI reconstruction than other methods.
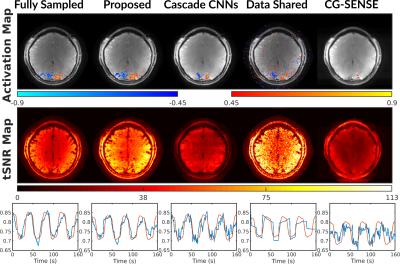
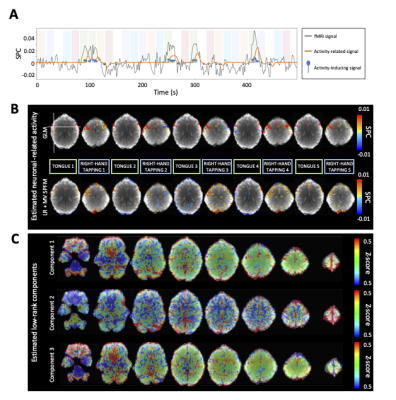
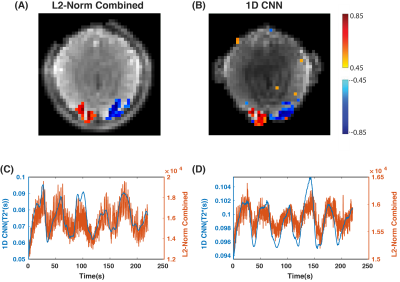
Functional results including activation maps, temporal SNR maps, and time courses. The proposed approach has well preserved functional signals with similar activation map and time course to the fully sampled case.
Because the data shared images were reconstructed by combining k-space of every 10 slow time points, the time-series of data shared images were generated by repeating each data shared image for 10 times along slow time.
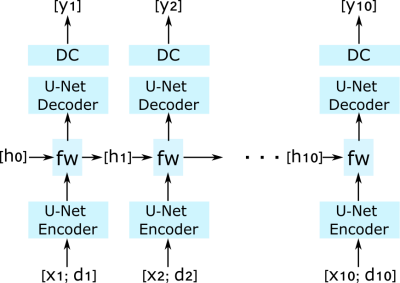
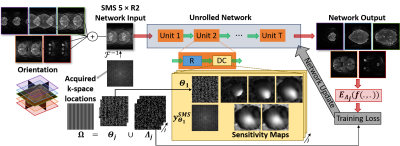
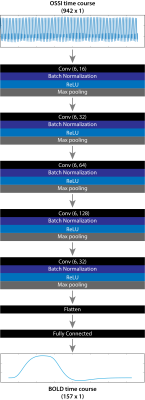
The proposed network that reconstructs nc = 10 fast time images as a sequence. The network combines U-Nets with a recurrent layer. The recurrent layer “fw” is located at the bottleneck of the U-Net, and takes learned representations from the U-Net encoder and hidden states hi (i = 1, 2, ... , nc) from the previous fast time to generate the hidden state for the next fast time frame. xi denotes zero-filled fast time image, di denotes data shared image, and yi denotes two-channel (real and imaginary) output image from the network.
-
Biologically-driven cerebellar neural mass model for improving BOLD signal simulations
Roberta Maria Lorenzi1, Alice Geminiani1, Claudia A.M. Gandini Wheeler-Kingshott1,2,3, Fulvia Palesi1,3, Claudia Casellato1, and Egidio D'Angelo1,3
1Department of Brain and Behavioral Sciences, University of Pavia, Pavia, Italy, 2NMR Research Unit, Queen Square MS Centre, Department of Neuroinflammation, UCL Queen Square Institute of Neurology, Faculty of Brain Sciences, University College London (UCL), London, United Kingdom, 3Brain Connectivity Centre Research Department, IRCCS Mondino Foundation, Pavia, Italy
Cerebellum physiological-grounded mean-field model was defined as a set of equations modelling the output activity of each neural populations. Transfer function fitting pipeline was tested at different spiking-rate input showing populations parameters reliable trend.
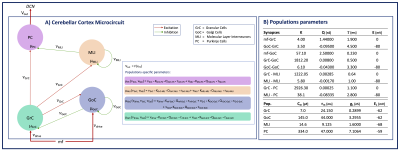
Figure 1) Cerebellar cortex microcircuit model. Populations (p) = GrC, GoC, MLI, PC. Connections (c) = mf-GrC, mf-GoC, GrC-GoC, GoC-GrC, GoC-GoC, GrC-MLI, MLI-MLI, GrC-PC, MLI-PC. The external input 𝜈input[Hz] is relayed by mossy fibers (mf) to GrC and GoC. The output activity 𝜈PC projects to the Deep Cerebellar Nuclei (DCN). Per p or c: mp=conductance; 𝜈p=firing rate[Hz]; Kc=connections probability*cells numbers; Qc = quantal synaptic conductance, 𝜏c=synaptic time decay.
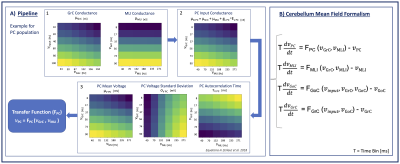
Figure 2) Pipeline to compute the transfer function (F). A): Color-map showing from max(yellow) to min(blue) parameters values used for F fitting. A1) Population conductances assume high values for high excitation combined with low inhibition. A2) PC input conductance depending on connected populations conductances. A3) PC membrane voltage properties: μV follows the same conductances trend. σV is higher for low excitation and high inhibition. 𝜏V is higher for low excitation-high inhibition. B): Cerebellum Mean-Field Model describing activity evolution of each populations
-
Multi-task deep neural network reveals distinct and hierarchical pathways for face perception in visual cortex
HUI ZHANG1,2, XUETONG DING1,2, and JIAQI ZHOU3
1Beijing Advanced Innovation Center for Big Data-Based Precision Medicine(BDBPM), Beihang University, Beijing 100083, China, Beihang University, Beijing, China, 2Key Laboratory of Molecular Imaging, Institute of Automation, Chinese Academy of Sciences, Beijing 100190, China, Beijing, China, 3Department of computer science, Beihang University, Beijing, China
We developed a multi-task deep neural network and used it for investigating facial expression and identity perception in brain. We found distinct and hierarchical pathways for face expression and identity in visual cortex.
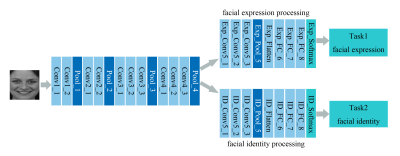
Figure 2. The architecture of the multi-task deep neural network.
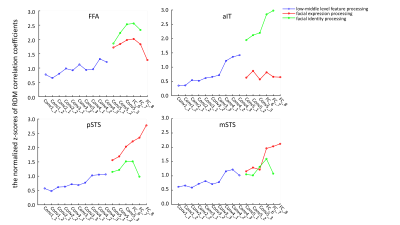
Figure 3. The normalized z-scores for facial expression and identity at each DNN layer.
-
Evaluating data precision and signal gains in functional neuroimaging data after NOise reduction with DIstribution Corrected PCA (NORDIC)
Logan T. Dowdle1, Luca Vizioli2,3, Steen Moeller2, Cheryl Olman4, Geoffrey Ghose1,2,4, Essa Yacoub2, and Kamil Ugurbil1,2,5
1Neurosciences, Center for Magnetic Resonance Research, Minneapolis, MN, United States, 2Radiology, Center for Magnetic Resonance Research, Minneapolis, MN, United States, 3Neurosurgery, University of Minnesota, Minneapolis, MN, United States, 4Psychology, University of Minnesota, Minneapolis, MN, United States, 5Medicine, Center for Magnetic Resonance Research, Minneapolis, MN, United States
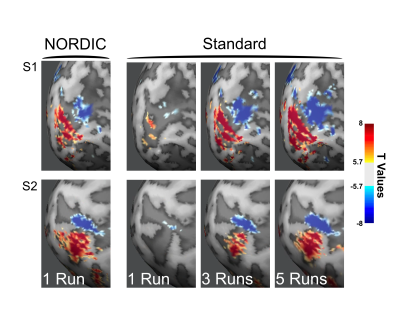
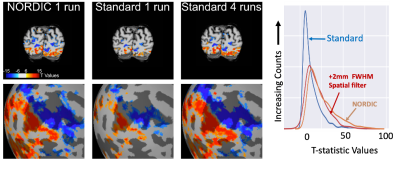
The NORDIC method dramatically increases gradient echo BOLD signal to noise ratio, with negligible smoothing. Improvements are validated by better predictions of held-out data; one run of NORDIC data is equivalent to 2 or 3 runs of conventional data.
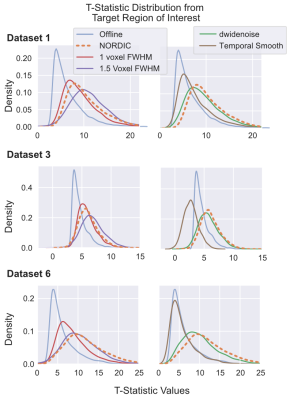
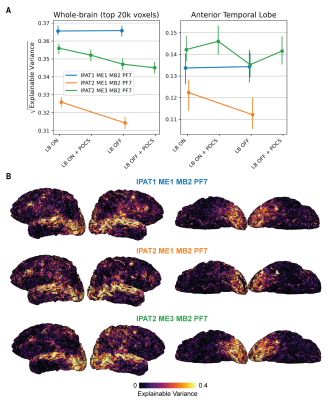
Figure 1. Distributions of T-values. T-values were extracted from the Target ROI (Center > Surround or Faces > Scrambled) derived from Offline data. The t-values obtained with NORDIC (Orange, dashed) processed data is comparable to the effects of an additional 1 or 1.5 voxels FWHM gaussian smoothing. While temporal smoothing did increase T-statistics for Dataset 1, for the fast event-related design (Dataset 3) this led positive and negative t-values, an effect not found in NORDIC data.
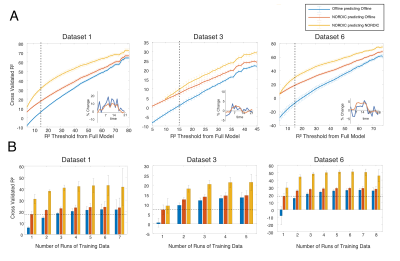
Figure 4. NORDIC leads to higher cross-validation performance. A) Exhaustive cross validation performance when training on using only one run. R2 is shown over voxel inclusion threshold from full model. Examples of single voxel, single run FIR model estimates are shown. B) K-Fold training was repeated with more runs. R2 performance (higher is better) within mask of voxels that explained 15% of variance, for increasing number of training datasets. Error bars are standard error over permutations.
-
Multiscale sample entropy analysis of resting-state and task fMRI
Mary Katherine Gale1, Maysam Nezafati1, and Shella Keilholz1
1Biomedical Engineering, Georgia Institute of Technology, Atlanta, GA, United States
Sample entropy can be used to assess BOLD signal complexity and predictability in resting-state and task fMRI. Task-relevant brain regions tend to display lower entropy than less relevant regions, and there is a strong negative correlation between BOLD signal amplitude and entropy.
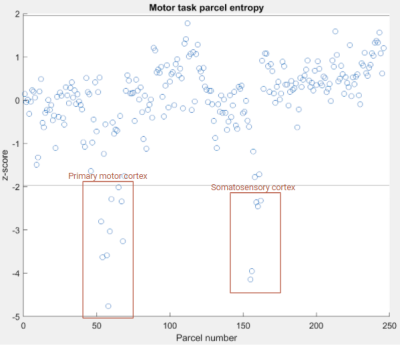
Figure 1: Parcel number vs. entropy z-score for motor task. Task-relevant brain regions are indicated. Note lines at z = +/- 1.96, indicating thresholds for parcels w/ statistical significance.
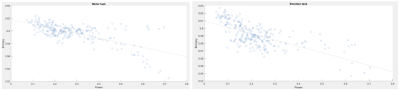
Figure 3: Parcel power vs. entropy for motor (left; r = -0.685) and emotion (right; r = -0.670) scans. Negative correlation held for all task-state scans, with correlation coefficients ranging from r = -0.670 (emotion task) to r = -0.820 (relational processing task).
-
Locally low-rank denoising preserves statistical confidence in task-based functional activation under scan duration reduction
Nolan Meyer1, Norbert G Campeau2, David F Black2, Kirk M Welker2, Erin Gray2, Daehun Kang2, MyungHo In2, John Huston2, Yunhong Shu2, Matt A Bernstein2, and Joshua D Trzasko2
1Mayo Clinic Graduate School of Biomedical Sciences, Rochester, MN, United States, 2Radiology, Mayo Clinic, Rochester, MN, United States
Locally low-rank denoising of complex-valued fMRI data preceding analysis enables preservation of acceptable statistical confidence in localizing verbal activation following truncation of activity blocks from a task functional exam.
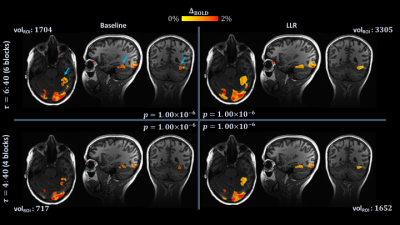
Figure 2.
Single subject (1) maps for six and four task blocks, with $$$p$$$ held
fixed at $$$1\times{10}^{-6}$$$ (full scans: $$$180$$$ degrees of freedom $$$[DOF]$$$, $$$t=5.07$$$; truncated scans: $$$120$$$ $$$DOF$$$,$$$t=5.16$$$). Maps are identically
slice-locked to localize the visual word form area (VWFA; blue arrows, top
left). At top left, full scan, control; top right, full scan, denoised; bottom
left, truncated scan, control; bottom right, truncated scan, denoised. Volumes
of active voxels within an ROI encompassing the VWFA are overlain (volROI).
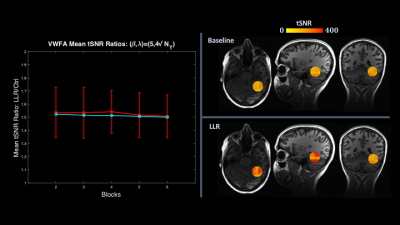
Figure 1. At
left, plot in red of VWFA ROI-specific ratios of LLR to control group mean tSNR with
error bars showing standard deviation, with overlain plot of whole-brain mean tSNR
ratios in cyan. At right, an individual subject (from Figures 2-3) example of
an ROI enveloping the visual word form area used for mean tSNR and
for cluster volume tracking in Figure 2. LLR significantly increases mean tSNR both
in the VWFA ROI and globally.
-
Initial clinical evaluation of locally low-rank denoising on motor areas for task-based presurgical functional MRI
Nolan Meyer1, Norbert G Campeau2, David F Black2, Kirk M Welker2, Erin Gray2, Daehun Kang2, MyungHo In2, John Huston2, Yunhong Shu2, Matt A Bernstein2, and Joshua D Trzasko2
1Mayo Clinic Graduate School of Biomedical Sciences, Rochester, MN, United States, 2Radiology, Mayo Clinic, Rochester, MN, United States
In a preliminary evaluation of task-based motor fMRI data of five healthy subjects, locally low-rank denoising is evaluated for clinical performance. LLR predominantly yields increased thresholds for four specific cluster regions and aggregate maps.
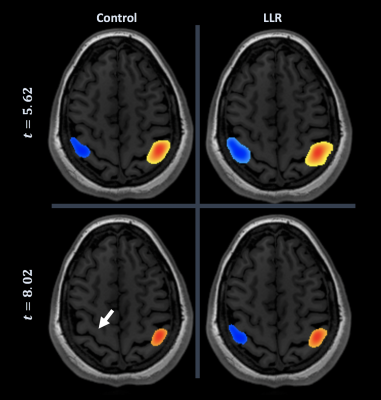
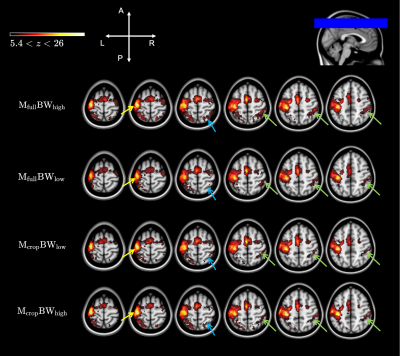
Figure 2. Neuroradiologist consensus threshold of motor cortex for individual subject. At top left, control (conventional) activation map at consensus threshold; bottom right, LLR-denoised map at consensus threshold; bottom left, control at consensus threshold of denoised; top right, denoised at consensus threshold of control. LLR data are thresholded substantially higher with preservation of bilateral motor cortical activation, lost by control data at denoised threshold (white arrow).
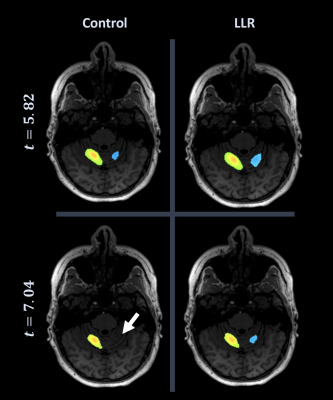
Figure 1. Neuroradiologist consensus threshold of cerebellum for individual subject. At top left, control (conventional) activation map at consensus threshold; bottom right, LLR-denoised map at consensus threshold; bottom left, control at consensus threshold of denoised; top right, denoised at consensus threshold of control. LLR data are thresholded substantially higher with preservation of bilateral cerebellar activation, lost by control data at denoised threshold (white arrow).
-
Linearity of the task-evoked negative BOLD response from the Default mode network regions
Amirreza Sedaghat1, Farnia Feiz2, Sreyansh Biswall2, Sindy Ozoria2, and Qolamreza R Razlighi2
1Biomedical Engineering, Columbia University, New York, NY, United States, 2Radiology, Weill Cornell Medicine, New York, NY, United States
The magnitude of task-evoked negative BOLD response in the Default mode network linearly changes with an increase/decrease in the duration of the task. These findings validate the use of general linear modeling for analyzing task-evoked negative BOLD response.

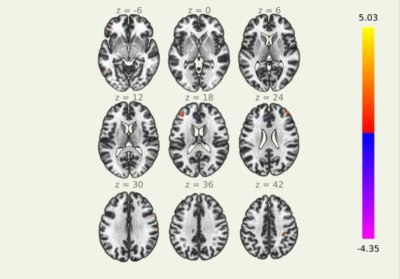
Figure 3. The mean fMRI timeseries from 5 seconds prior and 25 post stimuli period plotted separately for each stimuli duration (0.5 second stimuli in blue, 1 second stimuli in orange, 2 seconds stimuli in green, 3 seconds stimuli in red and 4 seconds stimuli in purple). As expected, the visual cortex shows a perfectly linear response in respect to the length of the stimulus. Similar linearity patterns are shown within DMN regions except with 0.5 and 1 second stimuli.
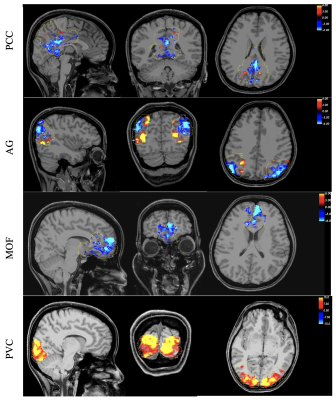
Figure 2, Spatial pattern of the responsive voxels for positive and negative BOLD response in the DMN and primary visual cortex overlaid on three orthogonal and most informative slices.
-
The treatment effects of quitting smoking by varenicline — a fMRI study
Peng Peng1, Chun-lin Li2, Bin Jing2, Qing-lei Shi3, and Tao Jiang1
1Radiology, Beijing Chao-yang Hospital, Beijing, China, 2School of biomedical engineering, Capital medical university, Beijing, China, 3HC NEA DI MR Siemens Healthcare Ltd, Beijing, China
Varenicline can improve the control of desire.It also can
reduce activity of inhibition system,which has inhibitory effect to conscious control system.Ultimately,it improves smokers’ control ability on smoking
addiction and maintain the state of smoking cessation.
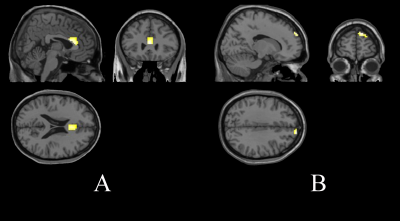
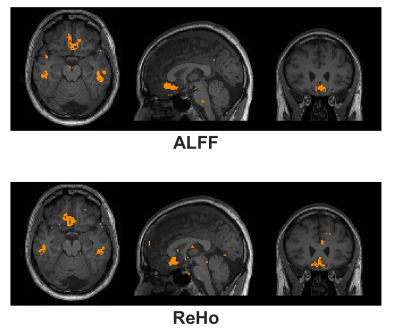
Figure 1. Quitting smokers' brain activation increased areas (fALFF) than that before smoking cessation treatment. A: Brain activation in smokers
increased after cessation treatment when saw smoking images. B: Brain activation in smokers increased after cessation treatment when saw nonsmoking
pictures.
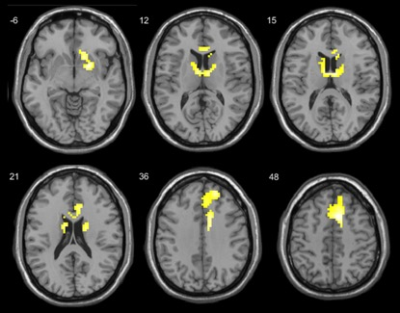
Figure 2. Brain activation areas in smokers when they saw smoking pictures compared with non-smoking pictures before smoking cessation
treatment.
-
Individualized cue-response fMRI study in gaming disorder
Pavel Tikhonov1, Alexander Efimtcev2, Dmitriy Iskhakov2, and Mikhail Zubkov1
1Department of Physics and Engineering, ITMO University, Saint-Petersberg, Russian Federation, 2Department of Radiology, Federal Almazov North‐West Medical Research Center, Saint-Petersberg, Russian Federation
In and fMRI study Gaming Disorder group participants
exhibited altered functional connectivity in networks related to craving,
reward and impulse control.
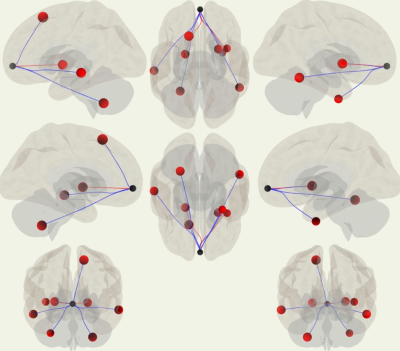
Functional connectivity (ROI-based
analysis, seed ROI – MPFC, 3D view)
Functional connectivity
(ROI-based analysis, seed ROI – MPFC, plain view, axial).
-
Fractal-Based Analysis of Movie Watching vs. Eyes-Open Resting State Reveals Widespread Differences in fMRI Signal Complexity
Olivia Lauren Campbell1, Tamara Vanderwal1, and Alexander Mark Weber1
1University of British Columbia, Vancouver, BC, Canada
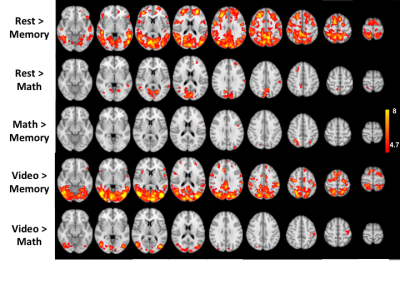
Watching a movie induces greater fractal scaling, or scale-invariance, in the brain than the conventional resting-state condition (eyes fixated on cross-hairs), reflecting a more natural state that is quantifiable and may be a useful subject- and network-specific baseline reference value.
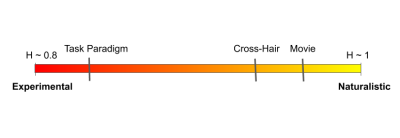
Figure 3: The Experimental-Naturalistic Spectrum. Movie-watching H values reflect a more fractal state than resting-state. Previous findings using conventional experimental tasks that require isolated and discrete cognitive processes (example, Stroop Task) report H values that lie closer to the “high experimental control” end of the spectrum.
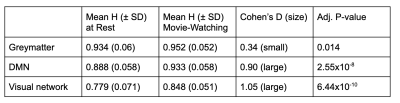
Table 1. Hurst Values in Greymatter, DMN, and Visual Network.
-
Effect of acetylsalicylic acid on BOLD signal in human brain during video stimulation. Functional MRI study.
Maxim Ublinskiy1,2, Andrei Manzhurtsev1,2,3, Alexei Yakovlev1,2,3, Natalia Semenova1,2,3, and Tolibjon Akhadov1,3
1Clinical and Research Institute of Emergency Pediatric Surgery and Trauma, Moscow, Russian Federation, 2Insitute of Biochemical Physics, Russian Academy of Sciences, Moscow, Russian Federation, 3Moscow State University, Moscow, Russian Federation
The
lower content of the enzyme, the precursor of PGH synthetase, may
be the reason for the lesser effect of its inhibition by aspirin in the cortex
as compared to the thalamus.
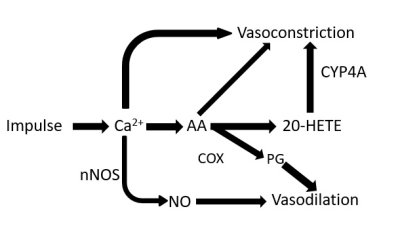
Main pathways of regulation of local blood flow during neuractivation.
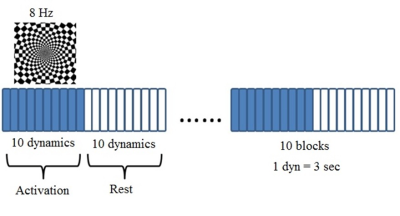
Paradigm design.
-
A progressive calibration gaze interaction interface to enable to naturalistic fMRI experiments
Kun Qian1, Tomoki Arichi1, A David Edwards1, and Jo V Hajnal1
1King's College London, London, United Kingdom
We describe a progressive
calibration gaze interaction interface which provides accurate and robust gaze
estimation despite head movement. It has great potential for use as a next
generation platform for naturalistic fMRI experiments.
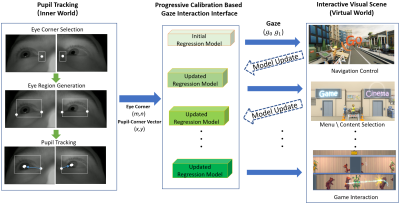
Figure 2. Overview
of the system pipeline. In eye tracking (left column), the initial eye corner
region for tracking is manually selected when the subject is ready to start.
The eye corner and pupil tracking is based on DCF-CSR [3] and adaptive
thresholding [4]. Our gaze interface will build an initial
regression model based on standard 9 points calibration [2]. The gaze
interface will convert gaze into visual content interaction information which
will progressively update gaze regression model.
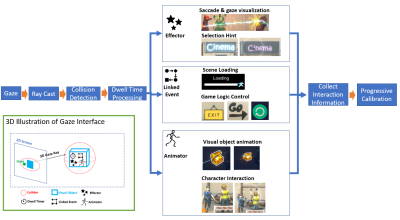
Gaze interaction interface overview. The
interface converts gaze into a 3D ray to test collision with 3D object’s
collider. Subjects see the visual object inside the collider in the 3D world.
Dwell time records how long the ray continuously intersects with the collider.
Linked events trigger associated 3D world events. Effectors and animators trigger
particle effects and corresponding animation of visual objects while the dwell
time increases.
-
An Automatic and Subject-specific Method for Locus Coeruleus Localization and BOLD Activity Extraction
Hengda He1, Linbi Hong1, and Paul Sajda1,2,3,4
1Department of Biomedical Engineering, Columbia University, New York, NY, United States, 2Department of Electrical Engineering, Columbia University, New York, NY, United States, 3Department of Radiology, Columbia University, New York, NY, United States, 4Data Science Institute, Columbia University, New York, NY, United States
We propose a locus coeruleus localization and BOLD activity extraction method, which shows significant correlation with trial-to-trial variability in baseline pupil diameter.
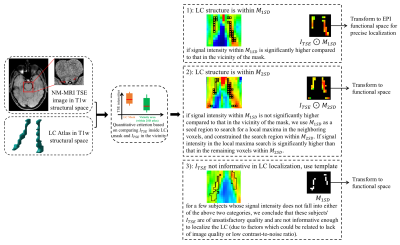
Figure 1. LC localization using a predefined LC atlas and the TSE image of each subject. In T1w structural space, we use a criterion (Student’s t-test) to determine a coarse LC location. Then, either TSE intensities in the LC mask or an LC atlas is transformed to EPI functional space for a more precise localization (using trilinear interpolation). The result is one of three possible outcomes: 1) we localize the LC structure within M1SD; 2) we localize the LC structure within M2SD; 3) we localize the LC structure with the predefined LC atlas (i.e., without using any information from ITSE).
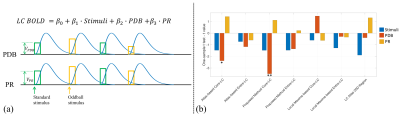
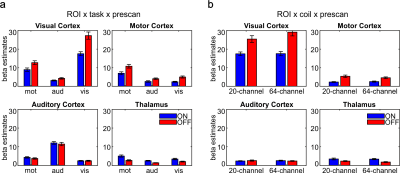
Figure 3. (a) GLM to estimate and test the contributions of PDB and PR to LC BOLD activity (controlling for the variance due to the presence of stimuli). Trial-to-trial variabilities of PDB and PR (VPDB and VPR) were modeled as boxcar functions with the amplitude of each trial modulated by the pupil measurements. The boxcar functions were convolved with a canonical double-gamma hemodynamic response function before fitting into the GLM. (b) Group level statistical analysis in testing regression weights against zero. *p < 0.05; **p < 0.01.
-
The neuro-brain functional mechanisms that cause different efficacy of transcutaneous auricular vagus nerve stimulation on primary insomnia
Xiao Wu1, Yue Zhang2, and Ji-lei Zhang3
1Department of chinese medicine, Sichuan Provincial People's Hospital, University of Electronic Science and Technology of China, Chengdu, China, 2The Second Affiliated Hospital of Guangzhou University of Chinese Medicine, Guangzhou, China, 3Philips Healthcare, Shanghai, China
Our study aimed at comparing the differences of fractional amplitude of low-frequency fluctuation (fALFF) value and heart rate variability (HRV) between “effective group (group A)” and “non-effective group (group B)” during continuous taVNS to analyze the neuro-brain functional mechanisms that caused the different efficacy of taVNS to primary insomnia (PI), so as to provide clinical and theoretical basis for individualized treatment of taVNS. We got these conclusions that the regulation of SMN to HRV during continuous taVNS are may the mechanism that caused the different efficacy of taVNS. The HRV indicators and fALFF value of SMN during the continuous taVNS were might the bio-markers that could predict the efficacy of taVNS on insomnia.
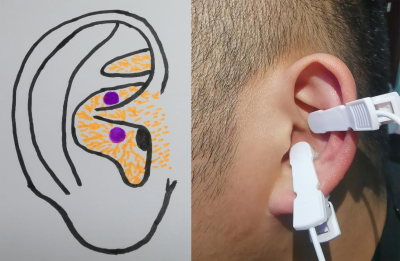
Figure 1. The stimulating location of taVNS on auricular surface.
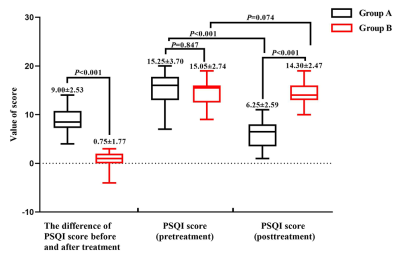
Figure 2: The Pittsburgh Sleep Quality Index(PSQI) score of group A and B before and after treatment.