-
Perfusion And Permeability Imaging as Diagnostic And Prognostic Biomarkers of Cavernous Angioma with Symptomatic Hemorrhage
Je Yeong Sone1, Yan Li1,2, Nicholas Hobson1, Sharbel G. Romanos1, Abhinav Srinath1, Seán B. Lyne1, Abdallah Shkoukani1, Julián Carrión-Penagos1, Agnieszka Stadnik1, Kristina Piedad1, Rhonda Lightle1, Thomas Moore1, Ying Li1, Dehua Bi1,3, Timothy Carroll4, Yuan Ji3, Romuald Girard1, and Issam A. Awad1
1Neurovascular Surgery Program, Section of Neurosurgery, Department of Surgery, University of Chicago Medicine and Biological Sciences, Chicago, IL, United States, 2Bioinformatics Core, Center for Research Informatics, The University of Chicago, Chicago, IL, United States, 3Department of Public Health Sciences, The University of Chicago, Chicago, IL, United States, 4Department of Diagnostic Radiology, University of Chicago Medicine and Biological Sciences, Chicago, IL, United States
Perfusion derivations helped
distinguish CASH 3–12 months prior with 80% sensitivity and 82% specificity.
A combination of permeability and perfusion derivations predicted subsequent CA
bleeding/growth with 77% sensitivity and 72% specificity.
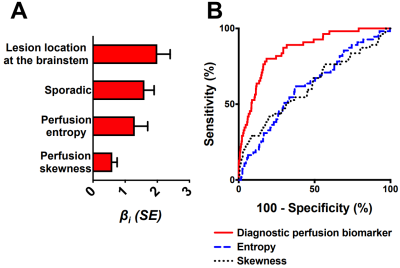
Figure 1. The best diagnostic
biomarker of CASH 3–12 months prior to DCEQP imaging. (A) Weighted βi coefficients of covariates (all p<0.05) in the perfusion biomarker of CASH
3–12 months prior; error bars are SE. (B) The biomarker distinguished
CASH 3–12 months prior (AUC=0.86, p<0.0001) better than entropy (AUC=0.62,
p=0.003) or skewness (AUC=0.62, p=0.003) alone. Abbreviations: area
under the curve (AUC), cavernous angioma with symptomatic hemorrhage (CASH), dynamic
contrast-enhanced quantitative perfusion (DCEQP); standard error (SE).
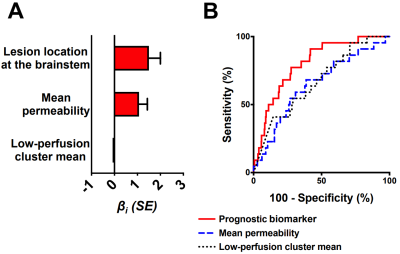
Figure 2. The best prognostic biomarker of bleeding/growth within a year after DCEQP
imaging. (A) Weighted βi
coefficients of covariates (all p<0.05) in the prognostic biomarker; error
bars are SE. One outlier (studentized residual>3) was excluded. (B)
The biomarker (AUC=0.80, p<0.0001) predicted bleeding/growth better than
mean permeability (AUC=0.65, p=0.019) or low-perfusion cluster mean (AUC=0.67,
p=0.007) alone. Abbreviations: area under the curve (AUC), dynamic contrast-enhanced quantitative perfusion
(DCEQP); standard
error (SE).
-
Differences in acute cerebral infarction distribution patterns between young and elderly patients: a MRI study
Dandan Yang1,2, Yongjun Han3, Dongye Li4, Huiyu Qiao2, Hualu Han2, Rui Shen2, Zihan Ning2, and Xihai Zhao2
1Capital Medical University, Beijing, China, 2Tsinghua University, Beijing, China, 3Aerospace Center Hospital, Beijing, China, 4Sun Yat-Sen Memorial Hospital, Guangzhou, China
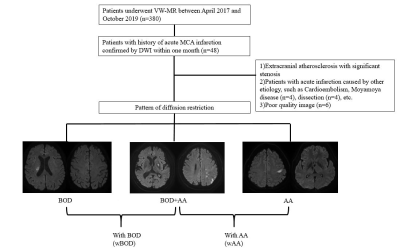
Of the patients with acute cerebral infarction (ACI),
young patients had significantly higher prevalence of multiple ACI lesions in
more than one vascular territory and higher percentage of lesions in both
anterior and posterior circulations than elderly patients.
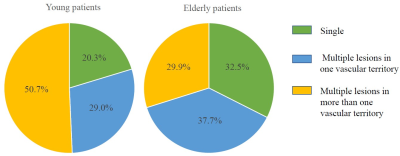
Fig.3.
Comparison of acute cerebral infarction patterns between young and elderly
patients. The left and right pies above showed the percentage of different distribution
patterns of acute cerebral infarction lesions in young and elderly patients, respectively.
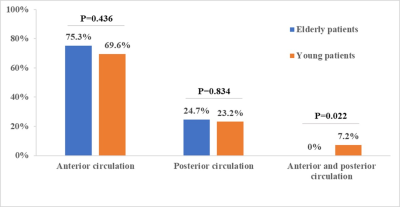
Fig.5. Bar
charts of vascular territory patterns of acute cerebral
infarction lesions between
young and elderly patients. Young patients had significantly higher percentage
of lesions in both anterior and posterior circulations than elderly patients.
-
Computer-Aided Detection of Lacunes from FLAIR and T1-MPRAGE MR Images via 3D Multi-Scale Residual Networks
Mohammed A. Al-masni1, Woo-Ram Kim2, Eung Yeop Kim3, Young Noh4, and Dong-Hyun Kim1
1Department of Electrical and Electronic Engineering, College of Engineering, Yonsei University, Seoul, Korea, Republic of, 2Neuroscience Research Institute, Gachon University, Incheon, Korea, Republic of, 3Department of Radiology, Gachon University College of Medicine, Gachon University, Incheon, Korea, Republic of, 4Department of Neurology, Gachon University College of Medicine, Gachon University, Incheon, Korea, Republic of
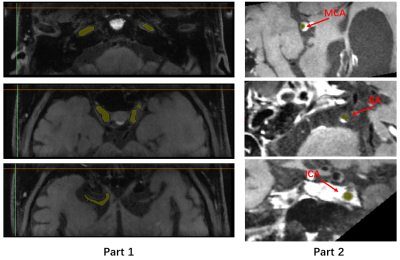
This study proposes a 3D multi-scale ResNet for lacunes detection. The network conducts multiple parallel paths using different input scales from two image modalities. This enables to learn global features of the lacunes’ anatomical location and hence achieve better detection performance.
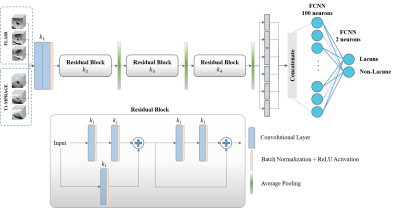
Figure 1. A detailed structure of the proposed 3D
multi-scale ResNet.
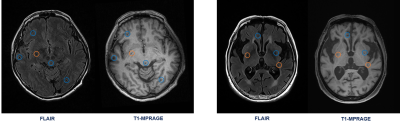
Figure 4. Some exemplar results
of the proposed 3D multi-scale ResNet. The drawn orange and blue circles refer
to the truly detected lacune and non-lacune lesions, respectively.
-
Abnormalities of Cortical Morphology and Structural Covariance Network in Patients With Subacute Basal Ganglia Stroke
Su Yan1, Guiling Zhang1, Weiyin Vivian Liu2, and Wenzhen Zhu1
1Radiology, Tongji Hospital, Tongji Medical College, Huazhong University of Science and Technology, Wuhan, China, 2MR Research, GE Healthcare, Beijing, China
The main findings were that BS could cause cortical
atrophy of bilateral frontal and temporal lobes and abnormal structural
covariance patterns, featured by decreased global efficiency. In addition, the
SCNs of BS also exhibit fragile topological properties in reaction to target
attacks.
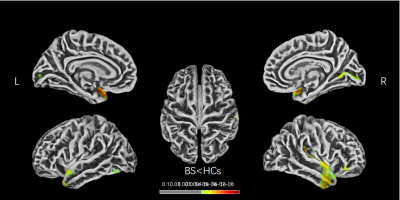
Figure 1 | Brain regions show CT differences
between BS and HCs. The thinner cortices are observed mainly in the
bilateral
frontal and temporal lobes. CT, cortical thickness; BS, basal ganglia stroke;
HCs, healthy controls; L, left; R, right.
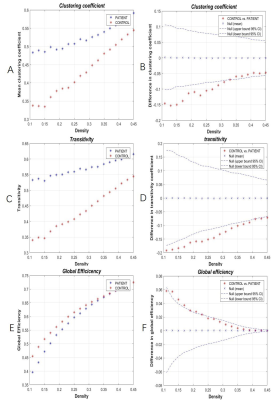
Figure 3 | Within-group global network measures,
and between-group differences of these measures. Clustering coefficient (A,B),Transitivity(C,D)
and Global Efficiency (E,F)of the BS and HC networks. The red star indicates
the difference between the two groups (B,D,F). BS, basal ganglia stroke; HCs,
healthy controls.
-
Relationship between MRI-derived lesion metrics and clinical characteristics in patients with Familial Cerebral Cavernous Malformations
Sivakami Avadiappan1, Jeffrey Nelson2, Marc Mabray3, Blaine Hart3, Leslie Morrison4, Atif Zafar4, Michel Torbey4, Helen Kim2,5, and Janine Lupo1
1Department of Radiology and Biomedical Imaging, University of California San Francisco, San Francisco, CA, United States, 2Department of Anesthesia and Perioperative Care, University of California San Francisco, San Francisco, CA, United States, 3Department of Radiology, University of New Mexico, Albuquerque, NM, United States, 4Department of Neurology, University of New Mexico, Albuquerque, NM, United States, 5Department of Epidemiology and Biostatistics, University of California San Francisco, San Francisco, CA, United States
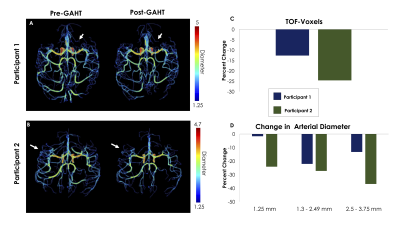
Lesion burden and count of segmented cerebral cavernous malformation lesions were significantly correlated with age and obesity. Lesion burden in the brainstem and temporal lobes were related to hemorrhagic and seizure events.
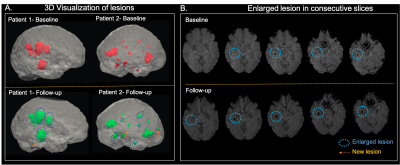
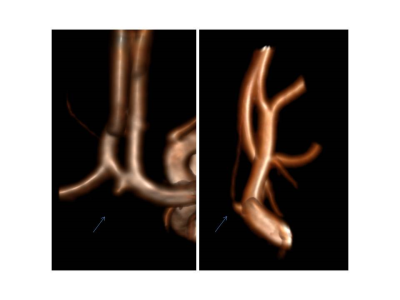
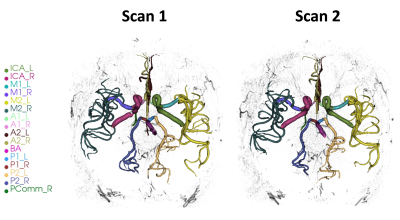
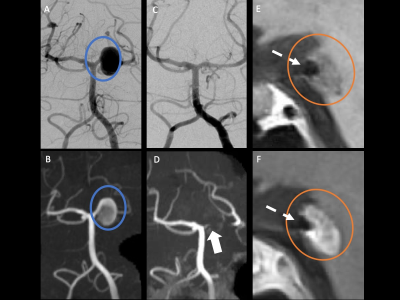
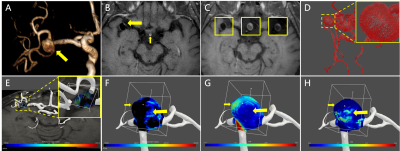
Figure 2. A. 3D visualization of CCM lesions in baseline (pink) and follow-up (green) scans for 2 patients. The lesions that are enlarged in the follow-up scan are highlighted with the blue circle while new lesions are denoted by an arrow. B. The enlargement of the lesion (blue circle) in the follow-up scan compared to the baseline is evident in the consecutive slices from a patient.
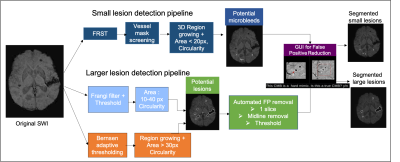
Figure 1. Pipeline for detecting the different sized lesions. (Top) Pipeline for small lesion detection. (Bottom) Pipeline for larger lesion detection. The potential lesion candidates are fed to the GUI where the user labels the lesions.
-
Comparing venous diameter from SWI with ground-truth venous diameter in straight sinus
Mehdi Zoghinia1, Mohammed Ayoub Alaoui Mhamdi1, and Russell Butler1,2
1Bishops university, sherbrooke, QC, Canada, 2Diagnostic Radiology, University of Sherbrooke, sherbrooke, QC, Canada
Comparing venous diameter from SWI with ground-truth venous diameter in straight sinus
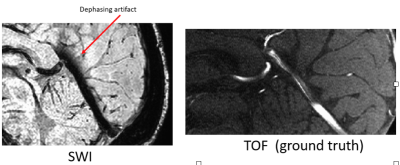
The straight sinus on both SWI and TOF
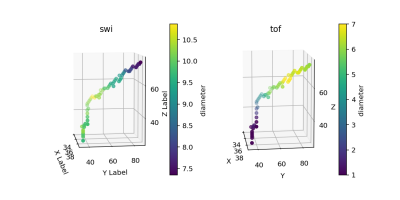
diameters
-
ADC and Size Dependent Segmentation Performance using Deep Learning
Chun-Jung Juan1, Yi-Jui Liu2, Shao-Chieh Lin3, and Yi-Hung Jeng4
1Department of Medical Imaging, China Medical University Hsinchu Hospital, Hsinchu, Taiwan, 2Department of Automatic Control Engineering, Feng Chia University, Taichung, Taiwan, 3Ph.D. program in Electrical and Communication Engineering, Feng Chia University, Taichung, Taiwan, 4Department of Biomedical Engineering and Environmental Sciences, National Tsing Hua University, Hsinchu, Taiwan, Hsinchu, Taiwan
Verifies
the value of ADC threshold on the performance of the deep learning models in segmenting
acute ischemic infarction with increasing the Dice similarity coefficient (DSC).
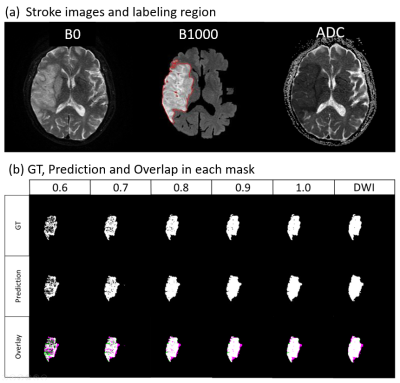
(a)Stroke
images and labeling region; (b) GT, Prediction and Overlap in each
mask.
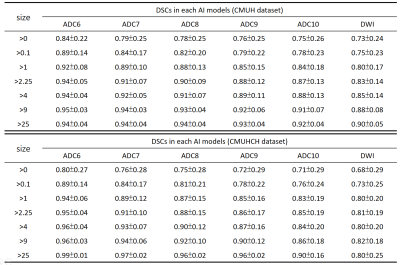
The DSCs between the GT and the prediction in different ADC thresholds
and different stroke sizes.
-
Cortical microinfarcts on 7T MRI correlate with medial temporal lobe thinning in healthy aging
Shokufeh Sadaghiani1, M. Dylan Tisdall2, Sandhitsu R. Das1, David A. Wolk1, and John A. Detre1
1Department of Neurology, University of Pennsylvania Perelman School of Medicine, Philadelphia, PA, United States, 2Department of Radiology, University of Pennsylvania Perelman School of Medicine, Philadelphia, PA, United States
A significant negative correlation was seen between the
number of cortical microinfarcts and mean parahippocampal cortical thickness. We
also showed that only 26% of total CMIs visible on 7T MRI scans are also
visible on 3T scans.
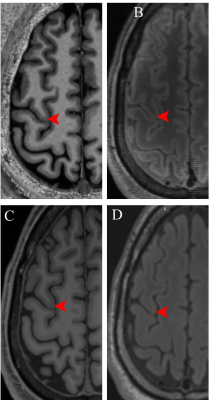
Figure 1. A. A cortical microinfarct visible on 7T
T1-weighted MP2RAGE MRI scan. The CMI is not visible on B. 7T FLAIR MRI scan,
C. 3T T1-weighted MRI scan and D. 3T FLAIR MRI scan.
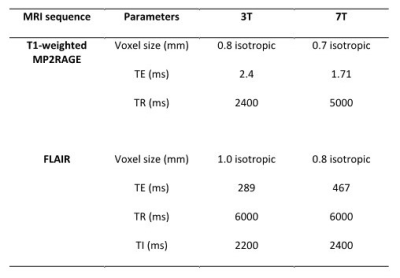
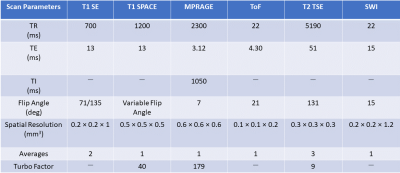
Table 2. 7T and 3T
MRI sequences parameters.
-
3D high resolution CUBE imaging in evaluating the imaging features of intracranial vasculopathy long after cranial irradiation
Huimin Mao1, Weiqiang Dou2, Xinyi Wang1, Xinyu Wang1, Kunjian Chen1, and Yu Guo1
1The First Affiliated Hospital of Shandong First Medical University, Jinan, China, 2GE Healthcare, MR Research China, Beijing, P.R. China, Beijing, China
Intracranial vasculopathy is not a rare
complication after cranial irradiation, even in young patients. Patients after
cranial irradiation should be followed up with MR imaging including HR-MRI.
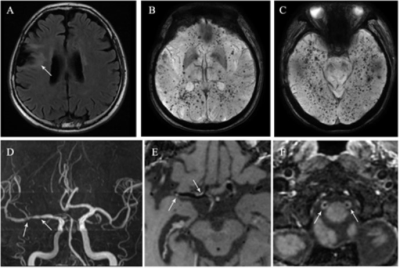
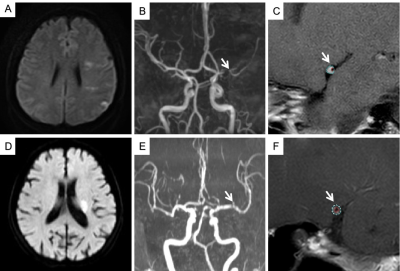
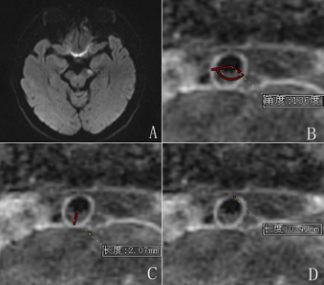
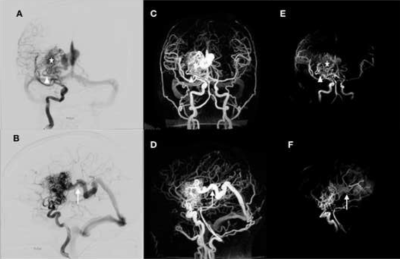
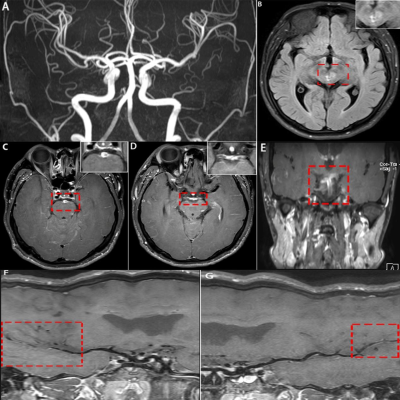
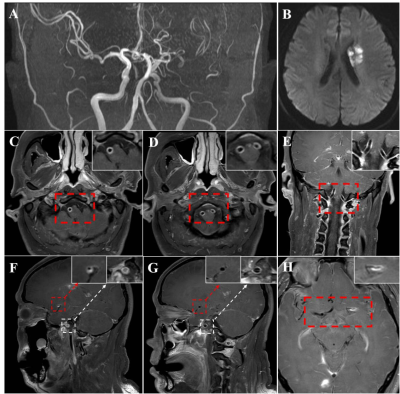
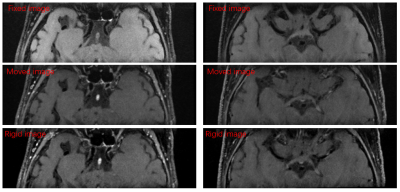
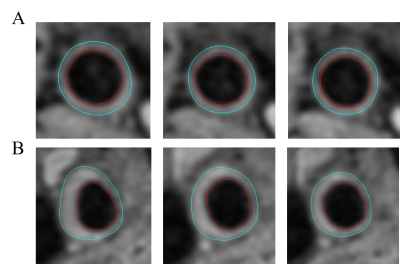
Figure 1. A
45-year-old man who had undergone radiation therapy after surgical resection of
frontal lobe glioma at 26 years old. (A) FLAIR imaging shows peri-lesion white
matter lesions. (B) and (C) SWI shows multiple cerebral microbleeds locating
widespread the brain. (D) MRA shows multiple intracranial arteries stenosis.
(E) Post-contrast 3D T1W HR-MRI shows eccentric plaques with moderate focal
enhancement (E, arrow) in right M1 segment of middle cerebral artery. (F)
Post-contrast 3D T1W HR-MRI shows prominent circle enhancement in bilateral V4
segment of vertebral arteries.
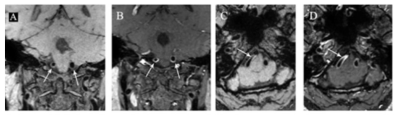
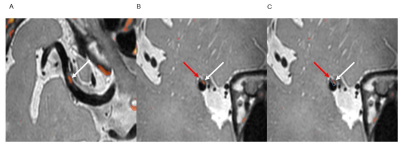
Figure 2. A
47-year-old woman who had undergone radiation therapy for pituitary adenoma at
36 years old. Pre-contrast (A) and post-contrast (B) 3D T1W HR-MRI show
concentric wall thickening (A, arrow) with prominent circle enhancement (B,
arrow) in bilateral V4 segment of vertebral arteries on coronal images.
Pre-contrast (C) and post-contrast (D) 3D T1W HR-MRI show track train
sign-concentric wall thickening (C, arrow) with prominent homogeneous
enhancement (D, arrow) in right V4 segment of vertebral artery on axial images.
-
Neuropathologic correlates of cerebral microbleeds in community-based older adults
Grant Nikseresht1, Ashish A. Tamhane2, Nazanin Makkinejad3, Carles Javierre-Petit3, Gady Agam1, David A. Bennett2, Julie A. Schneider2, and Konstantinos Arfanakis2,3
1Department of Computer Science, Illinois Institute of Technology, Chicago, IL, United States, 2Rush Alzheimer's Disease Center, Rush University Medical Center, Chicago, IL, United States, 3Department of Biomedical Engineering, Illinois Institute of Technology, Chicago, IL, United States
Cerebral microbleeds in community-based older adults are associated with cerebral amyloid angiopathy and arteriolosclerosis. This was true when considering the total number of microbleeds as well as the number of microbleeds in the frontal lobe.
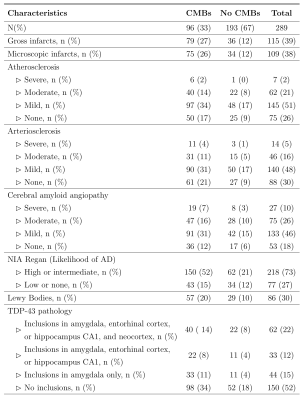
Figure 2. Neuropathologic characteristics.
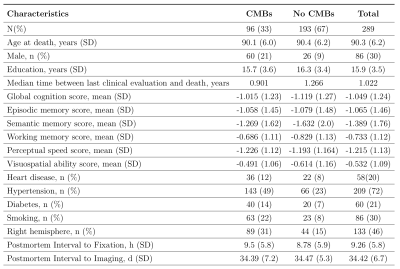
Figure 1. Demographic and clinical characteristics.
-
Personalized MR-derived brain temperature predictions after ischemic stroke – a case study
Dongsuk Sung1, Peter A. Kottke2, Jason W. Allen1,3,4, Benjamin B. Risk5, Fadi Nahab4, Andrei G. Fedorov2,6, and Candace C. Fleischer1,3,6
1Department of Biomedical Engineering, Georgia Institute of Technology and Emory University, Atlanta, GA, United States, 2Woodruff School of Mechanical Engineering, Georgia Institute of Technology, Atlanta, GA, United States, 3Department of Radiology and Imaging Sciences, Emory University School of Medicine, Atlanta, GA, United States, 4Department of Neurology, Emory University School of Medicine, Atlanta, GA, United States, 5Department of Biostatistics and Bioinformatics, Emory University, Atlanta, GA, United States, 6Petit Institute for Bioengineering and Bioscience, Georgia Institute of Technology, Atlanta, GA, United States
A personalized MR-derived brain temperature model was developed using patient data. Simulated brain temperatures after right middle cerebral artery occlusion were highest in the ischemic penumbra followed by infarct core, contralateral healthy tissue, and ipsilateral healthy tissue.
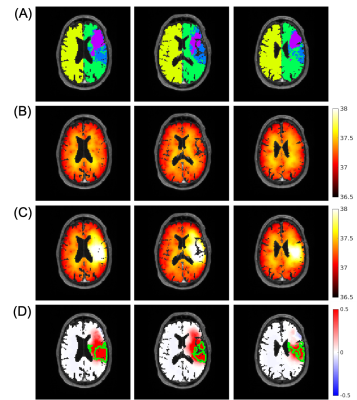
Figure 2. Representative images from a patient with ischemic stroke showing the ability of brain temperature to differentiate regions after ischemic stroke. (A) Tissue regions defined from MR images include infarct core (purple), ischemic penumbra (blue), ipsilateral (green), and contralateral (yellow) healthy tissue; (B) Simulated brain temperature map before occlusion; (C) Simulated brain temperature map after 100% occlusion; (D) Brain temperature difference map (post- minus pre-occlusion). The green boundaries are major continuous regions of ischemic penumbra.
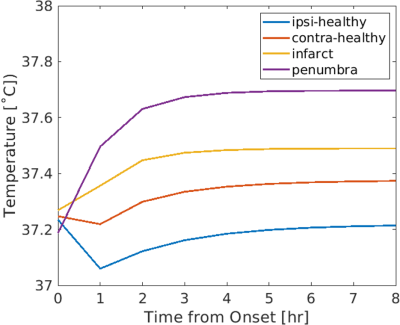
Figure 3. Predicted brain temperature evolution from onset to 8 hours after right middle cerebral artery occlusion in four regions: ipsilateral healthy tissue (ipsi-healthy), contralateral tissue (contra-healthy), infarct core (infarct), and ischemic penumbra (penumbra), where steady state brain temperatures were 37.21 ˚C, 37.37 ˚C, 37.49 ˚C, and 37.70 ˚C, respectively. These in silico results are consistent with previous in vivo studies and suggest that brain temperature may be used as a predictive biomarker to identify hemodynamically distinct regions.
-
Automated Segmentation of Salvageable Ischemic Brain Tissue using Convolutional Neural Networks with DWI and FLAIR MRI
Ryan Andrew Rava1,2, Kenneth V. Snyder2,3, Muhammad Waqas2,3, Elad I. Levy2,3, Jason M. Davies2,3, Adnan H. Siddiqui2,3, and Ciprian N. Ionita1,2,3
1Biomedical Engineering, University at Buffalo, Buffalo, NY, United States, 2Canon Stroke and Vascular Research Center, Buffalo, NY, United States, 3Neurosurgery, University at Buffalo, Buffalo, NY, United States
Two
neural networks were developed to segment penumbra using FLAIR and DWI. Metrics
comparing predictions with ground truth penumbra ((dual network, multi-input
network): Dice=(0.61, 0.61), PPV=(0.59, 0.64)) indicate a multi-input network
is more capable of segmenting penumbra.
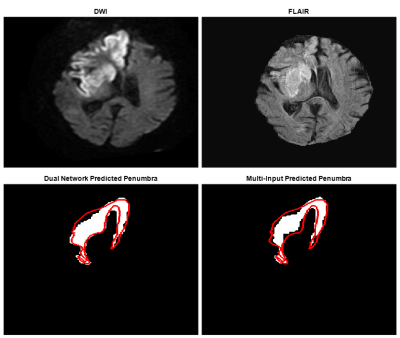
Figure
3: Top images indicate DWI and FLAIR slices fed into each network to segment
the penumbra seen in the bottom images. The dual network prediction indicates
the subtraction of FLAIR segmented infarct from DWI segmented ischemic tissue.
The multi-input prediction indicates predicted penumbra using both DWI and
FLAIR as network input and the red line is an outline of the ground truth
penumbra for this slice. Dual and multi-input Dice coefficients for this slice
are 0.83 and 0.78 respectively.
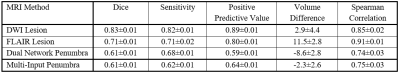
Table
1. Dice Coefficients, sensitivity, positive predictive values, infarct/ischemic
tissue/penumbra volume differences, and Spearman correlation coefficients, with
95% confidence intervals, for each network’s segmentation performance of either
ischemic tissue (DWI), infarct (FLAIR), or penumbra (Dual Network and
Multi-Input).
-
Integrating clinical and imaging features to predict recurrence of cerebrovascular events —— A machine learning study
mengting wei1, jinhao lv2, liuxian wang2, senhao zhang2, dongshan han2, xinrui wang2, and xin lou2
1Chinese PLA General Hospital, BeiJing, China, 2Chinese PLA General Hospital, beijing, China
55 patients were enrolled in this study. After
feature selection, 11 variables were included in the study, and the first three
variables with greater contribution were HCR, mRS on admission and diabetes history. FVH
score and collateral circulation grade had no significant contribution to
recurrent stroke. Then it was divided into model A and model B according to
whether the HCR is included or not. The results show that RandomForest and
NaiveBayes are the optimal algorithms to identify patients with recurrent
cerebrovascular events within one year through machine learning. In addition,
there were significant differences between model A and model B.
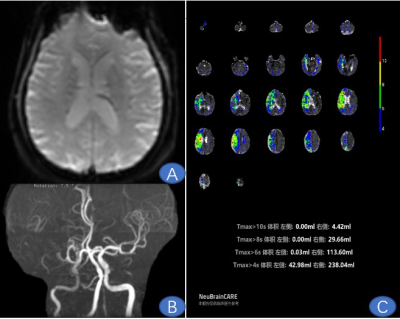
Man,
73 years old, Paroxysmal weakness of both lower limbs for 5 months.
Figure
A ,PWI raw image; Figure B , MRA showed right middle cerebral artery occlusion;
Figure C ,Tmax 4s was 238.04ml, Tmax 6s was
113.60ml, Tmax 8s was 29.66ml, Tmax 10s was 4.42ml ( HCR=47.72% ; HIR = 3.89%).
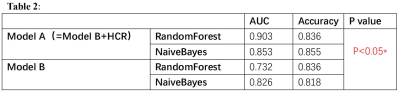
Comparison between
models
-
FLAIR Vascular Hyperintensity May Predict Ischemic Event in Patients with Internal Carotid Artery or Middle Cerebral Artery Occlusion
Jinhao Lyu1, Mengting Wei1, Xiangbing Bian1, Liuxian Wang1, Senhao Zhang1, Lin Ma1, and Xin Lou1
1Radiology, Chinese PLA General Hospital, The First Medical Center, Beijing, China
The presence of Fluid-Attenuated
Inversion Recovery vascular hyperintensity (FVH) is able to discriminate symptomatic
patients from asymptomatic patients in intracranial internal carotid artery or
middle cerebral artery occlusion.
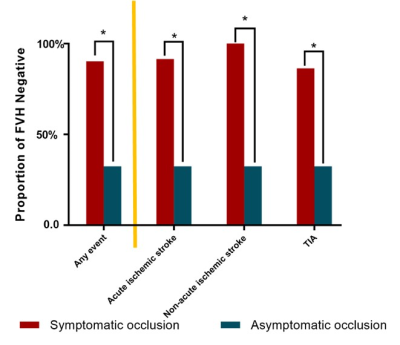
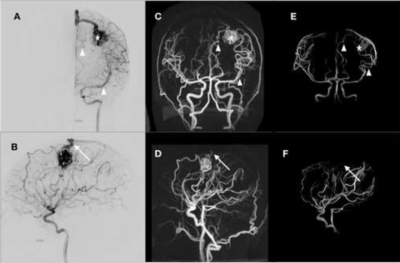
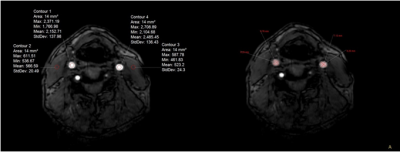
Figure 4 represents subgroup comparisons of the proportion of absence of FVH between symptomatic occlusion and asymptomatic
occlusion. TIA: transit ischemic attack.
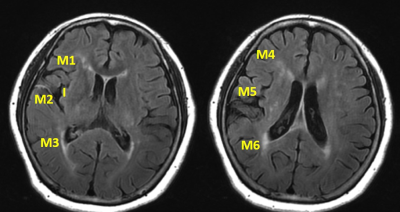
Figure 1 represents insular and M1-M6 regions
for Fluid-Attenuated Inversion Recovery vascular hyperintensity Alberta Stroke
Program Early Computed Tomography Score (FVH-ASPECTS) assessment. The illustrative
case is scored as 3.
-
Optimized Acceleration Factor in Phase Measurement of Brain Deep Veins using SWI with Compressed Sensing
Jing Yang1, Yanwei Miao1, Yangyingqiu Liu 1, Yu Bing1, Bingbing Gao1, Jiazheng Wang2, Zhiwei Shen2, Ailian Liu1, Qingwei Song1, and Renwang Pu1
1First Affiliated Hospital of Dalian Medical University, Dalian, China, 2Philips Healthcare, Dalian, China
The SWI with compressed sensing can reduce the scan time and ensure the image resolution. Meanwhile the optimized acceleration factor and the information of venous oxygen content can be obtained by measuring the phase value in the deep veins.
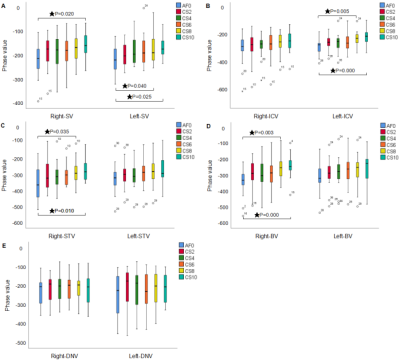
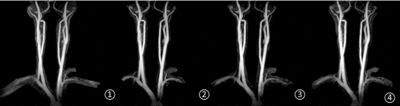
Figure 4. It shows the difference of image quality of each vein with different acceleration factors. SV: septal vein, ICV: internal cerebral vein, STV: superior thalamostriate vein, BV: basal vein, DNV: dentate nucleus vein
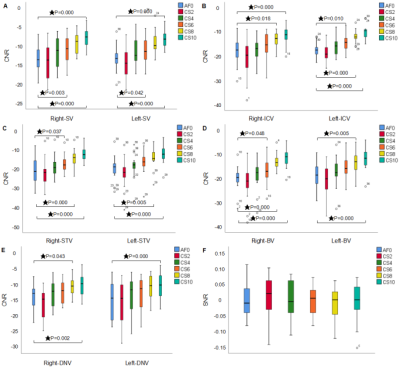
Figure 3. It shows the CNR and SNR of the image with the different acceleration factors. SV: septal vein, ICV: internal cerebral vein, STV: superior thalamostriate vein, BV: basal vein, DNV: dentate nucleus vein
-
Effect of Small Vessel Disease Burden on Collateral Perfusion in Symptomatic Large Vessel Stenosis or Occlusion
Liu-xian Wang1, Dong-shan Han1, Jin-hao Lyu1, and Xin Lou1
1the First Medical Center, Chinese PLA General Hospital, Beijing, China
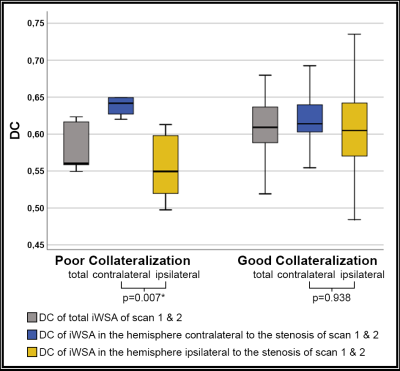
In patients with ICA/MCA severe stenosis/occlusion, those with SVD were older and showed higher incidence of diabetes mellitus. Total SVD burden were not associated with collateral circulation. Perivascular space could affect collaterals.
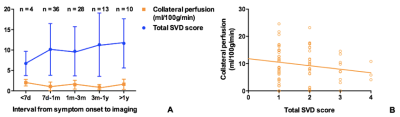
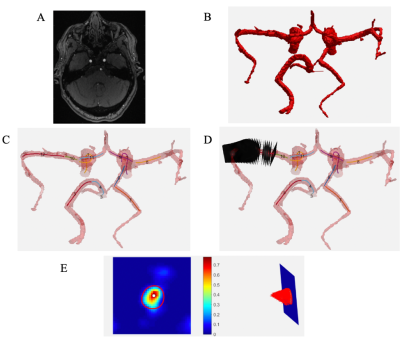
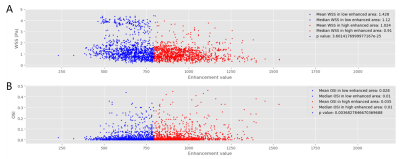
Figure 2. Descriptive figures of the change of collateral perfusion and total SVD score along with the interval from symptom onset to imaging (A). Collateral perfusion decreased with the increase of total SVD score (B). Collateral perfusion was defined as (CBF 2.5s minus CBF 1.5s) at lesion side minus (CBF 2.5s minus CBF 1.5s) at normal side. SVD, small vessel disease.

Figure 3. Cross-sectional correlates of collateral perfusion in symptomatic ICA/MCA severe stenosis or occlusion. ICA, internal carotid artery; MCA, middle cerebral artery; SVD, small vessel disease. a, interval from symptom onset to imaging (days); b, total SVD score. * p < 0.05.
-
Using ASL perfusion images for spatial normalization in a pediatric population with craniosynostosis.
Catherine A. de Planque1, Henk J. Mutsaerts2, Vera C.W. Keil2, Nicole S. Erler1, Marjolein Dremmen1, Irene M.J. Mathijssen1, and Jan Peter3
1Erasmus University Medical Center, Rotterdam, Netherlands, 2Amsterdam UMC, Amsterdam, Netherlands, 3Institute of Radiopharmaceutical Cancer Research, Dresden, Germany
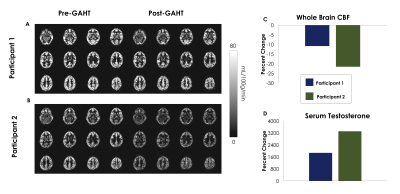
ASL CBF contrast is a viable spatial normalization alternative when structural images are not available or have poor contrast
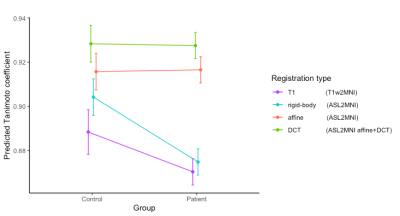
Figure 3. An interaction plot from the least square means of the mixed model to
predict the TC of different registrations types in control vs patients.
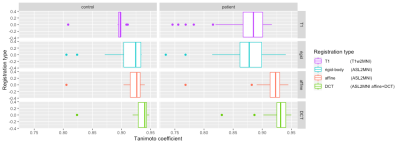
Figure 2. A boxplot of the tanimoto coefficient of
the 4 registration types in patients and controls
-
Can different etiologies provide converging evidence regarding the neural correlates of cognitive performance? Tumor versus stroke
Eva van Grinsven1, Anouk Smits1, Emma van Kessel1, Mathijs Raemaekers1, Edward de Haan2, Irene Huenges Wajer1,3, Veerle Ruijters1, Marielle Philippens4, Joost Verhoeff4, Pierre Robe1, Tom Snijders1, and Martine van Zandvoort1,3
1Department of Neurology & Neurosurgery, University Medical Center Utrecht Brain Center, Utrecht University, Utrecht, Netherlands, 2Department of Psychology, University of Amsterdam, Amsterdam, Netherlands, 3Department of Experimental Psychology and Helmholtz Institute, Utrecht University, Utrecht, Netherlands, 4Department of Radiotherapy, University Medical Center Utrecht, Utrecht, Netherlands
Despite several
differences in the lesion-symptom maps when comparing a tumor and stroke
population, our preliminary conclusion is that these two populations can
provide complementary information regarding involvement of brain regions for
given cognitive tasks.
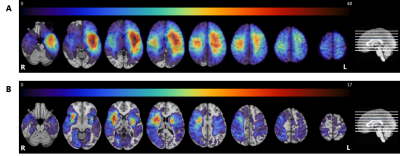
Lesion
prevalence maps for the tumor (panel A) and stroke group (panel B) are shown
superimposed on the MNI brain in radiological view. The colors refer to the
number of patients with a lesion at that voxel, with red indicating a higher
number of patients. The maximum overlap is 48 and 17 for the tumor and stroke
group, respectively. The MNI brain on the right indicates the location of the
slices shown in the figure.
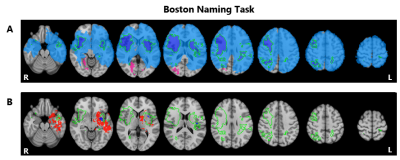
Lesion
symptom results for the Boston Naming Task. Lesion overlap indicating those
regions in which at least 3 patients had a lesion for the tumor group in blue (N=172),
the stroke group in pink (N=103), and overlapping regions shown in the green
outlined purple area (Panel A). Voxels significantly associated with
performance on this task for the tumor group (red) and stroke group (blue) with
the green outline indicating overlapping lesion coverage, as shown in the above
panel (Panel B). Maps are shown on the MNI standard brain in radiological view.
-
FREQUENCY DEPENDENT ALTERED FUNCTIONAL CONNECTIVITY OF DECLARATIVE MEMORY NETWORKS IN PATIENTS WITH DURAL ARTERIO-VENOUS FISTULA
Bejoy Thomas1, Josline Elsa Joseph1, Sabarish S Sekar1, Santhosh Kannath1, and Ramshekhar N Menon2
1Imaging Sciences and Interventional Radiology, Sree Chitra Tirunal Institute for Medical Sciences and Technology, Thiruvananthapuram, India, 2Neurology, Sree Chitra Tirunal Institute for Medical Sciences and Technology, Thiruvananthapuram, India
Dural Arteriovenous fistula (dAVF) causes cognitive deficits and associated memory impairment. Results of this study reveal reduced functional connectivity, in a frequency dependent fashion, among regions involved in declarative memory functional processing.
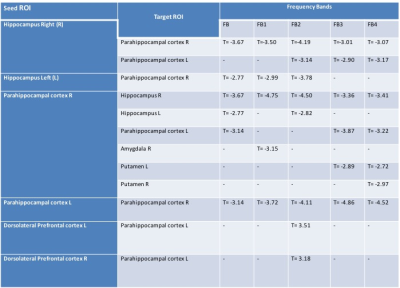
Table 1: rsFC analysis among memory related structures for DP>HC(pFDR<0.01) at different frequency bands.
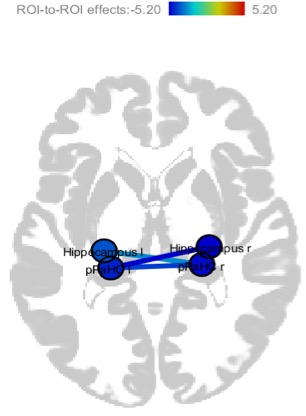
Fig1: Weaker rsFC among medial temporal lobe structures in DP than HC
-
Usefulness of low intensity rim sign on DWI for differentiating brain abscess, acute ischemic stroke, and hemorrhagic stroke.
Takashi Abe1,2, Maki Otomo2, Rintaro Ito1, Rei Nakamichi1, Yumi Abe1, Toshiki Nakane1, Hisashi Kawai1, Toshiaki Taoka1, Shinji Naganawa1, and Masafumi Harada2
1Nagoya University, Nagoya, Japan, 2Tokushima University, Tokushima, Japan
In this retrospective image interpretation study
showed an accuracy of 70% for differentiating brain abscess, acute ischemic,
and hemorrhagic stroke, but by focusing on the low intensity rim, the accuracy increased
to 86% (p = 0.025), confirming the importance of low intensity finding on DWI.
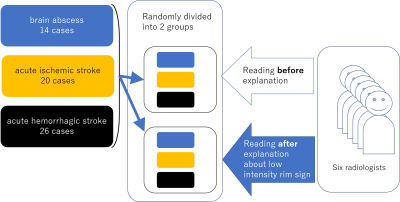
This retrospective study included
14 cases of untreated brain abscess, 20 cases of acute ischemic stroke and 26
cases of acute hemorrhagic stroke. One representative DWI was selected and
randomly divided into two groups. Six radiologists (7 to 20 years of
experience) reviewed one group consists of 30 DW image before any guidance. The
interpretation of another group was carried out after the explanation about the
characteristics of low intensity on DWI.

Data are presented as the; mean (range). Each diagnostic radiologist spent 14.8 min. for the first reading and the accuracy was 70.3%. The reading time after the explanation about the low intensity rim sign was 7.3 min. The accuracy was increased to 85.8 % (p = 0.025).