-
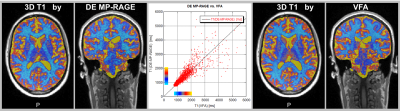
Residual T2 dependent bias of T1 times estimated with the Variable Flip Angle approach at 7T: Evaluation and recommendations.
Nadège Corbin1,2 and Martina F. Callaghan1
1Wellcome Centre for Human Neuroimaging, UCL Queen Square Institute of Neurology, University College London, London, United Kingdom, 2Centre de Résonance Magnétique des Systèmes Biologiques, UMR 5536, CNRS/University Bordeaux, Bordeaux, France
Imperfect spoiling introduces a bias in T1 times estimated with the approach. Here we investigate, in-vivo at 7T, in multiple spoiling conditions, the T2 dependence of the bias. We recommended to use radiofrequency spoiling increment of 117° or 144° with sufficient spoiling gradient (6π).
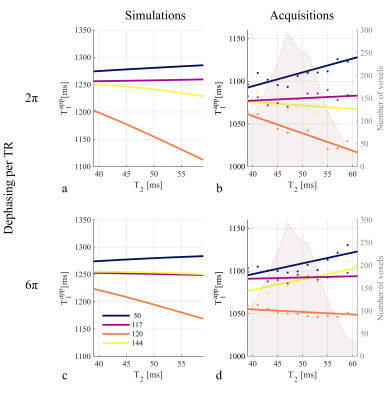
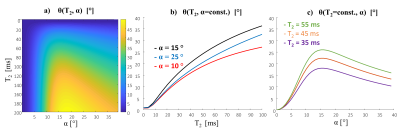
Figure 1: In vivo T1app,
obtained with $$$\phi_0\in$$$[50°,117°,120°,144°], as a function of T2.
Dephasing across a voxel of 2π (a-b) and 6π (c-d) per TR are shown. (a,c)
Numerical simulations. Fixed parameters are: T1=1250ms, D=0.8µm2/ms, fB1+=80% as measured in the transmit field map in the
slice of interest. (b,d) Acquisitions and linear fitting for illustration
purposes. The number of voxels included in each bin is depicted by the shaded
background of each graph.
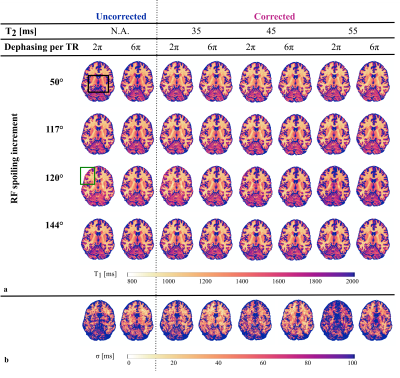
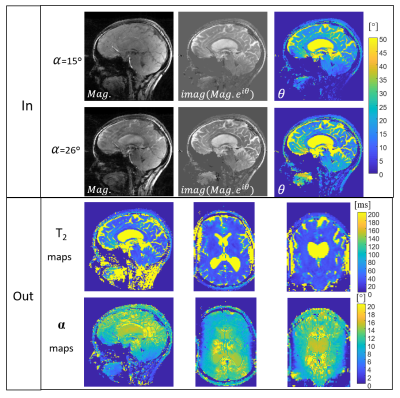
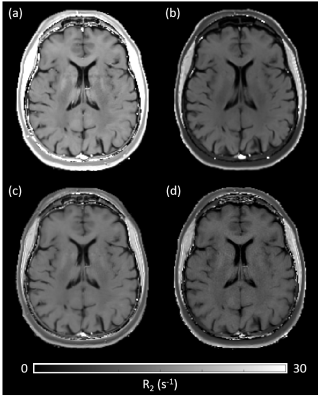
Figure 2: (a) Axial view from T1 maps obtained
with a dephasing per TR of 2π (columns 1, 3, 5 and 7) or 6π (columns 2, 4, 6 and 8) for each φ0 (rows). These are presented before (i.e.
T1app, columns 1 and
2) and after correction for imperfect spoiling with D=0.8µm2/ms and T2 of either 35ms
(columns 3 and 4), 45ms (columns 5 and 6) or 55ms (columns 7 and 8). Black and green boxes highlight
areas particularly affected by changing or applying correction factors (c) Maps of σ,
the voxel-wise standard deviation of T1 across RF spoiling
increments for a given condition (i.e. along columns in (a)).
-
Parallel transmission for variable flip angle T1 mapping at 7T: initial experiences
Kerrin J Pine1, Nicolas Gross-Weege2, Martina F Callaghan3, and Nikolaus Weiskopf1,3,4
1Department of Neurophysics, Max Planck Institute for Human Cognitive and Brain Sciences, Leipzig, Germany, 2Siemens Healthcare GmbH, Erlangen, Germany, 3Wellcome Centre for Human Neuroimaging, UCL Queen Square Institute of Neurology, University College London, London, United Kingdom, 4Felix Bloch Institute for Solid State Physics, Faculty of Physics and Earth Sciences, Leipzig University, Leipzig, Germany
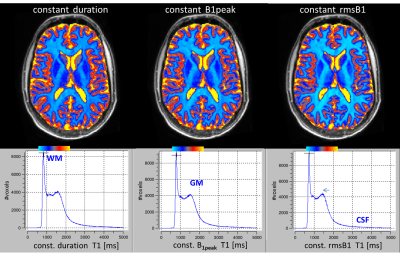
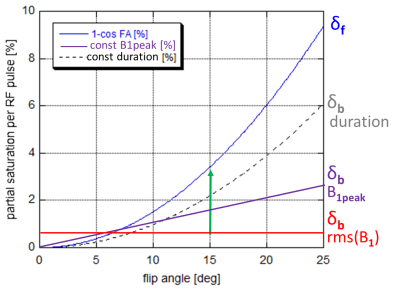
We detail our first experiences using pTx to quantitatively
map T1 via a dual-flip angle approach at
7T. A human volunteer was scanned in both static/CP mode and with kT-points RF
pulses.
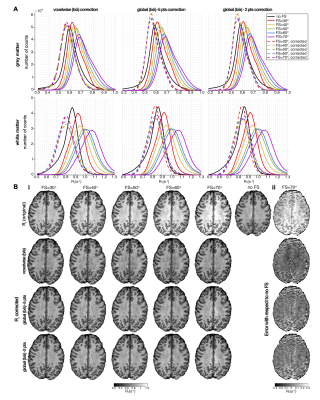
The reduction in inhomogeneity simplifies bias correction.
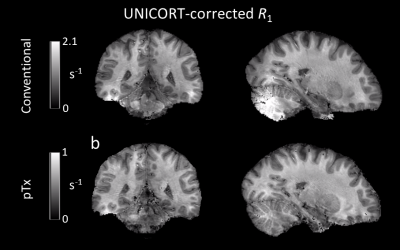
R1
maps corrected with UNICORT with (a) conventional sinc RF pulse in CP mode, and
(b) with k-T points pulse.
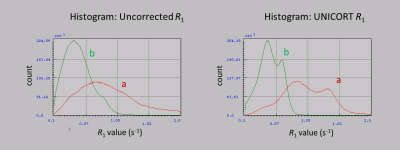
Histograms (brain-masked) of uncorrected and
UNICORT-corrected R1 with (a) conventional sinc RF pulse in CP mode, and (b) with
k-T points pulse.
-
High-resolution T2 maps of the whole brain at 7 Tesla: a proof of concept study using adiabatic T2-prepared FLASH and compressed sensing
Gabriele Bonanno1,2,3, Patrick Leibig4, Tobias Kober5,6,7, and Tom Hilbert5,6,7
1Advanced Clinical Imaging Technology, Siemens Healthcare AG, Bern, Switzerland, 2Translational Imaging Center, sitem-insel AG, Bern, Switzerland, 3Departments of Radiology and Biomedical Research, University of Bern, Bern, Switzerland, 4Siemens Healthcare GmbH, Erlangen, Switzerland, 5Advanced Clinical Imaging Technology, Siemens Healthcare AG, Lausanne, Switzerland, 6Department of Radiology, University Hospital (CHUV) and University of Lausanne (UNIL), Lausanne, Switzerland, 7LTS5, École Polytechnique Fédérale de Lausanne, Lausanne, Switzerland
In this proof of concept, we show the
feasibility of ultra-high resolution T2 mapping at 7T using an accelerated
T2-prepared FLASH sequence and compressed sensing
reconstruction.
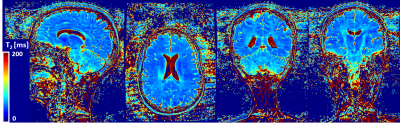
Figure 4
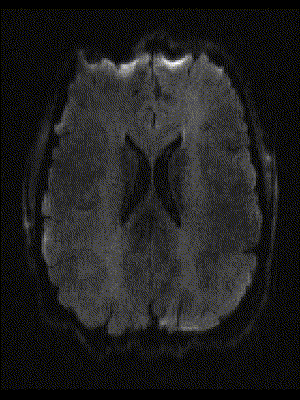
T2
map generated from T2-prepared volumes shown in figure 3. T2 values show good contrast
between gray matter and white matter structures. T2 estimation may be
compromised in the inferior portion of the cerebellum which may be due to B1 inhomogeneity.
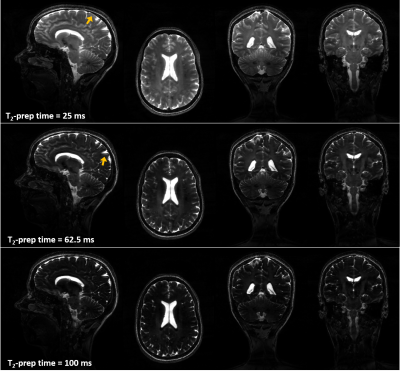
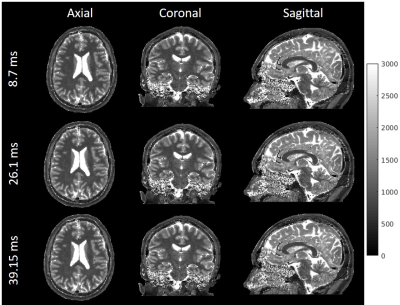
Figure 3
Orthogonal
views of T2-prepared images obtained from a healthy subject show good contrast
and increasing T2 weighting as a function of T2-prep time. Fair signal homogeneity can be observed
till the basal area of the brain with a slight signal drop in the cerebellum. High
level of detail can be observed in the cerebellum and corpus callosum in the
coronal views as benefit from sub-millimetric resolution. Signal-shift artifacts originating
from cerebrospinal fluid (arrows) can be observed and will be investigated.
-
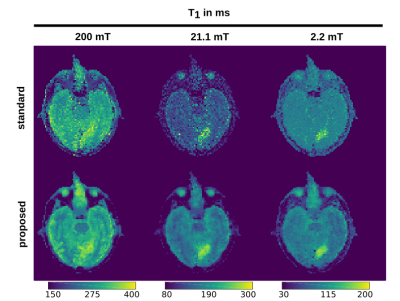
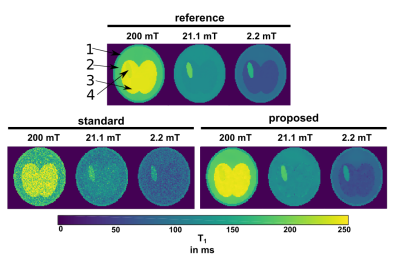
T1 mapping of the ISMRM/NIST system phantom at 7T.
Rosa Sanchez Panchuelo1, Olivier Mougin1, Robert Turner1,2, and Susan Francis1,3
1Sir Peter Mansfield Imaging Centre, UP, University of Nottingham, Nottingham, United Kingdom, 2Max Planck Institute for Human Cognitive and Brain Sciences, Leibzig, Germany, 3NIHR Nottingham Biomedical Research, University of Nottingham, Nottingham, United Kingdom
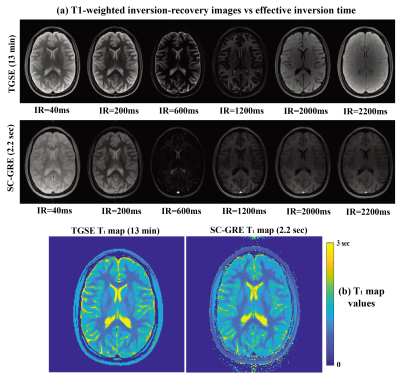
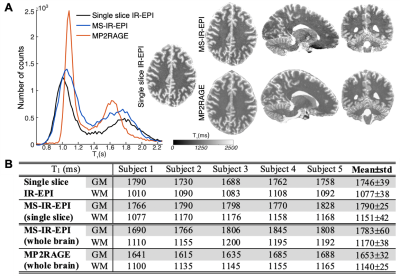
T1 values measured at 7T with MS-IR-EPI are more accurate than those measured with MP2RAGE. The NIST T2-sphere system is better suited than T1-sphere system for T1-mapping at 7T.
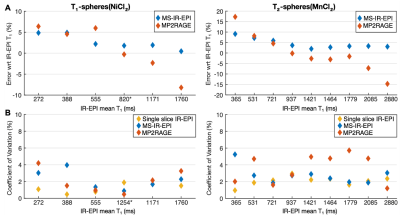
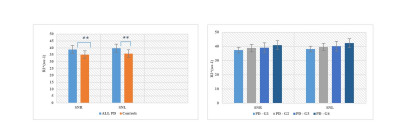
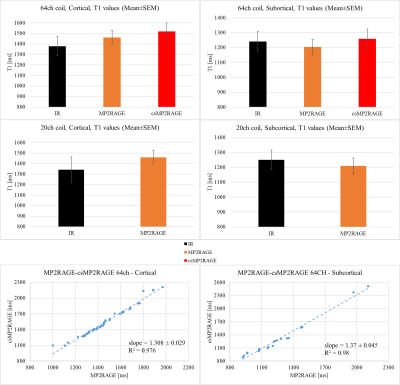
Figure 4: (A) The relative deviation of
MS-IR-EPI and MP2RAGE T1 measurements at 7T with respect to
single slice IR-EPI T1 measurements. T1-value measures averaged across 6
(T1-spheres) and 4 (T2-spheres) measurements. Note that T1 values for the T1_3 sphere are an average across
voxels within a single measurement. (B) Coefficient of variation (CoV) showing the repeatability of T1 measures for methods at 7T. Note that the CoV for T1_3 sphere was computed over the
last 4 measurements.
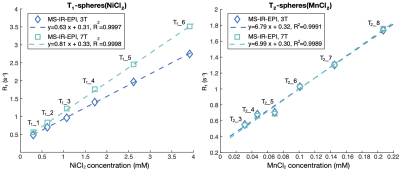
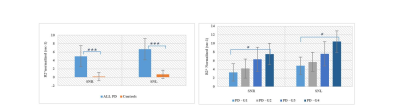
Figure 5: Plots of R1 (s-1) obtained using MS-IR-EPI at 3T and
7T versus the NiCl2 (left) and MnCl2 (right) nominal concentration (mM-1). Dashed lines represent linear
regression fit.
-
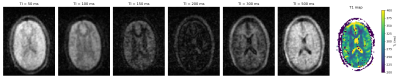
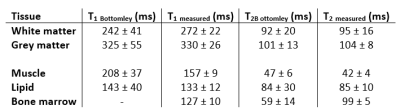
Quantification of transverse relaxation times in vivo at 7T field-strength.
Jochen Schmidt1, Dvir Radunsky2, Patrick Scheibe1, Noam Ben-Eliezer2,3,4, Nikolaus Weiskopf1,5, and Robert Trampel1
1Neurophysics, Max Planck Institute for Human Cognitive and Brain Sciences, Leipzig, Germany, 2Biomedical Engineering, Tel Aviv University, Tel Aviv, Israel, 3Sagol School of Neuroscience, Tel Aviv University, Tel Aviv, Israel, 4Center for Advanced Imaging Innovation and Research (CAI2R), New-York University Langone Medical Center, New York, NY, United States, 5Felix Bloch Institute for Solid State Physics, Faculty of Physics and Earth Sciences, Leipzig University, Leipzig, Germany
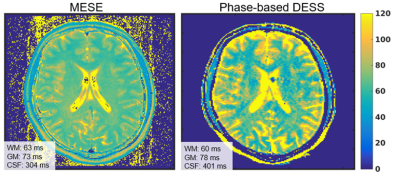
Quantitative T2 maps with sub-millimeter resolution of the human brain were acquired in vivo with a multi-echo spin-echo sequence at 7T in feasible scan time. Proper correction of B1 transmit field bias was achieved by Bloch equation simulations of the spin response to the sequence features.
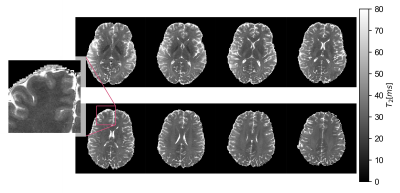
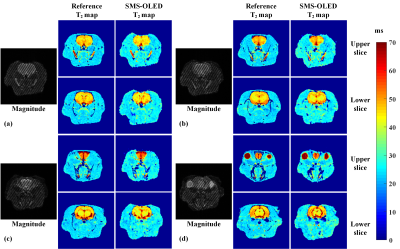
Figure 3: 0.6 mm isotropic resolution image obtained by voxel-wise signal response curve matching. The inset image shows more pronounced cortical detail to appreciate the potential of the method for high-resolution mapping.
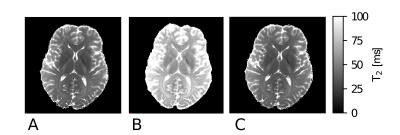
Figure 2: One-slice comparison of T2 maps produced by: (A) SSE technique, (B) MESE with mono-exponential signal modelling, (C) MESE with dictionary based EMC modelling method.
-
Simultaneous Mapping of Metabolite Concentration and T1 Relaxation Time Using Subspace Imaging Accelerated Inversion Recovery MRSI
Chao Ma1,2, Paul K. Han1,2, and Georges El Fakhri1,2
1Radiology, Massachusetts General Hospital, Boston, MA, United States, 2Radiology, Harvard Medical School, Boston, MA, United States
A new method is proposed for simultaneous mapping of metabolite concentration and T1 relaxation time with a fast inversion recovery-based MRSI sequence for data acquisition and a low-rank tensor-based method for simultaneous reconstruction of MRSI images at different TIs.
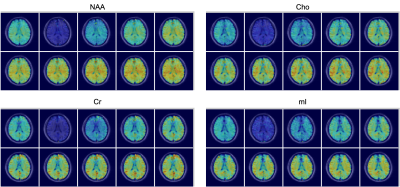
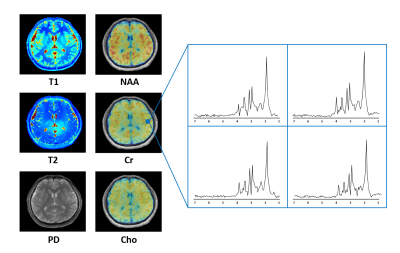
Figure 3. Maps of NAA, Cho, Cr, and mIns at different TIs obtained by the proposed method.
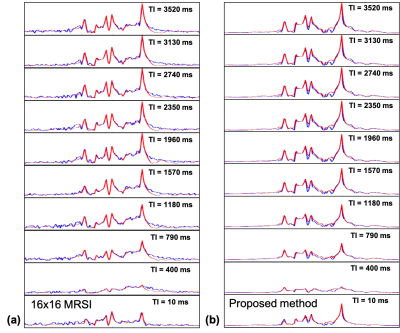
Figure 4. Representative spectra at different TIs from (a) low-resolution IR-MRSI (16x16) that were acquired using phase encoding gradients for spatial encoding and (b) the proposed high-resolution IR-MRSI (64x64), where the blue lines are the reconstructed spectra and the red lines are the fitted spectra.
-
RAMSES: Relaxation Alternate Mapping of Spoiled Echo Signals sequence for simultaneous accurate T1 and T2* mapping
Marco Andrea Zampini1,2, Jan Sijbers3, Marleen Verhoye2, and Ruslan Garipov1
1MR Solutions Ltd, Guildford, United Kingdom, 2Department of Biomedical Sciences, University of Antwerp, Wilrijk, Belgium, 3Department of Physics, University of Antwerp, Wilrijk, Belgium
RAMSES is a new 3D sequence for simultaneous T1 and T2* mapping based on toggling readout modality between mono- and multi-gradient echo. Based on spoiled gradient-echo acquisitions, it is a time-efficient method for robust quantitative MRI.
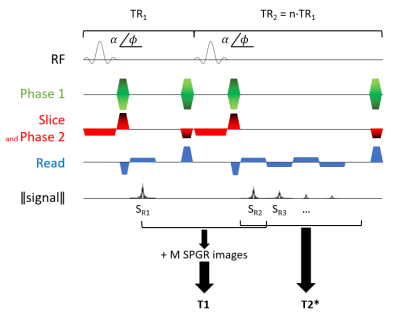
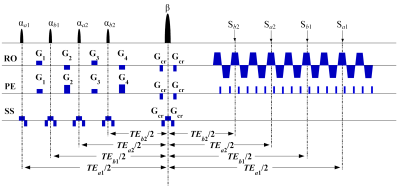
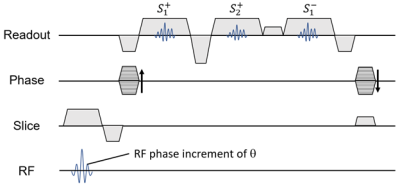
Figure 1: RAMSES pulse sequence diagram and parameter estimation scheme. With a Cartesian acquisition scheme, each k-space line is sampled during TR1 and TR2 with a mono- and multi-gradient echo, respectively. RF spoiling is employed by incrementing pulse phase φ while gradient spoiling takes place after data acquisition in read-only direction. Rewinder gradients are played in both phase directions.
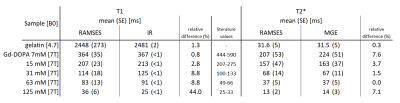
Figure 3: Estimated T1 and T2* mean and standard error values of the phantoms (gelatin and Gd-DOPA solutions) for RAMSES and their relative ground truth estimated via Inversion Recovery for T1 and multi-echo gradient-echo for T2*. Similar T1 values for Gd-DOTA solutions are found in Shen et al.10 although solvent and temperature were different (human blood at 37°C against water at room temperature).
-
Fast-Sweep Frequency-Modulated SSFP: Boosting Sensitivity for 3D Joint T1/T2 Mapping
Volkert Roeloffs1, Nick Scholand1,2, and Martin Uecker1,2,3
1Institute for Diagnostic and Interventional Radiology, University Medical Center Göttingen, Goettingen, Germany, 2DZHK (German Centre for Cardiovascular Research), Partner Site Göttingen, Germany, Goettingen, Germany, 3Campus Institute Data Science (CIDAS), University of Göttingen, Göttingen, Germany, Goettingen, Germany
Choosing a higher modulation speed in frequency-modulated SSFP sequences
increases sensitivity to T1 and T2. We combine this fast-sweep
frequency-modulated SSFP with stack-of-stars sampling and demonstrate 3D
joint T1/T2/B1/off-resonance mapping.
Fig 4: Synthesized time series after subspace-constrained reconstruction
with intensity-coded magnitude and color-coded phase. Frame rate equals
acquisition rate (8s sweep duration).
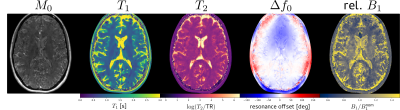
Fig 5: Parameter maps obtained after pixelwise fitting of
subspace-constrained reconstruction.
-
Simultaneous Mapping of Myelin Water Fraction and Quantitative Susceptibility of Whole Brain
Quan Chen1, Huajun She1, Ming Zhang1, Hongjiang Wei 1, and Yiping P. Du1
1Shanghai Jiao Tong University, Shanghai, China
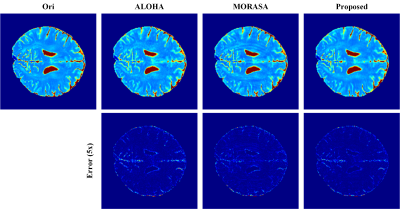
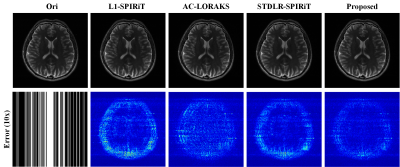
The feasibility of simultaneous MWF/QSM mapping is demonstrated
by using the multi-echo gradient echo (mGRE) sequence in this study.
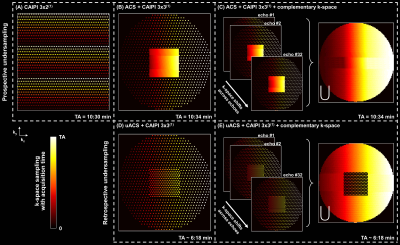
The retrospective and the perspective undersampling experiments have shown the
potential of obtaining whole brain QSM/MWF
quantifications in 1 minute.
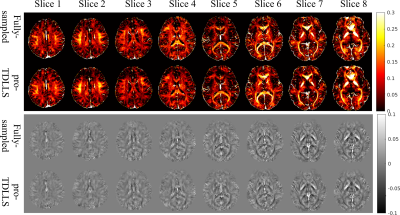
Figure
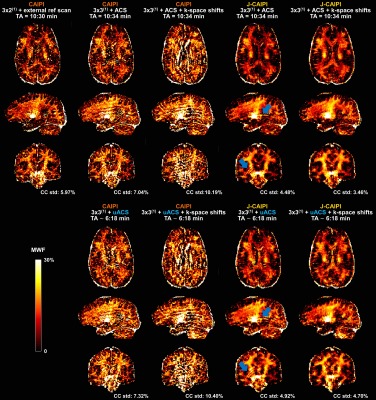
4. The MWF/QSM maps of 8
adjacent slices from one prospectively undersampled datasets with R=6 and the
fully-sampled dataset.
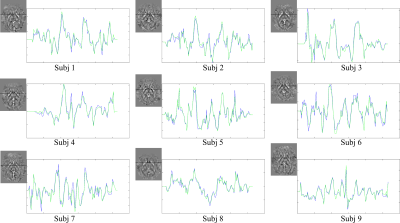
Figure 3. The profile plots corresponding to the black lines in
the QSM maps of the fully-sampled data and the TDLLS reconstructed data from 9
subjects (R=6). The blue lines and green lines in the plots refer to the signal
variations of the fully-sampled data and the TDLLS reconstructed data,
respectively. High agreements are observed
between the signal of TDLLS reconstructed data and that of the fully-sampled
data.
-
Two multi-echo SPGR acquisitions for the simultaneous generation of SWI, qT1 and other parametric maps: preliminary data
Vishaal Sumra1,2, Tobias C Wood3, and Sofia Chavez1,2
1Institute of Medical Science, University of Toronto, Toronto, ON, Canada, 2Brain Health Imaging Centre - MRI, Centre for Addiction and Mental Health, Toronto, ON, Canada, 3Department of Neuroimaging, King's College London, London, United Kingdom
Acquisition of complex multi-echo SPGR data for 2 flip angles allows for the generation of multi-parametric maps, including qT1 and QSM in the same space, through optimal processing of complex data.
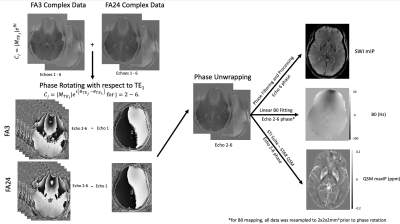
Figure 4. SWI, B0 and QSM processing schematic. Echo 1 phase was removed from echo 2-6 complex data in order to facilitate phase alignment across flip angles, prior to complex averaging. Complex phase difference data for both flip angles (α = 3° & 24°) were averaged for echoes 2-6. Echo 6 data alone was unwrapped, filtered and processed to create SWI, and echoes 2-6 data were processed to generate QSM. For B0 processing, all data was resampled to 2mm isotropic prior to phase rotation and averaging, then phase unwrapped and fit to a linear function (Δθ vs ΔTE) to map B0.
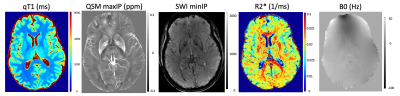
Figure 1. Acquisition of multi-echo SPGR complex data allows for the generation of multi-parametric maps.
-
Optimization of fast Quantitative Multiparameter Mapping (MPM) at 7T using parallel transmission
Difei Wang1, Rüdiger Stirnberg1, Eberhard Pracht1, and Tony Stöcker1,2
1German Centre for Neurodegenerative Diseases (DZNE), Bonn, Germany, 2Department of Physics and Astronomy, University of Bonn, Bonn, Germany
Fast MPM is achieved at 7T using 3D-EPI with PTx pulses to reduce B1+
field
inhomogeneities. The weighted PTx images are more homogeneous in the
Cerebellum. In the MPM framework, the residual inhomogeneity can be compensated for by B1+
field correction, resulting in high-quality parameter maps.
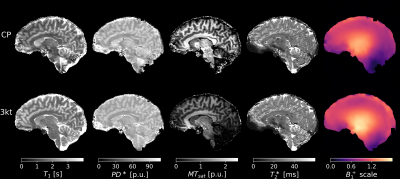
Fig. 3
A sagittal view of T1, PD* , MTsat
and T2* maps using the data acquired with the
CP mode and PTx pulses along with the corresponding B1+
scale map. The TR is 45 ms for both MTw scans. The nominal MT flip
angle is 260° for PTx image and 320° for CP. Both MTsat maps have
low CNR due to the insufficient MT saturation, especially in the
Cerebellum. The PTx B1+ scale map shows improved
excitation in the Cerebellum compared to the CP map. The PTx T1
map has higher values than the CP T1 map and robust voxel
estimates throughout the brain.
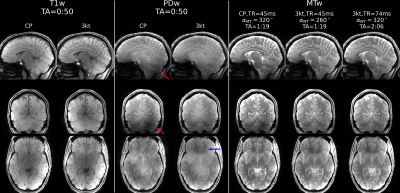
Fig. 1
Sagittal, coronal and axial view of T1w, PDw and MTw
images acquired using CP mode and PTx pulses. The last column shows
the MTw scan with prolonged TR and the same nominal MT flip angle as
the CP mode. The acquisition times are listed for each scan. All
three MTw scans share the same CP mode MT pulse with different
nominal saturation flip angles and TRs in order to match the SAR limits, listed respectively. The ones
with a higher FA show slightly better soft tissue contrast.
-
Joint sodium MR reconstruction and T2* estimation using anatomical regularization
Georg Schramm1, Johan Nuyts1, and Fernando Boada2
1KU Leuven, Leuven, Belgium, 2New York University School of Medicine, New York City, NY, United States
Anatomical regularization and T2* signal decay modeling during readout allow to suppress noise while preserving anatomical detail in reconstructions of dual echo sodium MR data.
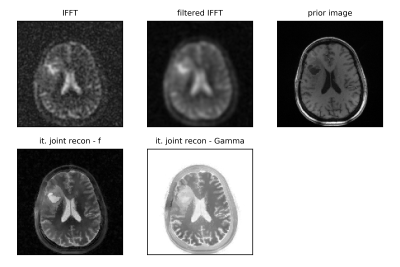
Figure 3: Trans-axial slice of a reconstruction of a real brain tumor data set. (top left) IFFT of data from 1 st echo. (top middle) Han filtered IFFT. (top right) T1 1H image used as anatomical prior. (bottom left) iterative reconstruction of Na signal using anatomical Bowsher prior and signal from 2 echos (βf = 0.01). (bottom middle) jointly reconstructed decay image Γ (βΓ = 0.03).
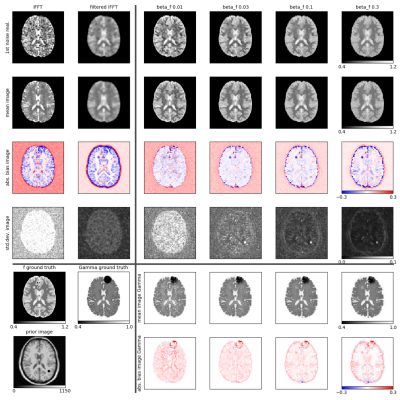
Figure 1: Results of 3D reconstructions of simulated dual echo Na MR data. Reconstruction of first noise realization, mean, bias and standard deviations imagesof f and Γ. (top left) unfiltered and filtered IFFT of data. (bottom left) simulated ground truth images. (right) Reconstructions of f and Γ for different levels of regularization.
-
Simultaneous T1, T2*, and Apparent Diffusion Coefficient Mapping with Stimulated Multi-Echo-Train EPI
Guangyu Dan1,2, Kaibao Sun1, Qingfei Luo1, and Xiaohong Joe Zhou1,2,3
1Center for MR Research, University of Illinois at Chicago, Chicago, IL, United States, 2Department of Bioengineering, University of Illinois at Chicago, Chicago, IL, United States, 3Departments of Radiology and Neurosurgery, University of Illinois at Chicago, Chicago, IL, United States
T1, T2*, and ADC can be quantitatively
mapped using a single pulse sequence based on a diffusion-weighted stimulated
echo sequence with multiple EPI readouts. This technique has been demonstrated in
the brain and the prostate of healthy human subjects.
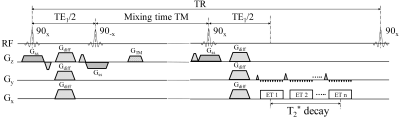
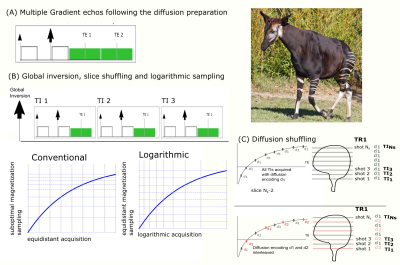
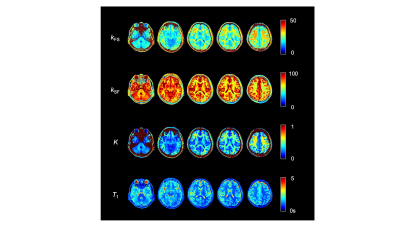
Figure 1. A diagram of the
stimulated multi-echo-train EPI sequence. This sequence is based on a
diffusion-weighted stimulated echo, and employs multiple EPI echo-train readouts
at and after the peak of the stimulated echo. Each echo train
corresponds to a different effective TE. A collection of the echo trains can be
used to calculate T2*. Gss, Gdiff,
GTM are the slice-selection, diffusion-weighted, and spoiling
gradients, respectively. ET denotes echo train.
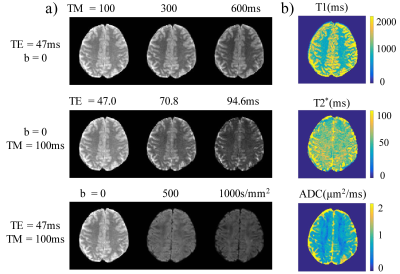
Figure
2. (a) Brain images acquired with the stimulated multi-echo-train EPI sequence
in Figure 1 from a healthy subject using three TMs (first row), three TEs
(second row), and three b-values (last row). (b) T1, T2*, and
ADC maps obtained from the corresponding row of images in (a). The numerical scales
are shown on the right with the units indicated on top of each color map.
-
Ultra-high Spatial Resolution Multispectral qMRI with Compressed Sensing Tri-TSE
Ryan McNaughton1, Hernan Jara1,2, Ning Hua2,3, Andy Ellison2,3, Lee Goldstein1,2,3, and Stephan Anderson2,3
1Boston University, Boston, MA, United States, 2Boston University Medical Center, Boston, MA, United States, 3Center for Translational Neuroimaging, Boston, MA, United States
Ultra-high
spatial resolution compressed sense Tri-TSE, with threefold acceleration, does
not negatively impact the accuracy of MS-qMRI maps of PD, T1, and T2. Tissue pixel
values show good quantitative agreement with the literature and non-compressed
sense Tri-TSE equivalents.
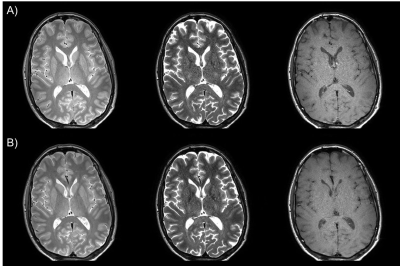
Comparison
of directly acquired image quality. A) Non-CS Tri-TSE and B) CS Tri-TSE images
are shown with PD-, T2-, and T1-weighted acquisitions from left to right.
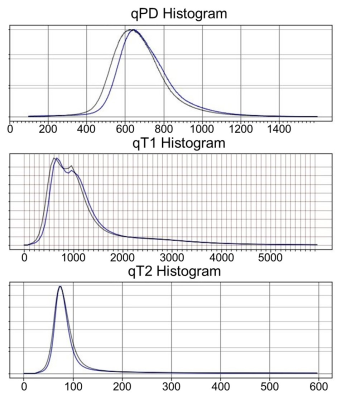
Whole-brain
histogram comparison. The CS-Tri-TSE images have less vulnerability to flow
ghosting artifacts, which probably lead to tighter PD, T1, and T2 histograms
(CS in blue and non-CS in gray).
-
BLAKJac - A computationally efficient noise-propagation performance metric for the analysis and optimization of MR-STAT sequences
Miha Fuderer1,2, Oscar van der Heide1,2, Cornelis A. T. van den Berg1,2, and Alessandro Sbrizzi1,2
1Computational Imaging Group for MR Diagnostics and Therapy, Center for Image Sciences, University Medical Center Utrecht, Utrecht, Netherlands, 2Department of Radiology, Division of Imaging and Oncology, University Medical Center Utrecht, Utrecht, Netherlands
A computationally efficient
performance metric is proposed to study the efficacy of MR-STAT acquisitions. The metric is derived from the analysis of the block-diagonal of the spectral representation of the Jacobian.
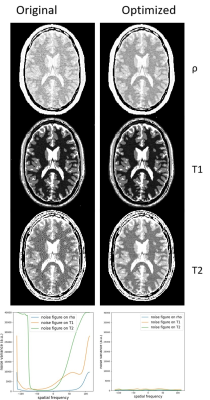
Figure 4: Reconstructed parameter maps and BLAKJac-estimated
frequency-domain plots of variances of the noise (bottom row); left: Original sequence;
right: Optimized sequence. In the images, narrow windowing has been applied to
visualize the noise. Vertical axis of the graphs is the noise variance,
arbitrary units, but same scale between the two graphs. The graphs show the
noise-enhancement for the high phase-encoding values in the Original sequence,
which is seen in image as high-spatial-frequency noise in the corresponding
images.
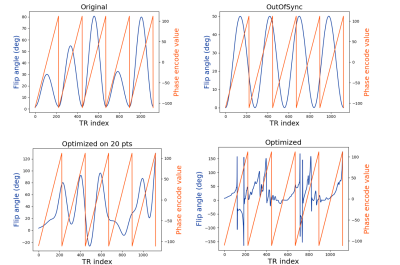
Figure 2: Flip-angle sequence (blue) and phase-encode values
(orange) for the four evaluated sequences
-
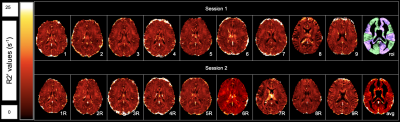
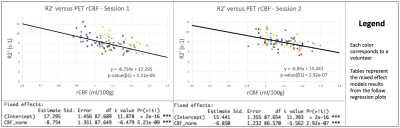
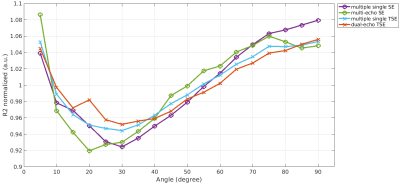
Characterisation of the flip angle dependence of R2* in Multi-Parameter Mapping
Giorgia Milotta1, Nadège Corbin1,2, Christian Lambert1, Antoine Lutti3, Siawoosh Mohammadi4,5, and Martina Callaghan1
1Wellcome Centre for Human Neuroimaging, UCL Queen Square Institute of Neurology, University College London, London, United Kingdom, 2Centre de Résonance Magnétique des Systèmes Biologiques, UMR5536, CNRS/University Bordeaux, Bordeaux, France, 3Laboratory for Research in Neuroimaging, Department for Clinical Neuroscience, Lausanne University Hospital and University of Lausanne, Lausanne, Switzerland, 4Department of Systems Neurosciences, University Medical Center Hamburg-Eppendorf, Hamburg, Germany, 5Department of Neurophysics, Max Planck Institute for Human Cognitive and Brain Sciences, Leipzig, Germany
With a
heuristic linear model of the FA-dependence of R2* we observed
excellent agreement between empirical observations and simulations based on two
exchanging water pools. Results indicate that the FA-dependence is greatest for
high myelin water fraction and slow exchange.
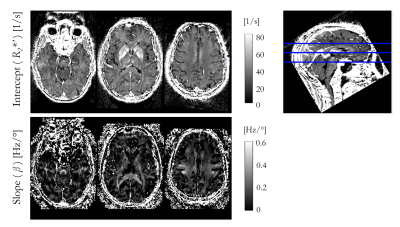
Figure 2 – Intercept (β) and
slope (R2*’) of R2* FA dependence obtained from linear
fitting according to Eq. 1. The same axial slices are shown as in Figure 1. The
spatial variability in the slope (β) highlights
specific, predominantly white matter structures, such as the superior
cerebellar fibres, brachium conjunctivum and corpus callosum.
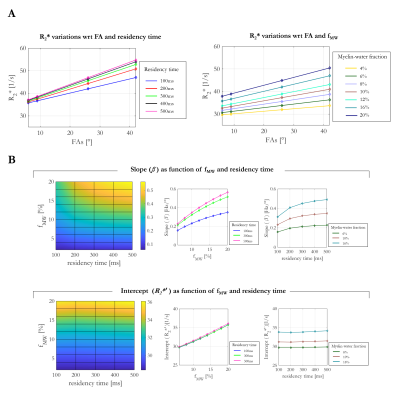
Figure 3 – Simulations of R2* variation with respect to FA,
residency time and fMW. A: R2* as a function of FA
together with linear fits according to Eq. 1 for a fixed fMW of 16%,
or a fixed residency time of 100ms. B: Variability of slopes and intercepts across
investigated conditions (residency time = 100-500ms, fMW = 2-20%).
The intercept R2*’ shows higher sensitivity to fMW
(12.6%), but effectively no dependence on residency time (0.74% variance across
range investigated). The slope was most sensitive to the fMW (~55%),
but additionally depended on residency time (~13%).
-
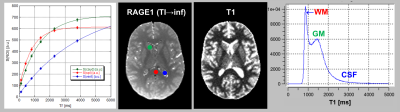
Mapping correlation spectra of T1 and mean diffusivity in the human brain
Alexandru V Avram1,2, Joelle E Sarlls3, and Peter J Basser1
1Eunice Kennedy Shriver National Institute of Child Health and Human Development, National Institutes of Health, Bethesda, MD, United States, 2Center for Neuroscience and Regenerative Medicine, The Henry Jackson Foundation, Bethesda,, MD, United States, 3National Institute of Neurological Disorders and Stroke, National Institutes of Health, Bethesda, MD, United States
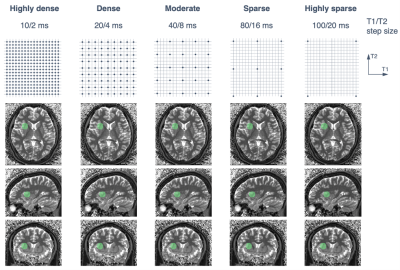
We develop and test a clinical sequence with integrated IR
and isotropic diffusion encoding (IDE) preparations. T1-mean diffusivity (MD) correlation
spectra derived from whole-brain MRIs with a wide range of joint T1-MD weightings
show tissue-specific components healthy volunteers.
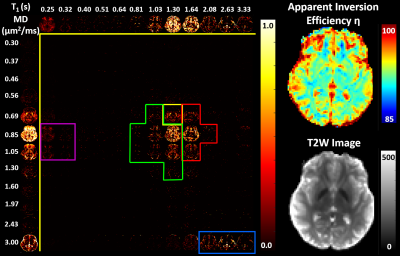
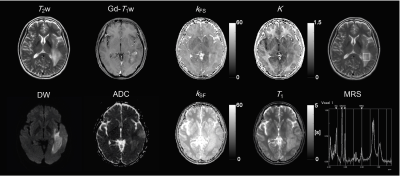
Figure 4: Left: Maps of 2D normalized
spectra of subvoxel T1-MD values along with the corresponding marginal
probability density functions (i.e., 1D normalized spectra) of subvoxel T1 values
(top row) and subvoxel MD values (left column) in a healthy volunteer. Spectral components specific to WM
(green), GM (red), subcortical GM (yellow), myelinated WM fibers (magenta), and
CSF (blue) can be observed both on the T1-D spectra as well as on the
corresponding marginal distributions. Right: Corresponding maps of the estimated apparent inversion efficiency η and non-attenuated signal.
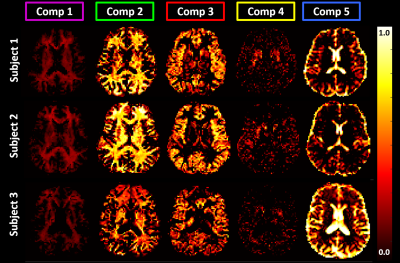
Figure 5: Maps of signal fractions corresponding to the principal
T1-MD spectral components delineated with color-coded boundaries in Fig. 4: Short-T1 WM (component 1) - magenta; WM (component 2) - green; GM (component
3) - red; Basal Ganglia (component 4) - yellow; and CSF (component 5) - blue.
Matching axial slices in three healthy volunteers show similar anatomical
features corresponding to these spectral domains.
-
BUDA-SAGE with unsupervised denoising enables fast, distortion-free, high-resolution T2, T2*, iron and myelin susceptibility mapping
Zijing Zhang1,2, Long Wang3, Hyeong-Geol Shin4, Jaejin Cho2, Tae Hyung Kim2, Jongho Lee4, Jinmin Xu1, Tao Zhang3, Huafeng Liu1, and Berkin Bilgic2
1State Key Laboratory of Modern Optical Instrumentation, College of Optical Science and Engineering, Zhejiang University, Hangzhou, China, 2Department of Radiology, A. A. Martinos Center for Biomedical Imaging, Massachusetts general hospital, Boston, MA, United States, 3Subtle Medical Inc, Menlo Park, CA, United States, 4Laboratory for Imaging Science and Technology (LIST), Department of Electrical and Computer Engineering, Seoul National University, Seoul, Korea, Republic of
BUDA-SAGE with unsupervised denoising
enables fast, distortion-free, high-resolution T2, T2*, iron and myelin
susceptibility mapping
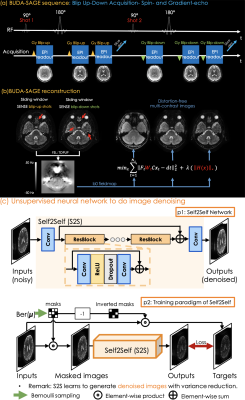
(a). BUDA-SAGE sequence diagram. Each scan can provide 3-echoes (one gradient echo, one mixed gradient-and spin echo, and one spin echo). Multiple scans can provide additional contrasts by changing the TEs of the sequence.(b). BUDA-SAGE reconstruction pipeline. (a) We conduct sliding window SENSE reconstruction for blip-up shots and blip-down shots, then put them into topup to estimate B0 field map. We incorporate B0 field map into MUSSELS to do BUDA reconstruction for all echoes. (c). The framework and training paradigm of the Self2Self model.
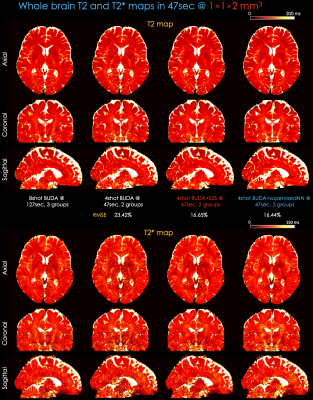
Whole-brain, distortion-free quantitative T2 and T2* maps at 1×1×2 mm3 resolution were obtained using Bloch dictionary matching using the multi-contrast images. We use 8-shot, 3-groups data (acquisition time: 140s=40s/group+5s dummy) as a reference. We provide the maps based on the reconstruction method of BUDA, BUDA+S2s, BUDA+supervisedNN with a subset of 2-groups, 4-shot data (acquisition time: 47s=20s/group + 5s dummy). BUDA+S2S with 2-groups, 4-shot data obtained comparable maps respect to those from 3-groups, 8-shot data.
-
Faster Bloch simulations and MR-STAT reconstructions on GPU using the Julia programming language
Oscar van der Heide1,2, Alessandro Sbrizzi1,2, and Cornelis van den Berg1
1Computational Imaging Group for MR Diagnostics and Therapy, Center for Image Sciences, University Medical Center Utrecht, Utrecht, Netherlands, 2Department of Radiology, Division of Imaging and Oncology, University Medical Center Utrecht, Utrecht, Netherlands
The multi-parametric quantitative MR-STAT reconstruction algorithm was implemented on GPU's using the Julia programming language, allowing for high-resolution in-vivo parameter maps to be reconstructed in two minutes per slice.

In-vivo MR-STAT reconstruction times for a matrix size of 224 × 224 (1 mm2 in-plane resolution) using various implementations of the reconstruction algorithm.
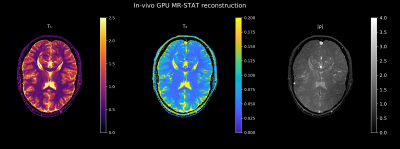
In-vivo parameter maps reconstructed using MR-STAT. The data was acquired from a healthy volunteer on a 3T MR system using a Cartesian, gradient-spoiled acquisition with varying flip angles. The total scan time was 9.9 s. The reconstruction time on the GPU was 2 minutes whereas before, using the same reconstruction algorithm, the reconstruction would take 3 hours using 96 CPU's on a computing cluster.
-
Compressed sensing for accelerated multi-parameter quantitative MRI
Arun Joseph1,2,3, Quentin Raynaud4, Antoine Lutti4, Tobias Kober5,6,7, and Tom Hilbert5,6,7
1Advanced Clinical Imaging Technology, Siemens Healthcare AG, Bern, Switzerland, 2Translational Imaging Center, Sitem-Insel, Bern, Switzerland, 3Departments of Radiology and Biomedical Research, University of Bern, Bern, Switzerland, 4Laboratory for Neuroimaging Research, Department for Clinical Neuroscience, Lausanne University Hospital and Lausanne University, Lausanne, Switzerland, 5Advanced Clinical Imaging Technology, Siemens Healthcare AG, Lausanne, Switzerland, 6Department of Radiology, Lausanne University Hospital and University of Lausanne, Lausanne, Switzerland, 7LTS5, École Polytechnique Fédérale de Lausanne (EPFL), Lausanne, Switzerland
We
implemented compressed sensing for quantitative MRI with the Multi Parameter Mapping
protocol. We present qMRI estimates obtained using a range of acceleration
factors, leading to four-fold acquisition time reduction while keeping
parameter variations per brain structure below 7.3%.
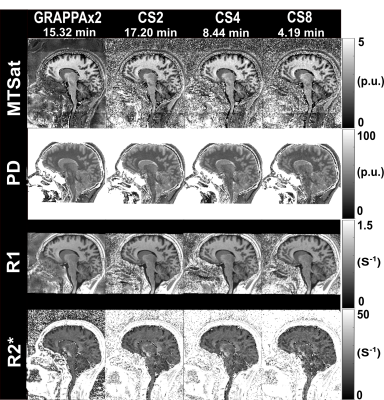
Figure 3:
MTSat, PD, R1, and R2* maps obtained from GRAPPAx2
and compressed sensing reconstructions with acceleration factors 2, 4, 8.
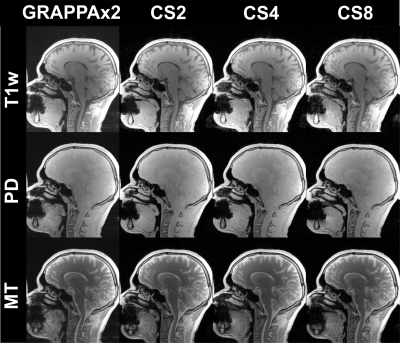
Figure 2:
Magnitude images
of the first echo obtained from the T1-weighted (T1w), PD-weighted, and MT-weighted
multi-echo GRE acquisitions in comparison of the different acceleration
techniques: GRAPPAx2 and compressed sensing (CS) reconstructions with
acceleration factors 2, 4, and 8.