-
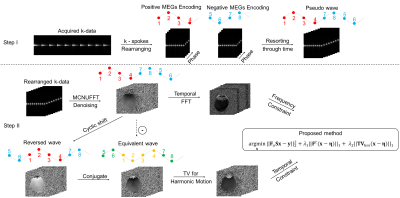
MR Elastography Reconstruction Based on a Linear Integral Equation Derived from the Helmholtz Identity
Motofumi Fushimi1, Naohiro Eda1, and Takaaki Nara1
1The University of Tokyo, Tokyo, Japan
A novel MRE reconstruction method that solves a linear integral equation derived from Helmholtz’s identity without calculating higher-order derivatives of the data, nor solving a nonlinear minimization problem is presented. Our preliminary study showed the feasibility of the method.
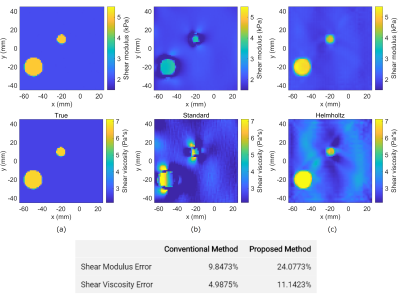
Figure 2: Shear modulus and viscosity maps for the cylinder model when no noise is added. (a) The true maps, (b) the reconstruction results of the conventional method, and (c) the reconstruction results of the proposed method. The table at the bottom shows the normalized L2 errors associated with each method.
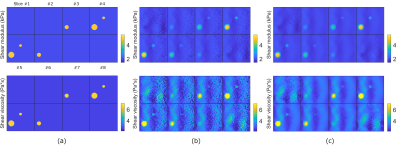
Figure 4: Shear modulus and viscosity maps for the sphere model when 1% Gaussian noise is added. Each figure shows results for all eight slices. (a) The true maps, (b) the reconstruction results of the proposed method with no regularization and (c) the reconstruction results of the proposed method with TV regularization.
-
Viscoelastic MRE Phantoms with Tunable Damping Ratio Independent of Shear Stiffness
L. Tyler Williams1, Zheng Cao1, Matthew D. J. McGarry2, Elise A. Corbin1, and Curtis L. Johnson1
1Biomedical Engineering, University of Delaware, Newark, DE, United States, 2Thayer School of Engineering, Dartmouth College, Hanover, NH, United States
Validation study
on the use of LPAA/PAA gels as viscoelastic MRE phantoms with
independently tunable shear stiffness and damping ratio. Phantoms show strong
MR signal and wave motion. Damping ratio increases with increasing LPAA
concentration while shear stiffness remains constant.
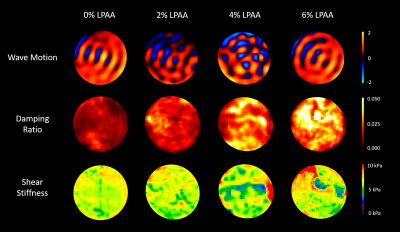
Figure 1. Representative wave motion, damping ratio, and
shear stiffness maps from each of the four phantoms with varying LPAA
concentration from 0% to 6%.
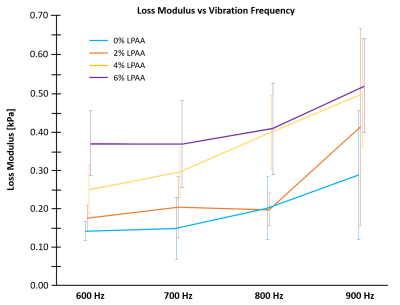
Figure 3. Loss modulus frequency dependence. The four
LPAA/PAA phantoms exhibit increasing loss moduli with increasing frequency from
600 to 900 Hz, indicative of viscoelastic behavior.
-
Investigation of Motion as a Source of Error in MR Elastography
Emily Chan1, Daniel Fovargue1, Matt Kelly2, Ralph Sinkus1,3, and Julia A Schnabel1
1School of Biomedical Engineering & Imaging Sciences, King's College London, London, United Kingdom, 2Perspectum, Oxford, United Kingdom, 3INSERM U1148, Laboratory for Vascular Translational Science, University Paris Diderot, University Paris 13, Paris, France
Care should be taken
to account for motion between breath-hold acquisitions in magnetic resonance
elastography.
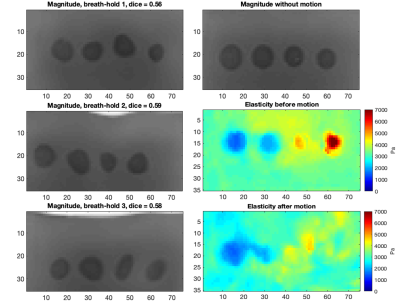
Figure 5: Magnitude
images for
one extreme case for each breath-hold at the highest simulated motion level and
the original magnitude image for reference. The average Dice score over the breath-holds
was 0.58. The elasticity maps before and after motion are also shown.
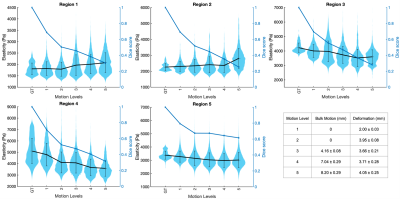
Figure 4: Violin plots comparing elasticity for all cases within each
region to the ground truth (GT) for
increasing motion. The average Dice overlaps between regions before and after
motion are shown in blue. A table of the bulk motion and deformation applied for each motion level is also shown.
-
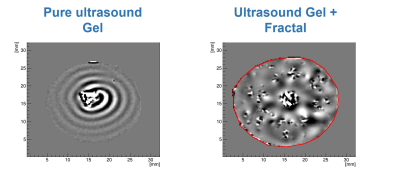
A viscoelastic phantom of the healthy human liver for elastography in MRI and ultrasound
Anna Morr1, Helge Herthum1, Felix Schrank1, Steffen Görner1, Jürgen Braun1, Ingolf Sack1, and Heiko Tzschätzsch1
1Charité - Universitätsmedizin Berlin, Berlin, Germany
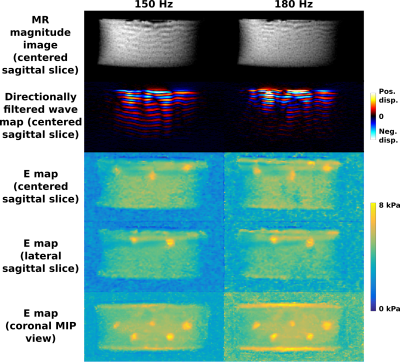
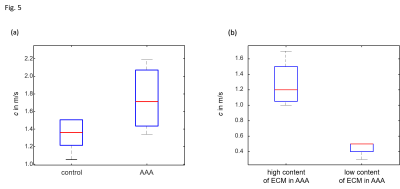
The proposed elastography phantom has viscous
and elastic properties in a wide frequency range similar to that of the human
liver. The novel phantom facilitates technical developments and improvements of
MRE and USE.
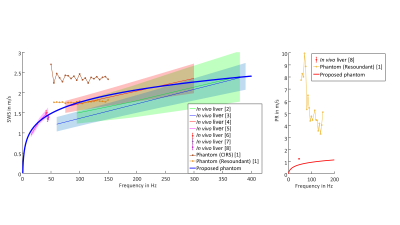
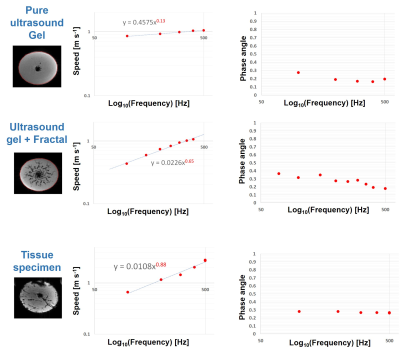
Comparison of the proposed
phantom with in vivo literature data
and conventional phantoms by means of shear wave speed (SWS) and penetration
rate (PR). The CIRS phantom showed no measurable shear wave damping (due to an
inverse relation between damping and PR, this corresponds to an infinity PR). Therefore,
the PR for CIRS phantom was not shown.
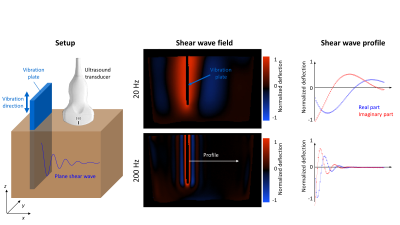
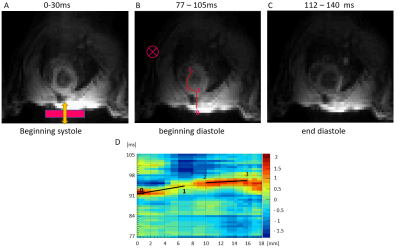
Setup and post
processing for USE and clinical MRE. A vibration plate was inserted in the
phantom to create plane shear waves. Shear wave fields for all vibration
frequencies are acquired within the $$$x-z$$$-plane. After frequency selection
by Fourier transformation a profile was drawn parallel to the wave propagation
(shown wave fields based on MRE). Viscoelastic properties (shear wave speed,
penetration rate) are obtained by fitting profile data (circles) with a damped
complex shear wave (solid lines).
-
Simultaneous acquisition for magnetic resonance elastography and fat quantification of the liver
Shuo Li1, Suhao Qiu1, Chenfei Shen1, Yuan Feng1, and Yiping P. Du1
1School of Biomedical Engineering, Shanghai Jiao Tong University, Shanghai, China
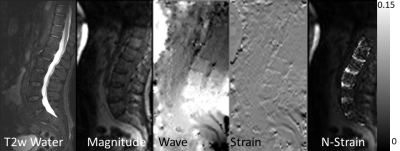
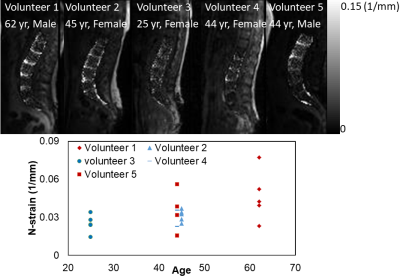
The feasibility of simultaneous acquisition for MR elastography and fat quantification without increasing scan time was demonstrated.
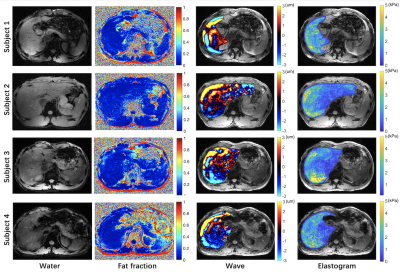
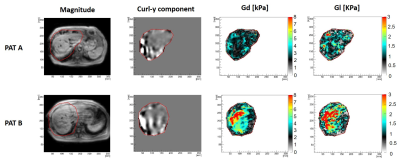
Figure 2. Water images, fat fraction maps, wave images and elastograms in four subjects.
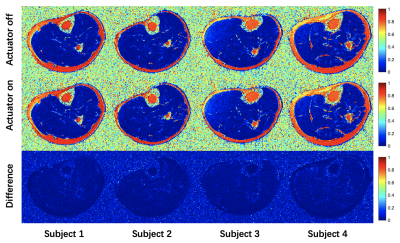
Figure 3. Fat fraction maps of lower-extremity with actuator turned off and on in four subjects.
-
Effect of different driver power amplitudes on the measurement of liver stiffness in pediatric liver MR elastography
Dong Kyu Kim1, Kyunghwa Han2, Haesung Yoon3, Mi-Jung Lee3, and Hyun Joo Shin3
1Radiology, Armed Forces Capital Hospital, Seongnam, Korea, Republic of, 2Center for Clinical Imaging Data Science, Severance Hospital, Seoul, Korea, Republic of, 3Radiology, Severance Hospital, Seoul, Korea, Republic of
This study investigated whether the
difference of driver power amplitudes would influence on the liver stiffness
measurements in pediatric MRE. Liver stiffness values in two different driver
power amplitudes on MRE showed good reliability.
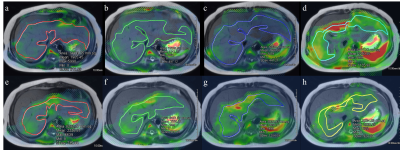
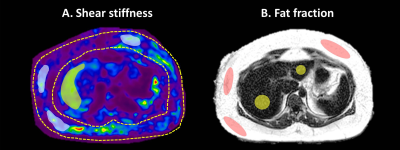
Fusion images of stiffness map and T2-weighted
images of the liver in 11 years old boy who had nonalcoholic steatohepatitis.
His fat signal percentage in the liver MRI was 51%, which was above the normal
limit of 6%. (a-d) Images from 20% driver power amplitudes showed mean liver
stiffness of 1.9 kPa in the area of 122.5 cm2. (e-h) Images from 56%
driver power amplitudes showed mean liver stiffness value of 2.3 kPa in the
area of 74.5 cm2
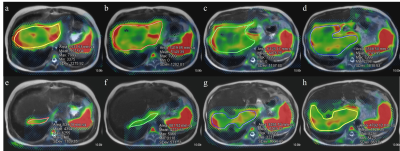
Fusion images of stiffness map and
T2-weighted images of the liver in 11 years old girl who had the Kasai
operation from biliary atresia. (a-d) Images from 20% driver power amplitudes
showed mean liver stiffness of 5.0 kPa in the area of 63.9 cm2.
(e-h) Images from 56% driver power amplitudes showed mean liver stiffness value
of 4.7 kPa in the area of 23.6 cm2
-
Optimal multiple motion encoding in phase contrast MRI
Helge Herthum1, Hugo Carrillo2, Axel Osses2, Sergio Uribe3, Ingolf Sack1, and Cristóbal Bertoglio4
1Experimentelle Radiologie, Charité Universitätsmedizin Berlin, Berlin, Germany, 2Center for Mathematical Modeling, Universidad de Chile, Santiago, Chile, 3Department of Radiology, School of Medicine, Pontificia Universidad Católica de Chile, Santiago, Chile, 4Bernoulli Institute, University of Groningen, Groningen, Netherlands
Applying the OMME method to MRE in phantom and in vivo experiments provides
wrap-free phase-contrast images with high motion-to-noise ratio. Reconstructed
shear wave speed maps show better detail resolution by overcoming the
unwrapping problem in MRE.
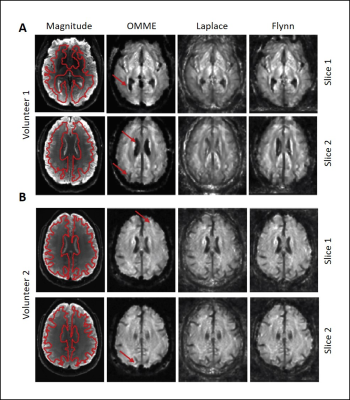
SWS maps for OMME (MEGs=4,8,16,32mT/m) and
Laplace and Flynn unwrapping (MEG=32mT/m) at different slices. The anatomical
reference from MRE magnitude is included (region of interest demarcated in red
for noise estimation). Red arrows indicate where OMME shows greater contrast in
the SWS map. A) Volunteer 1 for
vibration frequency 25Hz at two different slices. Grayscale ranges from 0.3-1.8m/s. B)
Volunteer 2 for vibration frequency 30Hz at two different slices. Grayscale ranges
from 0.2-2.2 m/s.
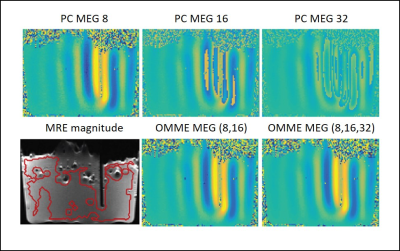
Multiple motion encoding reconstruction in the
phantom for two MEGs 8 and 16 mT/m and three MEGs 8, 16 and 32 mT/m in
comparison to phase contrast images. Color scale is set in the interval 80% of the
dynamic range of the MEG=8 image. Large positive values are colored in yellow
and negative values in blue, while green being zero. The bottom left image
shows the T2 weighted MRE magnitude as geometric reference.
-
In Silico Evaluation of Magnetic Resonance Elastography of the Kidney
Deirdre McGrath1, Christopher Bradley1, and Susan Francis1
1Sir Peter Mansfield Imaging Centre, University of Nottingham, Nottingham, United Kingdom
Magnetic resonance elastography of the kidney is simulated using finite element modelling with an anthropomorphic model, to allow evaluation of the errors on acquired MRE measures, and to inform optimisation of renal MRE methodology.
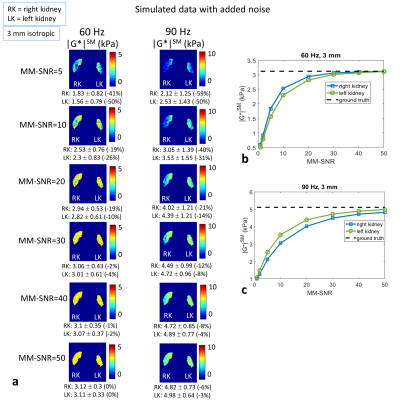
Figure
5: Simulated data with added noise (a) Elastograms (with smoothing) for added
noise with MM-SNR level= 5, 10, 20, 30, 40 and 50 (chosen to approximately
match the acquired data); (b) mean |G*|SM over
left and right kidney volumes versus MM-SNR, for 60 Hz, and compared to ground
truth value (dashed line); (c) similar to (b) but for 90 Hz. (Eroded masks are
applied for display and for mean values.)
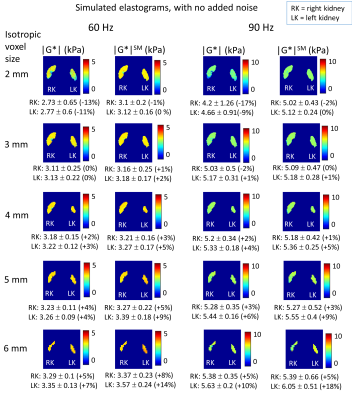
Figure
4: Simulated MRE elastograms (generated by direct inversion on the simulated
displacements) with no added noise for varying voxel dimensions, with mean ±
standard deviation |G*| over kidney volume, without smoothing and with
smoothing of the displacements with a 3D box filter, and % difference of mean
with ground truth. Eroded masks are applied for display and mean value
calculations, to remove edge values which are affected by errors at the simulated
kidney boundaries.
-
Optimization of GRE-MRE in the pancreas
Anne-Sophie van Schelt1, Nienke Wassenaar1, Eric M Schrauben1, Marian Troelstra1,2, Jules L. Nelissen1, Ralph Sinkus2,3, Jaap Stoker4, Aart J Nederveen1, and Jurgen H Runge1
1Radiology and Nuclear Medicine, Amsterdam UMC location AMC, Amsterdam, Netherlands, 2Department of Imaging Sciences and Biomedical Engineering, King's College London, London, United Kingdom, 3Inserm U1148, LVTS, University Paris Diderot, Paris, France, 4Radiology and Nuclear medicine, Amsterdam UMC location AMC, Amsterdam, Netherlands
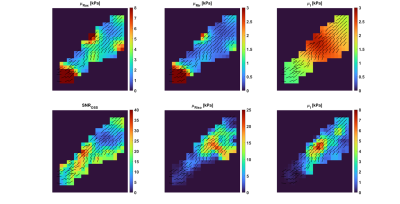
The aim of this study is to optimize pancreatic GRE-MRE to provide an in-depth analysis of the propagation and registration of shear waves using a combination of frequency, wave-phase offsets, and TE. The optimal combination was found to be at 40Hz, TE6.9ms and 4 or 5 offsets.
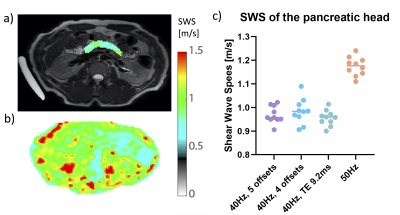
Figure 4. a) Example T2 weighted image with the SWS map on the pancreas (top left) b) and SWS map (bottom left) in one volunteer. c) The average SWS per scan-protocol. The SWS is higher for 50Hz as expected compared to scans using 40Hz.
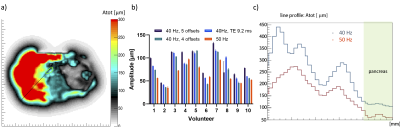
Figure 1. a) Example shear wave amplitude map. The line-profile is given in black. b) The average amplitude measured in the pancreas head plotted for each volunteer for each scan. c) The shear wave amplitude was measured and a line-profile was made from the liver to the pancreatic head. The blue line indicates the line-profile for a protocol with a frequency of 40Hz and the red line is for a frequency of 50Hz.
-
An Electromagnetic Actuator for Brain Magnetic Resonance Elastography
Suhao Qiu1, Zhao He1, Runke Wang1, Ruokun Li2, Fuhua Yan2, and Yuan Feng1
1the Institute for Medical Imaging Technology, Shanghai Jiao Tong University, Shanghai, China, 2the Department of Radiology, Ruijin Hospital, Shanghai, China
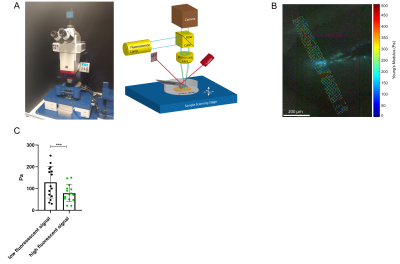
An electromagnetic
actuator was designed, tested, and verified for brain magnetic resonance
elastography (MRE). The actuator is easy to use, comfort to wear, and can carry
out multi-frequency MRE with high accuracy.
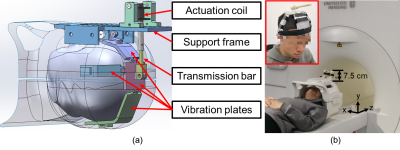
Figure
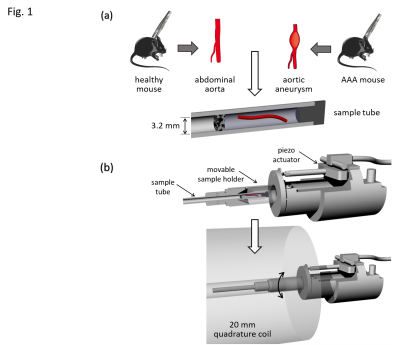
1. (a)
A 3D rendering of the electromagnetic actuator for brain MRE in working
position. The vibration plates wrap around the human head inside a head coil.
(b) A volunteer wearing the actuator before moving into the MR bore for MRE.
The vibration plates are fixed on the head with soft bandages. The part of the
actuator that extrudes out of the head coil is 7.5 cm in height, leaving enough
space for positioning.
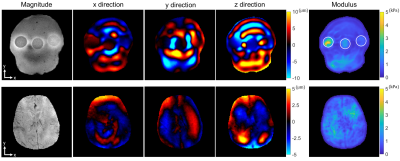
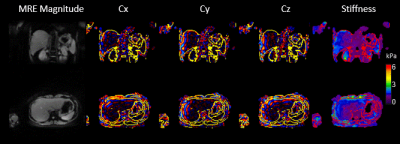
Figure 5. The
first line and the second line are the typical MRE results from the phantom and a volunteer, respectively. Column 1 is the magnitude
image. Column 2-4 are the real part of the first harmonic component of the
displacement field in x, y, and z direction, respectively. Column 5 is the LFE inversion results after smoothing. The locations of these three
agar inclusions are indicated by white circles.
-
Magnetic resonance elastography of the in vivo human brain using multifrequency wavenumber analysis in 2D and 3D.
Helge Herthum1, Heiko Tzschätzsch1, Tom Meyer1, Mehrgan Shahryari1, Lisa Stencel1, Jing Guo1, Jürgen Braun2, and Ingolf Sack1
1Experimentelle Radiologie, Charité Universitätsmedizin Berlin, Berlin, Germany, 2Institut für medizinische Informatik, Charité Universitätsmedizin Berlin, Berlin, Germany
We here present multifrequency wavenumber analysis for
MR elastography of the human brain in 2D and 3D. Reproducibility and detail
resolution of the new methods are better than obtained from standard multifrequency
inversion methods.
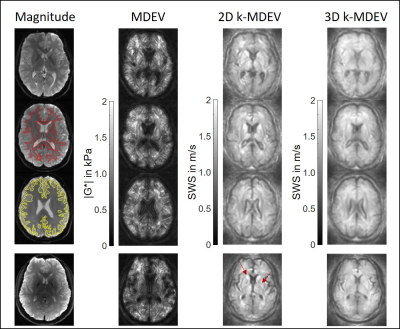
Results from MDEV (|G*|) and 2D and 3D k-MDEV (SWS) inversion in different
slices (1.5-Tesla). Magnitude images are shown on the left side together with
segmented regions for white matter (red) and gray matter (yellow). The last row
shows results for the measurement at 3.0-Tesla with 1.6x1.6x2mm3 voxel
size. Increased resolution allows to easily identify anatomical regions in deep gray matter characterized by stiff
properties such as the putamen and caudate nucleus (indicated by arrows).
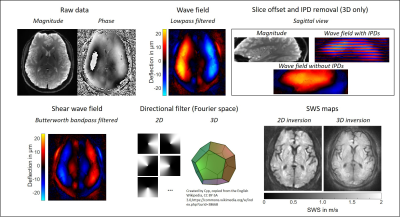
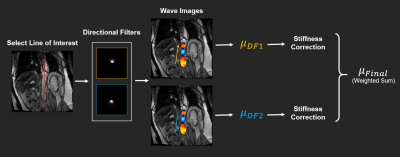
2D and 3D k-MDEV. The phase of the MRE data is smoothed
(Butterworth lowpass, threshold 250 m-1, order 3) and the harmonic
wave field is extracted using the Fourier transform. For 3D, inter-phase
discontinuities (IPD) and slice offsets [13] are removed as shown in the sagittal view. A bandpass
filter (Butterworth, lower threshold 15 m-1, upper threshold 200 m-1,
order 3) suppresses compression waves and the remaining shear wave field is
directionally filtered in 8 (2D) or 20 (3D, right, dodecahedron) directions.
SWS is reconstructed from the phase gradient in 2D and 3D.
-
Deep Learning Automation for Human Brain Masking of Multi-Band MR Elastography
Aaron Thomas Anderson1,2, Siddharth Muralidaran3, Alexander M Cerjanic1,4, Bradley P Sutton1,4, Mark A Anastasio1,4, and Frank J Brooks1,4
1Beckman Institute for Advanced Science & Technology, University of Illinois at Urbana-Champaign, Urbana, IL, United States, 2Stephens Family Clinical Research Institute, Carle Foundation Hospital, Urbana, IL, United States, 3Electrical & Computer Engineering, University of Illinois at Urbana-Champaign, Urbana, IL, United States, 4Bioengineering, University of Illinois at Urbana-Champaign, Urbana, IL, United States
A deep learning network was trained to automate brain masking for multiband, multishot spiral MR elastography displacement imaging. The automated masking did not change displacement data quality and saves hours of manual masking.
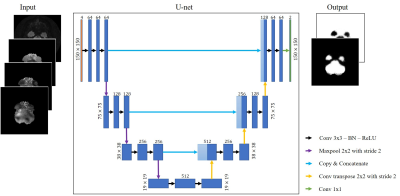
Figure 2: (left) Example of 4-channel input image; (right) Corresponding 2-channel output predicted by the U-net; (center) U-net architecture – blue boxes represent feature maps with the number of channels denoted on top of the box. The arrows represent operations as described by the legend.
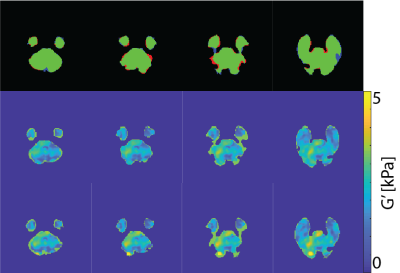
Figure 3: (top) Comparing manual mask with deep learning method mask: agreement (green) and overshoot (blue) and undershoot (red) of the deep learning method. Elastograms of the manual mask (middle) and deep learning mask (bottom). Both the manual and the deep learning mask have similar elastograms.
-
Effect of Spatial Inhomogeneity Models on Performance of Machine Learning Based Inversion Algorithms for Brain Magnetic Resonance Elastography
Jonathan M Scott1, Joshua D Trzasko1, Armando Manduca1, Matthew L Senjem1, Clifford R Jack1, John Huston III1, Richard L Ehman1, and Matthew C Murphy1
1Mayo Clinic, Rochester, MN, United States
While the specific spatial inhomogeneity assumption
used in training machine-learning MRE inversion algorithms affects stiffness
estimates, our in vivo results show only
modest impact on repeatability and observed biological effects when relatively
small spatial footprints are used.
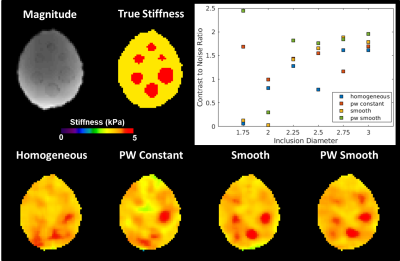
The piecewise smooth
inversion produces the best contrast to noise ratio (CNR) for inclusions in the
brain simulating phantom. The piecewise smooth inversion produces the best
CNR in 4 of the 6 inclusions and is a close second in a fifth. The only
inclusion where the piecewise smooth inversion did not perform well was
difficult for all inversions, as no inversion produced a CNR better than 1.
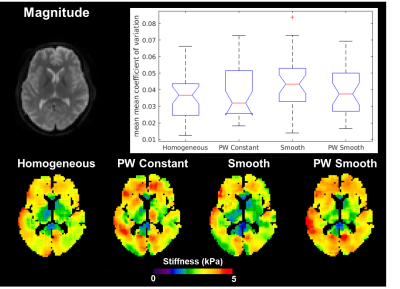
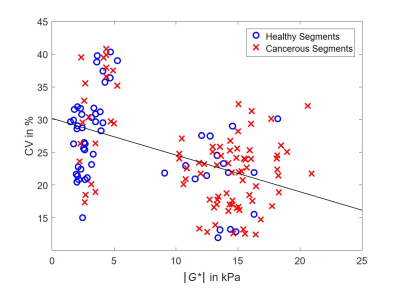
Different inversion material property
assumptions produce no difference in repeatability. While stiffness maps in an individual case are
appreciably different (bottom row), there is no significant difference in
coefficient of variation (CV) between the inversions in any of the 35 gray
matter regions of interest. The box plot (line=median, box edges = 25th/75th
percentiles, whiskers=extremes, +=outlier) shows the mean of the mean CVs in
the 35 regions for the four inversions in 10 subjects.
-
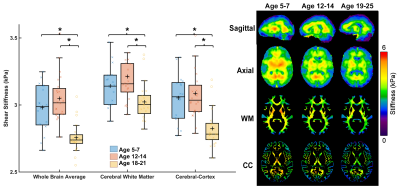
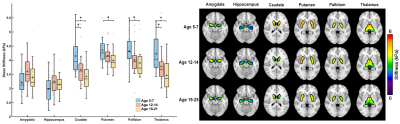
Cerebral inversion recovery MR elastography for cortical stiffness quantification
Ledia Lilaj1, Helge Herthum2, Tom Meyer2, Mehrgan Shahryari2, Gergely Bertalan2, Alfonso Caiazzo2, Jürgen Braun3, Thomas Fischer2, Sebastian Hirsch4,5, and Ingolf Sack2
1Radiology, Charité – Universitätsmedizin Berlin, Berlin, Germany, 2Charité – Universitätsmedizin Berlin, Berlin, Germany, 3Institute of Medical Informatics, Charité – Universitätsmedizin Berlin, Berlin, Germany, 4Berlin Center for Advanced Neuroimaging, Charité – Universitätsmedizin Berlin, Berlin, Germany, 5Bernstein Center for Computational Neuroscience, Berlin, Germany
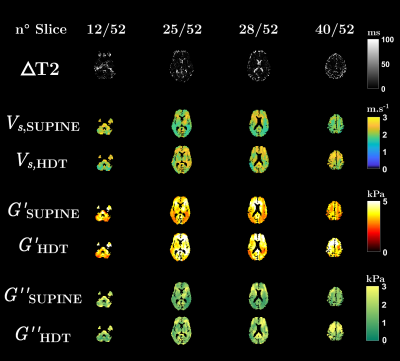
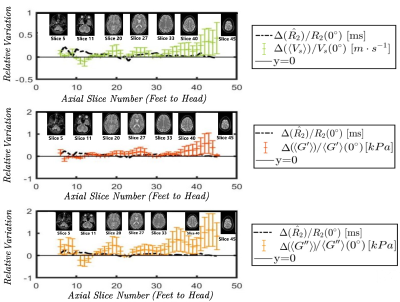
Inversion recovery
magnetic resonance elastography (IR-MRE) performs MRE while nulling a tissue
signal based on its T1. In the brain, it reduced the effect of fluid vibration
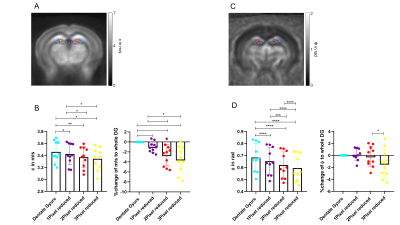
in CSF-filled areas and improved stiffness estimation in the cortex.
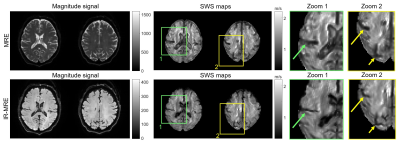
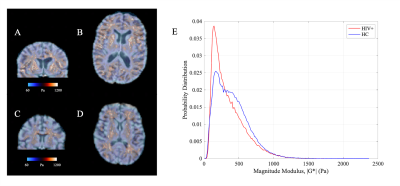
Representative brain images obtained by MRE and IR-MRE in the same
volunteer. The magnitude signals in IR-MRE show solid tissue without freely moving
water, leading to significantly improved depiction of fluid-solid boundaries in
SWS maps (arrows). Note that sulci and ventricles are narrower in IR-MRE than
MRE due to suppressed phase discontinuities, similar to the phantom experiments
shown in Figure 3.
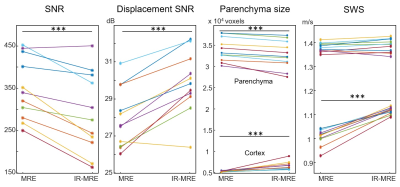
Group values of parameters quantified in this study. *** p < 0.001.
-
Multi-Excitation Actuator Design for Anisotropic Brain MRE
Diego A. Caban-Rivera1, Daniel R. Smith1, Keshav A. Kailash2, Ruth J. Okamoto2, Matthew D.J. McGarry 3, Lance T. Williams1, Charlotte Guertler2, Grace Mcilvain1, Damian Sowinski3, Elijah E.W. Van Houten 4, Keith D. Paulsen3,5, Philip V. Bayly2, and Curtis L. Johnson1
1Biomedical Engineering, University of Delaware, Newark, DE, United States, 2Mechanical Engineering and Material Science, Washington University in St. Louis, St. Louis, MO, United States, 3Thayer School of Engineering, Dartmouth College, Hanover, NH, United States, 4Mechanical Engineering, Université de Sherbrooke, Sherbrooke, QC, Canada, 5Dartmouth-Hitchcock Medical Center, Lebanon, NH, United States
Thorough examination of a novel customized multi-excitation MRE actuator combining both left-right and anterior-posterior drivers for anisotropic mechanical property estimations in white matter tracts of the human brain.
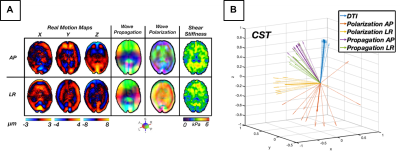
Figure 2: (A) AP and LR excitation wave characteristics for (matching slice, repetition): motion fields, wave propagation/polarization
directions, isotropic inversion shear stiffness. (B) 3D
vectors display average directions of wave propagation and polarization in
the CST vs. fiber orientation (DTI). Light and dark arrows represent repetitions and averaged across all repetitions, respectively. We observe similar wave propagation directions
between AP and LR excitations. Wave polarization directions are visibly
differentiable and distinct from propagation.
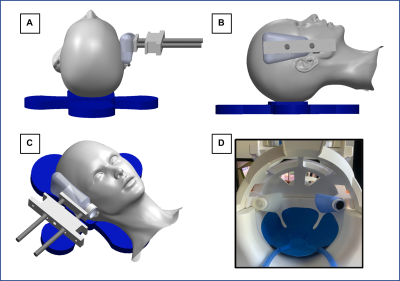
Figure 1: Schematic of the custom
actuator design orientations (A, B, C) and a picture of the set-up inside the
20 channel head coil (D). The design allows the actuator to rest against the
side of the subject’s head and is adjustable for different head sizes; it can
be configured before the subject is laying in the coil which reduces set-up
time and variability.
-
Intra-patient comparison of 3D and 2D MRE techniques for assessment of liver fibrosis
Roberta Catania1, Amir A. Borhani1, Camila Lopes Vendrami1, Roger C Grimm2, Bradley D. Bolster3, and Frank Miller1
1Northwestern University Feinberg School of Medicine, Chicago, IL, United States, 2Mayo Clinic, Rochester, MN, United States, 3Siemens Medical Solutions USA, Inc., Salt Lake City, UT, United States
3D
MRE provides liver stiffness measures with less susceptibility to artifacts and
larger measurable areas of liver compared to 2D techniques. The Liver Stiffness
Measures based on 3D MRE are lower than 2D techniques.
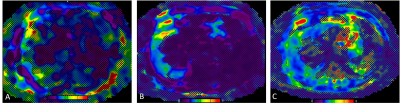
Elastograms with overlying confidence maps
obtained with 2D GRE (A), 2D EPI (B), and 3D EPI (C) MR elastography techniques
in a 70-year-old male patient with non-alcoholic fatty liver disease. The liver
parenchyma available for LSM measurement was significantly larger with 3D MRE.
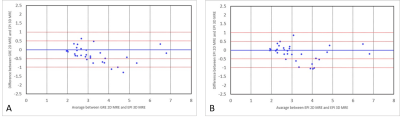
Bland-Altman
plots showing magnitude of variation of LSMs between 3D EPI and 2D GRE (A), and
between 3D EPI and 2D EPI (B). Arbitrary lines for 0.5 kPa and 1 kPa difference
in LSMs are drawn.
-
Short echo time dual-frequency MR Elastography with Optimal Control RF pulses
Pilar Sango Solanas1, Kevin Tse Ve Koon1, Eric Van Reeth1,2, Cyrielle Caussy3,4, and Olivier Beuf1
1Univ Lyon, INSA‐Lyon, Université Claude Bernard Lyon 1, UJM-Saint Etienne, CNRS, Inserm, CREATIS UMR 5220, U1206, F‐69616, Lyon, France, 2CPE Lyon, Département Sciences du Numérique, Lyon, France, 3Univ Lyon, Laboratoire CarMen, Inserm, INRAe, INSA Lyon, Université Claude Bernard Lyon 1, Pierre-Bénite, France, 4Hospices Civils de Lyon, Département Endocrinologie, Diabète et Nutrition, Hôpital Lyon Sud, Pierre-Bénite, France
An OC-based pulse able to encode motion into the phase of the NMR signal
is exploited to perform simultaneous multifrequency MRE. The obtained shear
waves patterns correspond to those found with classical MEG but with a shorter
TE.
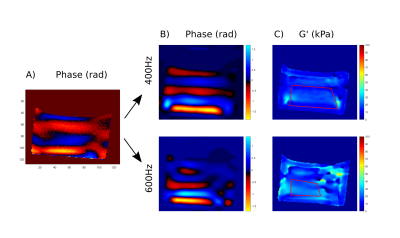
Figure 2. A) Phase image of the composite
excitation (rad). B) Then separed in phase images (rad) of every frequency
component extracted after temporal fourier transform: top, 400 Hz; bottom, 600Hz.
C) G' elastograms (kPa) reconstructed for each frequency component.
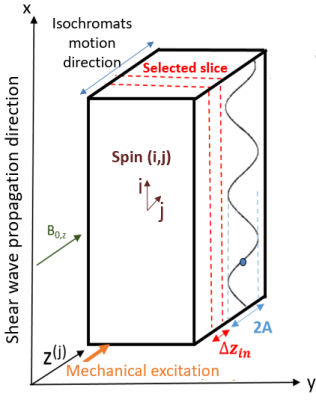
Figure 1. Experimental
setup: the shear wave propagates in the phantom along the x-axis.
The shear wave-dephasing angle is defined as θi=2πxi/λ with xi representing
a specific position.
-
Comparative analysis of indentation and magnetic resonance elastography for measuring viscoelastic properties
Yu Chen1, Suhao Qiu1, Zhao He1, Fuhua Yan2, Ruokun Li2, and Yuan Feng1
1Institute for Medical Imaging Technology, School of Biomedical Engineering, Shanghai Jiao Tog University, Shanghai, China, 2Department of Radiology, Ruijin Hospital, Shanghai Jiao Tong University School of Medicine, Shanghai, China
Using 2nd-order Prony series,
sample frequency response measured from indentation was estimated and compared
with that from MRE. In 50-100Hz frequency range, an apparent
frequency-dependent behavior was observed by MRE, while no such phenomenon was
observed by indentation.
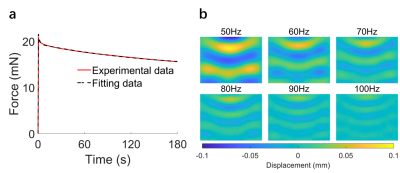
Figure
3. (a) The experimental and fitted ramp and relaxation
curves from indentation tests. (b) Wave propagation images of MRE from 6
different actuation frequencies.
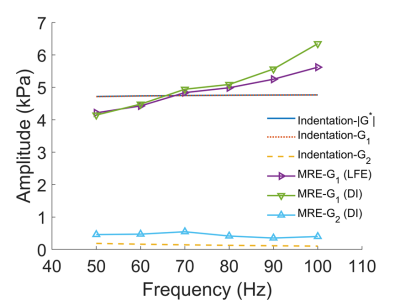
Figure
4. Comparisons of the shear moduli of the gel phantom based
on indentation and MRE measurements.
-
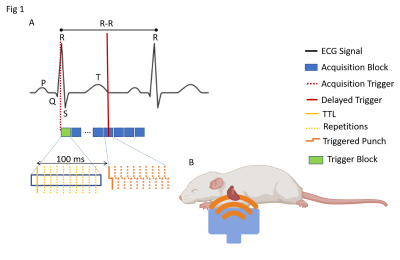
Development of robust MRE for measurement of high-speed functionally mediated changes in human brain viscoelasticity
Bin Deng1,2,3, W. Scott Hoge3,4, Shruti Mishra3,4, Giacomo Annio5, Ralph Sinkus5, and Samuel Patz3,4
1Athinoula A. Martinos Center for Biomedical Imaging, Massachusetts General Hospital, Charlestown, MA, United States, 2Radiology, Massachusetts General Hospital, Boston, MA, United States, 3Harvard Medical School, Boston, MA, United States, 4Radiology, Brigham and Women’s Hospital, Boston, MA, United States, 55. Laboratory for Vascular Translational Science (LVTS, Institut National de la Santé et de la Recherche Médicale (INSERM), Paris, France
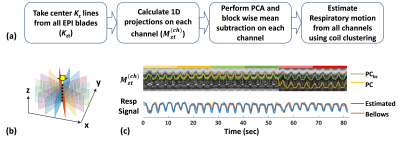
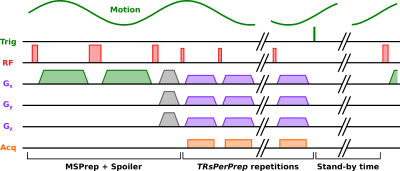
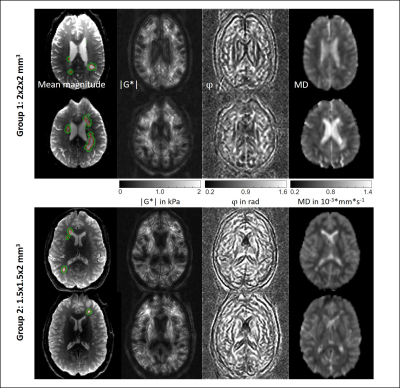
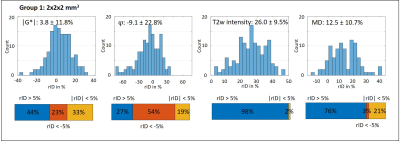
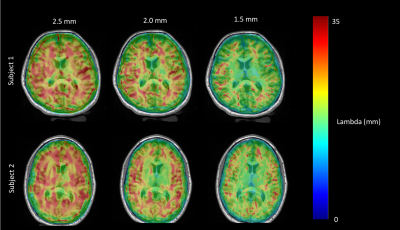
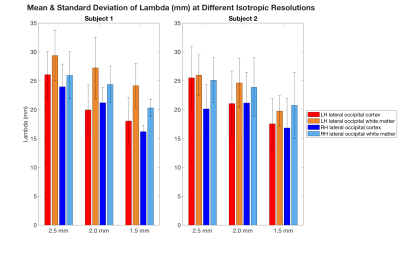
fMRE brain data from a healthy volunteer acquired at 1Hz switching frequency between two interleaved control paradigms at 1.5-mm isotropic high spatial resolution demonstrated both excellent intra- and inter-scan reproducibility of elastography measurements.
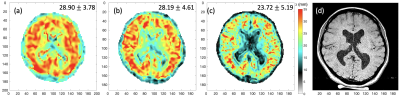
Fig.2: Comparison of reconstructed wavelength maps (λ in mm) of a healthy volunteer acquired at three different spatial resolutions: (a) 2.5 mm isotropic; (b) 2 mm isotropic; and (c) 1.5 mm isotropic voxels. Axial T1 image of 0.5 mm in-plane resolution of the matching slice is shown in (d). Median and standard deviation of valid brain region voxels in the slice are shown on top right corner.
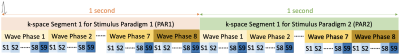
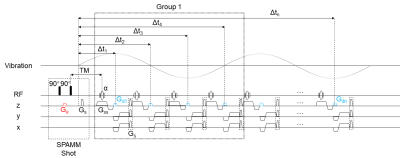
Fig.1: Schematic of fMRE data acquisition with interleaved stimulus paradigms, i.e., PAR1 & PAR2, each containing 9 slices and 8 wave phases. A trigger signal is sent out at the beginning of each block shown to synchronize the k-space acquisition with mechanical vibrations for both paradigms with the loop hierarchy. This block is repeated for each k-space line acquisition and MEG-encoding direction. For fMRE scans with functional activation, a stimulus will be switched ON and OFF in sync with PAR1 and PAR2 sequence timing. In this study, no stimulus is used for either PAR1 or PAR2.
-
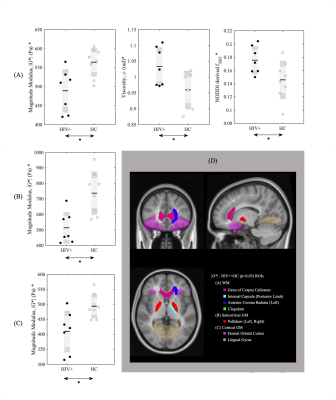
Anisotropic Mechanical Properties of White Matter Tracts Estimated with Multi-Excitation MRE and TI-NLI
Daniel R. Smith1, Diego A. Caban-Rivera1, Matthew D. J. McGarry2, L. Tyler Williams1, Grace McIlvain1, Charlotte Guertler3, Ruth J. Okamoto3, Damian Sowinski2, Elijah Van Houten4, Phil V. Bayly3, Keith D. Paulsen2, and Curtis L. Johnson1
1Biomedical Engineering, University of Delaware, Newark, DE, United States, 2Thayer School of Engineering, Dartmouth College, Hanover, NH, United States, 3Mechanical Engineering and Materials Science, Washington University in St. Lous, St. Louis, MO, United States, 4Mechanical Engineering, Universite de Sherbrooke, Sherbrooke, QC, Canada
Using multi-excitation MRE and TI-NLI, we estimated and found
significant differences in the anisotropic mechanical properties, substrate
shear modulus μ, shear anisotropy φ, and tensile
anisotropy ζ, within individual
regions of interest of the human brain.
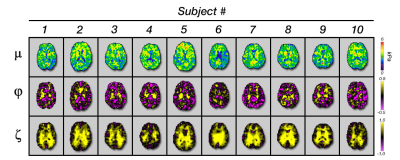
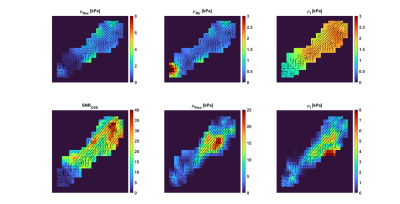
Figure 3: Representative slice for each subject
investigated showing each of the three anisotropic material parameters: μ, φ, and ζ.
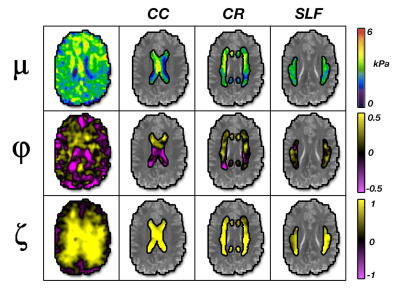
Figure 4: Representation of the three anisotropic
material parameters (μ, φ, ζ) in WM tracts: corpus
callosum (CC), corona radiata (CR), and superior longitudinal fasciculus (SLF).