-
In vitro validation of a real-time 3D MRI Urodynamics Protocol
Colin Kim1, Cody Johnson1, James Rice2, and Alejandro Roldán-Alzate1
1Medical Physics and Radiology, University of Wisconsin-Madison, Madison, WI, United States, 2Mechanical Engineering, University of Wisconsin-Madison, Madison, WI, United States
This study utilized 3D MRI acquisition on both an in vitro
bladder model and an in vivo human subject to analyze deformation patterns
during the bladder voiding process and validated results with high-speed
optical imaging.
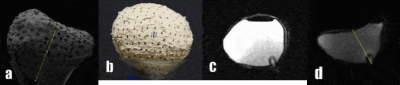
Figure 1 a.)
single frame from the phantom camera footage with measured segment b.) gif
created from SLR footage of voiding bladder c.) gif created from MRI sequence
of voiding d.) single frame from MRI sequence with measured segment.
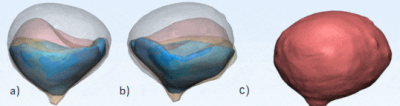
Figure 2. a) Captures
of the anterior view of the in vitro 3D
segmented bladder volumes at various time points showing deformation over
voiding b.) posterior view of the segmented bladder c.) animated asymmetric and
complete deformation of the model at various time points.
-
Preliminary Exploration of Expanding the Target Population of VI-RADS - Could Patients After Treatment Benefit from It?
Bohong Cao1, Qing Li1, Peirong Xu2, Pu-Yeh Wu3, Shuai Jiang2, and Jianjun Zhou1
1Radiology, Zhongshan Hospital Fudan University, Shanghai, China, 2Urology, Zhongshan Hospital Fudan University, Shanghai, China, 3MR Research, GE Healthcare, MR Research, Beijing, China
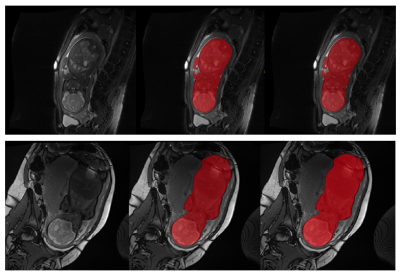
1. The area under the receiver operating characteristic curve (AUC) for Vesical Imaging-Reporting and Data System (VI-RADS) of the the whole bladder cancer group was 0.945.
2. The AUCs of the primary group, the post-treatment group and the recurrence group were all greater than 0.90.
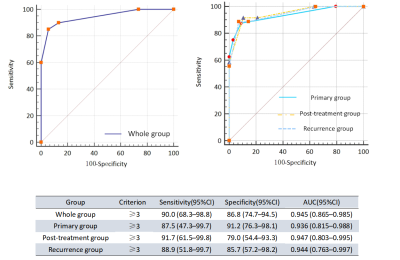
Fig. 2- Sensitivity, specificity, and AUC of VI-RADS in identifying MIBC and NMIBC for each group. AUC = area under the curve; CI = confidence interval; MIBC = muscle-invasive bladder cancer; NMIBC = non–muscle-invasive bladder cancer; ROC = receiver operating characteristics; VI-RADS = Vesical Imaging Reporting and Data System.
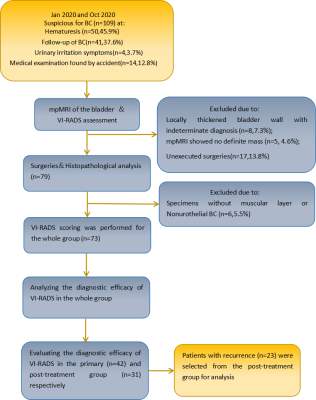
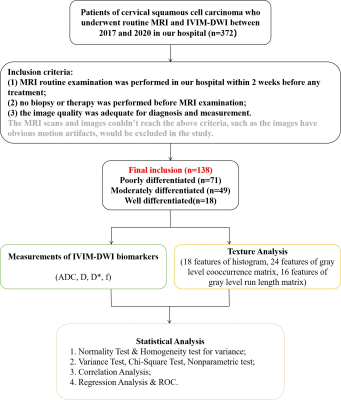
Fig. 1-Design of the study. BC= bladder cancer; mpMRI = multiparametric magneticresonance imaging; VI-RADS = Vesical Imaging Reporting and Data System.
-
Combining Volumetric ADC Histogram Analysis with Vesical Imaging Reporting and Data System to Predict the Muscle Invasion of Bladder Cancer
Shichao Li1, Ping Liang1, Yanchun Wang1, Yaqi Shen1, Xuemei Hu1, Daoyu Hu1, Xiaoyan Meng1, and Zhen Li1
1Department of Radiology, Tongji Hospital, Tongji Medical College, Huazhong University of Science and Technology, Wuhan, China
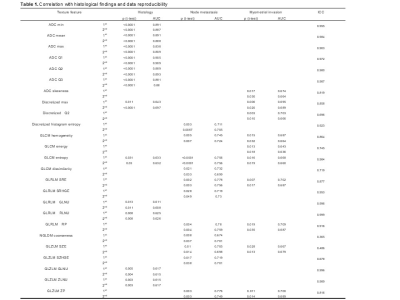
Our study demonstrated that both volumetric ADC
histogram analysis and VI-RADS can contribute to the distinguishment of muscle
invasion for bladder cancer, and the volumetric ADC histogram parameters can
provide additional value.
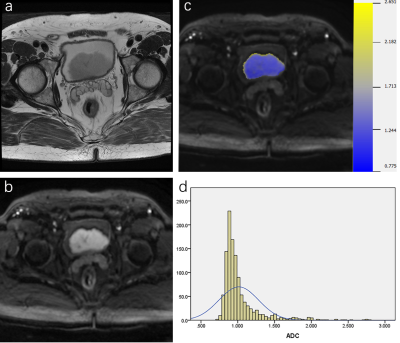
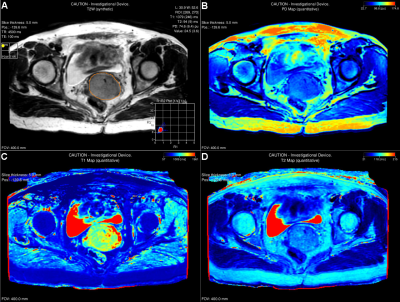
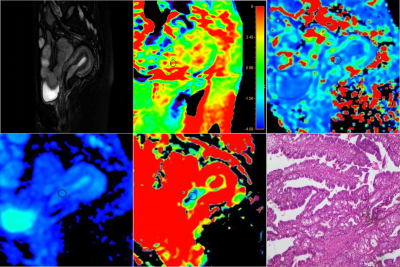
Figure 2. Muscle-invasive papillary urothelial
carcinoma in the posterior bladder wall in a 71-year-old-man. a. Axial
T2-weighted image; b. Axial DWI images; c. Corresponding
diffusion-weighted image reconstruction of ADC values (ADC values are given in
units of ×10-3 mm2/s). d. Volumetric ADC histogram
shows a large portion of voxels with low ADC values and positive skewness of
2.993 and positive kurtosis of 11.225.
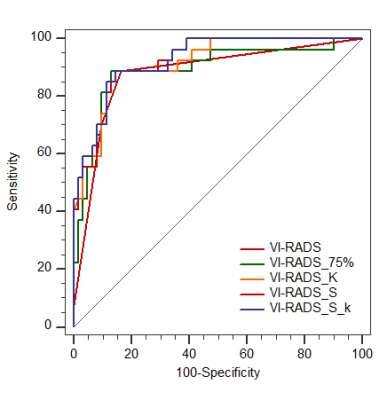
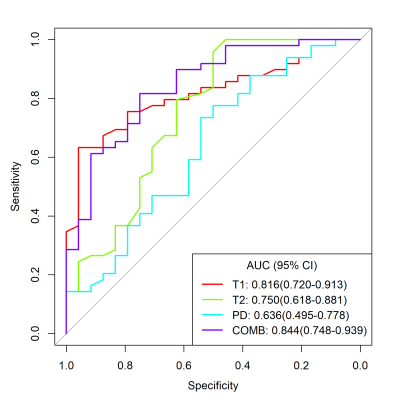
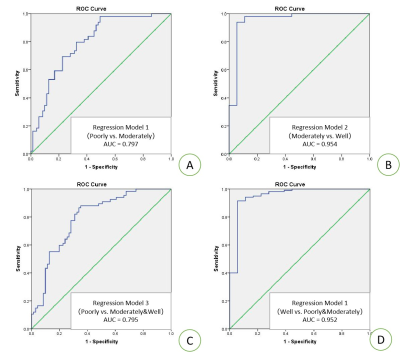
Figure 5. ROC curves of VI-RADS score combined with volumetric ADC
histogram parameters
-
Investigation of synthetic MRI applied in the evaluation of tumor grade of bladder cancer
Qian Cai1, Huan jun Wang1, Yi ping Huang1, Long Qian2, Yan Guo1, Zhi hua Wen1, Long yuan Ouyang1, and Mei qin Li1
1Department of Radiology, The First Affiliated Hospital of Sun Yat-sen University, Guangzhou, China, 2MR Research, GE Healthcare, Beijing, China
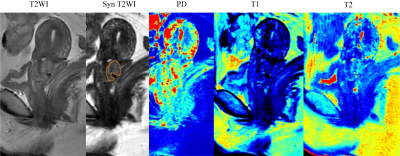
Synthetic MRI are useful in noninvasively discriminating
low- and high-grade bladder cancer.
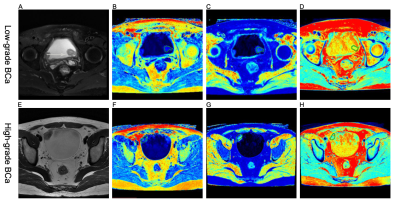
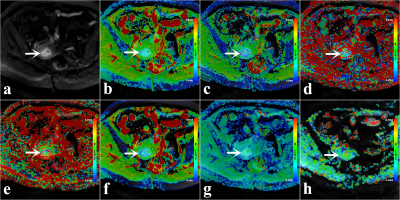
Figure 1 (A-D) A 58-year-old woman with
low-grade BCa. (A) Axial
T2-weighted image, (B-D) SyMRI-derived
pseudo-colored maps (T1, T2, and PD, respectively) indicate that the mean T1,
T2, and PD value are 27.27 msec, 26.18 msec, and 71.67 pu, respectively.
(E-H) A 31-year-old
man with high-grade BCa. (E) Axial T2-weighted image, (F-H) SyMRI-derived pseudo-colored
maps (T1, T2, and PD, respectively) indicate that the mean T1, T2, and PD value
are 32.59 msec, 19.41 msec, and 71.52 pu, respectively.
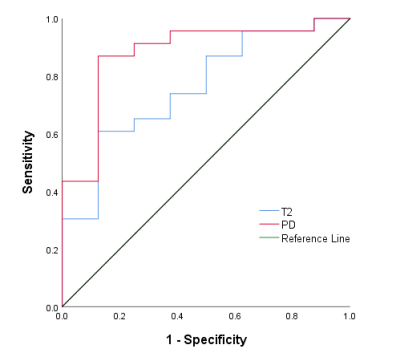
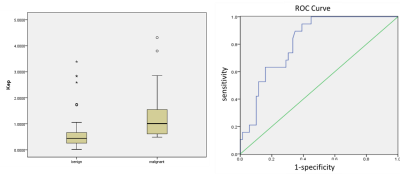
Figure 2 ROC cure analysis of the mean T2 and PD values for
differentiating low- from high-grade BCa. The area under the ROC curves for the mean T2 and PD values were 0.761,
and 0.880, respectively.
-
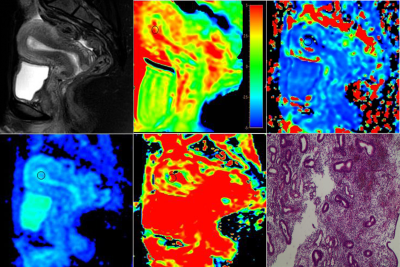
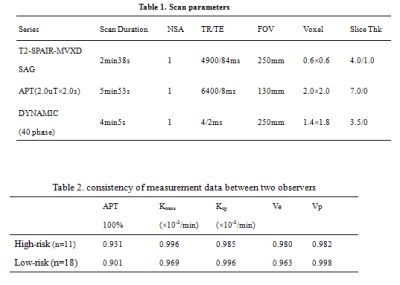
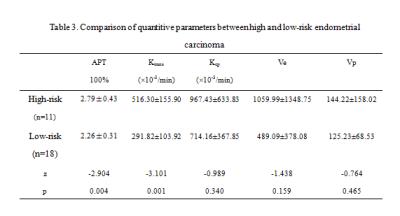
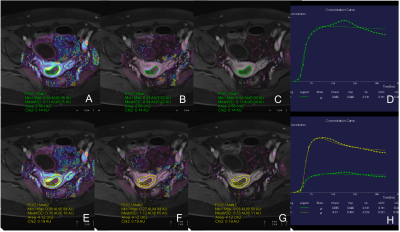
Inhibition of Urine Amide Proton Transfer Signal with Optimal Scan Parameters in Bladder Cancer
Bo Dai1, Meiyun Wang 1, Fengshan Yan1, Zhiwei Shen2, Yan Bai1, and Nan Meng1
1Henan Provincial People's Hospital, Zhengzhou, China, 2Philips healthcare, Beijing, China
In this preliminary study, we found that APTw signal increased with elevated concentrations of urea in phantoms. With the optimal scan parameters, the higher APTw contrast in bladder lesions was acquired, which is helpful to differentiate different grading of bladder cancer with APTw imaging.
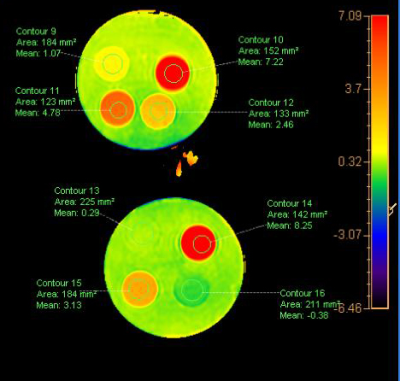
The upper four tube showed the averaged signal intensity of APTw with urea of the concentration of 2 %, 4 %, 6 %, 8 % were 1.07%, 2.46%, 4.78%, 7.22%;the lower four tubes showed in water, egg white ,a healthy volunteer and a patient with bladder cancer were -0.38% ,8.25% 3.13% and 0.29%.
-
The change of amide proton transfer (APT) signal intensity (SI) with age in testes of adults: A preliminary study
Wenhao Fu1, Yang Peng1, Guanglei Tang1, Weibo Chen2, Kan Deng3, Zhongping Zhang3, Yingjie Mei3, and Jian Guan1
1Department of Radiology, the First Affiliated Hospital of Sun Yat-Sen University, Guangzhou, China, 2Philips Healthcare, Shanghai, China, 3Philips Healthcare, Guangzhou, China
We found that APT SI of testes was positively correlated age, which
suggested that APT could be a potential biomarker for spermatogenic
function.
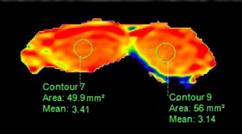
Figure 1. The APT weighted images of testes.
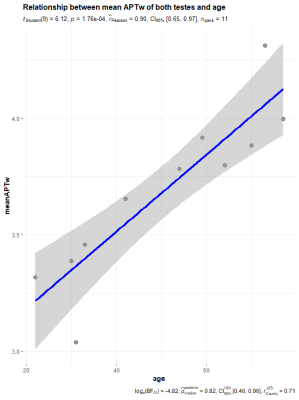
Pearson’s correlation showed a significant positive
correlation between age and the mean APT SI of both testes.
-
Improved the performance of differential diagnosis between Prostate Cancer and Benign Prostate Hyperplasia using APT and mDIXON-Quant
Xue Ren1, Ailian Liu1, Lihua Chen1, Shuang Li1, Yue Wang1, Jiazheng Wang2, Qingwei Song1, Sun Peng2, Renwang Pu3, and Yuanfei Li1
1The First Affiliated Hospital of Dalian Medical University, Dalian, China, 2Philips Healthcare, Beijing, China, 3First Affiliated Hospital of Dalian Medical University, Dalian, China
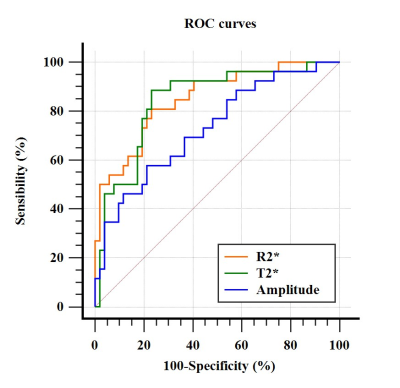
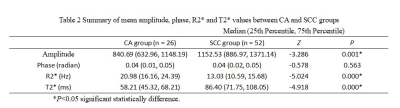
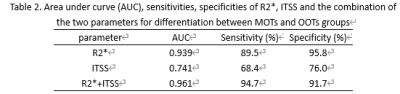
There are statistically significant differences between MTRasym and R2* between prostate cancer and prostatic hyperplasia. Higher diagnostic confidence could be achieved using APT together with mDIXON-Quant in differentiating prostate cancer and benign prostatic hyperplasia.
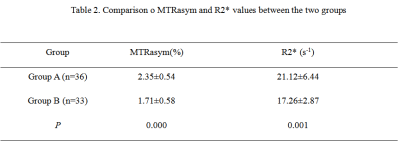
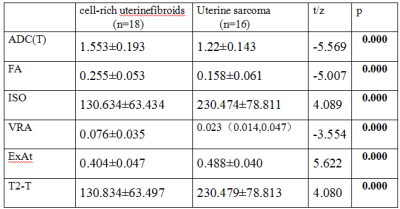
Table 2. Comparison o MTRasym and R2* values between the two groups
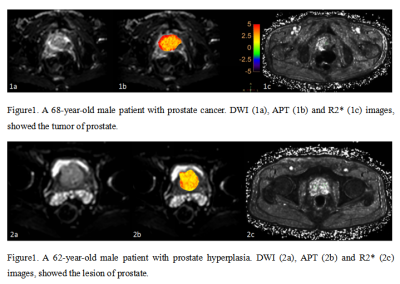
Figure1 and Figure 2
-
Four Quadrant mapping of Hybrid Multidimensional MRI data for the diagnosis of prostate cancer
Aritrick Chatterjee1,2, Xiaobing Fan1, Aytekin Oto 1,2, and Gregory Karczmar1,2
1Department of Radiology, University of Chicago, Chicago, IL, United States, 2Sanford J. Grossman Center of Excellence in Prostate Imaging and Image Guided Therapy, Chicago, IL, United States
Four Quadrant mapping
of HM-MRI data provides effective cancer markers, with cancers associated with high
PQ4, lower PQ2, and lower angle and amplitude of vectors representing cancer
voxels.
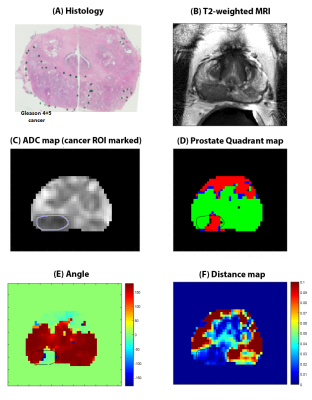
Figure 2: Representative
example of Four Quadrant mapping and associated metrics in a 60 years old
patient with Gleason 4+5 cancer in the right peripheral zone (outlined).
Histology image (A) and corresponding T2-weighted image (B), ADC map (C) with
prostate quadrant map (D), angle (E) and distance (F) are shown. Cancer is
associated with high PQ4. Vectors for cancer voxels have a lower angle (except
AFMS) and small amplitude. The cancer had
2% PQ1, 45% PQ2, 6% PQ3 and 47% PQ4 signal voxels.
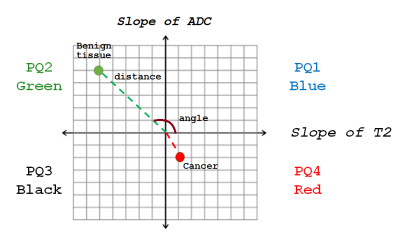
Figure 1: Four
Quadrant mapping scheme where each voxel in the prostate is a point in the 4
quadrant plot, where y = slope of ADC with varying TE, and x = slope of T2 with
varying b-value. Each voxel is associated with a distance from origin and an
angle. Benign tissue typically lies in quadrant 2 (high PQ2; green). The
distinctive property of aggressive cancers is that they have a higher
percentage of voxels in the 4th quadrant or high PQ4 (red). Cancer vectors tend
to have small amplitude and lie along the negative y axis.
-
Assessing the combined effect of bias field correction and intensity normalization of T2w images on prostate tumor probability maps
Stephanie Alley1, Uulke Van der Heide2, Cynthia Ménard3, and Samuel Kadoury1,3
1Biomedical Engineering, Polytechnique Montréal, Montréal, QC, Canada, 2Radiation Oncology, The Netherlands Cancer Institute, Amsterdam, Netherlands, 3Centre Hospitalier de l’Université de Montréal, Montréal, QC, Canada
We demonstrate that a systematic assessment of the combined effect of bias field correction and intensity normalization on T2w images leads to enhanced accuracy in tumor localization within the prostate.
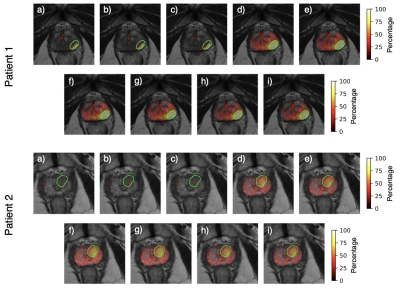
Figure 3. Tumor probability maps for two patients across all pre-processing combinations: a) None, b) N4, c) PABIC, d) N4 + basic normalization, e) PABIC + basic normalization, f) N4 + PZ normalization, g) PABIC + PZ normalization, h) N4 + histogram normalization, i) PABIC + histogram normalization.
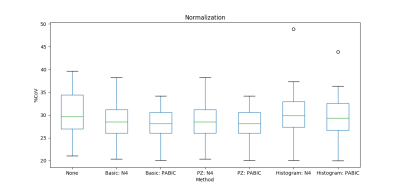
Figure 2. Normalization performance for basic, median peripheral zone (PZ), and histogram matching normalization. Percent coefficient of variation was employed as the ad hoc metric.
-
Correlation between T2 mapping and Intravoxel Incoherent Motion in Prostate cancer and Benign prostatic hyperplasia
Nila Mu1, Ailian Liu1, Lihua Chen1, Pengyun Zhang1, Yunsong Liu1, Changjun Ma1, Jiazheng Wang2, Liangjie Lin2, Qingwei Song1, and Renwang Pu1
1The First Affiliated Hospital of Dalian Medical University, Dalian, China, Dalian, China, 2Philips Healthcare, Beijing, China, Beijing, China
The T2 value was observed to be associated with parameters of IVIM except fast ADC mono in both prostate cancer and benign prostatic hyperplasia.
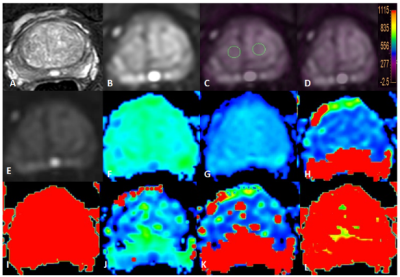
Figure 1 T2WI(A), DWI(B), fused T2 mapping and DWI (C, D) images , IVIM images as well as the derived Standard ADC, Fraction of fast ADC-mono, Slow ADC bi, and Fraction of fast ADC bi, et al maps (E-L) of a BPH patient. The placement of ROIs is as illustrated.
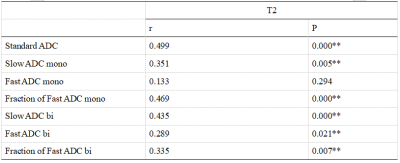
Table4CorrelationamongAPT values andthe perfusion parameters of IVIMin all patients with PCa or BPH
-
Two-stage classifier for detection of high-grade prostate cancer using quantitative MRI and radiomic features
Ethan Leng1, Joseph Koopmeiners2, Lin Zhang2, and Gregory John Metzger1
1Center for Magnetic Resonance Research, Minneapolis, MN, United States, 2School of Public Health, Division of Biostatistics, University of Minnesota, Minneapolis, MN, United States
We developed a two-stage classification model for simultaneous detection of prostate cancer on prostate MRI and localization of aggressive, high-grade PCa, using both quantitative MRI and radiomic features.
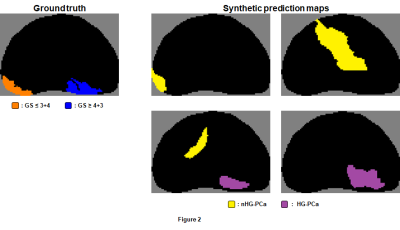
Figure 2. Four
examples of randomly-generated synthetic prediction maps corresponding to a
given ground truth map. Candidate regions in synthetic prediction maps were
labeled in the same way as demonstrated in Figure 1, and radiomic features were
extracted in the same way as they were for candidate regions of prediction maps
obtained from the first-stage voxel-wise classifier.
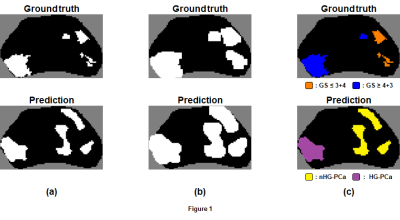
Figure 1. (a)
Sample ground truth and prediction map generated from the first-stage
voxel-wise classifier (white = PCa). (b) Image dilation applied to maps, which facilitates identification of
candidate regions in the prediction map (four in this example) via
identification of connected voxels. (c) Labeling of candidate regions based on degree of overlap with voxels
in the ground truth map. Candidate regions are labeled HG-PCa only if ≥ 50% of
voxels within the region are labeled GS ≥ 4+3.
-
Improved differential diagnosis between Prostate Cancer and Benign Prostate Hyperplasia using APT and IVIM
Lihua Chen1, Ailian Liu1, Pengyun Zhang1, Nila Mu1, Yunsong Liu1, Changjun Ma1, Jiazheng Wang2, Qingwei Song1, and Renwang Pu1
1The First Affiliated Hospital of Dalian Medical University, Dalian, China, 2Philips Healthcare, Beijing, China
There were statistic differences in the APT and IVIM parameters between prostate cancer and prostatic hyperplasia. Higher diagnostic confidence was achieved using APT together with IVIM to differentiate between prostate cancer and prostatic hyperplasia.
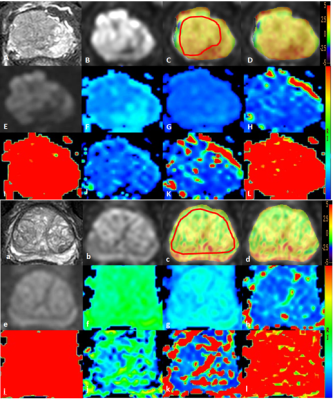
Figure 1 A 72-year-old man with PCa: T2WI image (A), DWI
image (B, the tumor was located in the right central zone), APTw image of the
prostate fused with DWI image (C, D, the placement of ROIs is as illustrated). The tumor showed the APTw value of 1.95 %. IVIM images as well as the derived maps
(E-L).
A 70-year-old man with BPH: T2WI image (a), DWI
image (b), APTw image of the prostate fused with DWI image (c, Dd, the placement of ROIs is as
illustrated). The prostate
showed the APTw value of 1.31 %. IVIM images as well as the derived maps (e-l).
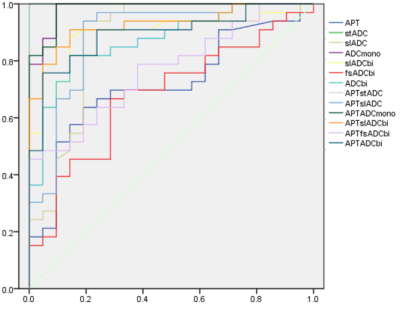
Figure 2 The ROC of all the parameters values in
differentiation of PCa and BPH.
-
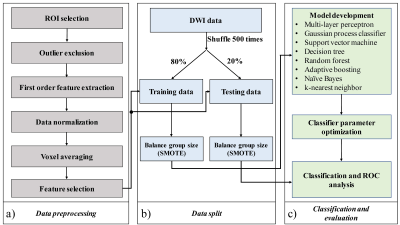
Development and validation of radiomics model for diagnosing PCar and BPH based on Diffusion weighted imaging and clinical information
Lihua Chen1, Ailian Liu1, Yan Guo2, and Xin Li2
1The First Affiliated Hospital of DaLian Medical University, Dalian, China, 2GE Healthcare, China, Beijing, China
The newly established comprehensive model is
efficient in clinical distinguishing PCa from BPH, in which the method
sketching the whole prostate gland may have a better prospect for prostate
radiomics study.
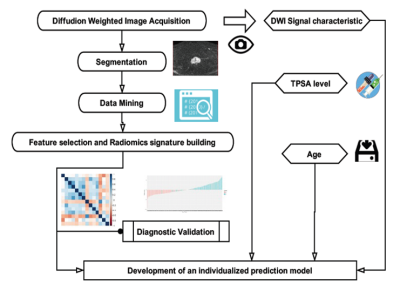
Figure 1.Workflow of the radiomics modeling
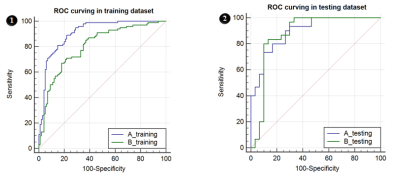
Figure 2. ROC curves in plan A&B, 6-1&6-2 were ROC
curves for training and testing dataset.
-
The Usefulness of Variable-density Stack-of-Stars Acquisition in Dynamic Gadolinium-Enhanced MRI of Prostate Cancer: A Preliminary Study
Shintaro Horii1, Yoshiko Ueno2, Yuichiro Somia1, Ryuji Shimada1, Keitaro Sofue2, Yasuyo Urase2, Wakiko Tani1, Yu Ueda3, Akiko Kusaka1, and Takamichi Murakami2
1Center for Radiology and Radiation Oncology, Kobe University Hospital, kobe, Japan, 2Department of Radiology, Kobe University Graduate School of Medicine, Kobe University Hospital, kobe, Japan, 3Philips Japan MR Clinical Science, tokyo, Japan
The
k-space weighted image contrast reconstruction with variable-density golden
angle stack-of-stars acquisition may improve image quality of high temporal
resolution DCE-MRI compared to e-THRIVE, with keeping effective pharmacokinetic
information in PCa assessment.
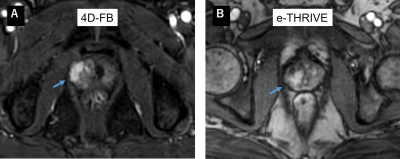
Figure.3
Clinical dynamic contrast enhanced images of 4D-FB and e-THRIVE
A.
77-year-old patient with a Gleason 7 prostate cancer, initial PSA of 4.7 ng/mL.
Early dynamic contrast enhanced image (4D-FB) shows intense enhancement in the
region of the right peripheral zone (arrow). B. 66-year-old patient with a
Gleason 7 prostate cancer, initial PSA of 8.1 ng/mL.
Early dynamic contrast enhanced image (e-THRIVE) shows enhancement in the
region of the right peripheral zone (arrow).
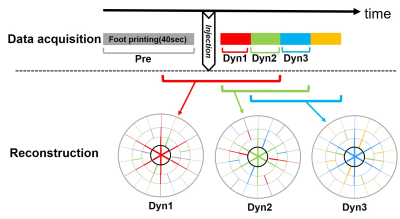
Figure.1 schematic diagram for scan date
acquisition and reconstruction in 4D -FB
-
Effectiveness of split dose of gadoterate meglumine injection using 30% and 70% of standard dose to detect prostate cancer using ultrafast DCE-MRI
Xiaobing Fan1, Aritrick Chatterjee1, Jay M Pittman1, Ambereen Yousuf1, Tatjana Antic2, Gregory S Karczmar1, and Aytekin Oto1
1Radiology, The University of Chicago, Chicago, IL, United States, 2Pathology, The University of Chicago, Chicago, IL, United States
A split dose protocol for Dotarem
injection with ultrafast DCE-MRI sampling can improve detection of prostate
cancer by improving quantitative
analysis and providing sensitivity to water exchange.
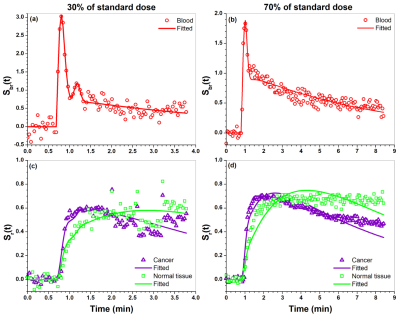
Figure 1. Plots of blood Sbr(t) (dots) obtained
from iliac artery and its EMM fits (line) for (a) 30% of standard dose and (b) 70%
dose of standard dose. (c) and (d) show plots of cancer and tissue Sr(t)
(dots) and their fits (lines) obtained from the SI-Tofts model for (c) 30% and
(d) 70% of standard dose.
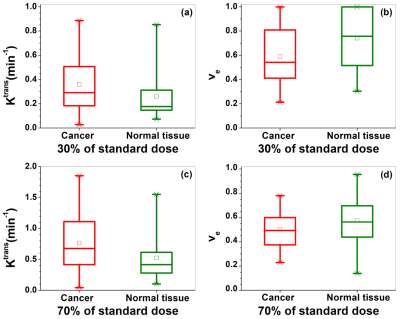
Figure 2. Box-plots of cancer (red) and
normal tissue (green) physiological parameters (a ,c) Ktrans and (b,
d) ve extracted from SI-Tofts model for the 30% (top row) and 70% (bottom
row) of standard dose DCE-MRI. The square
(□) indicates mean and the asterisks (*) indicate the upper and lower limits of
the data.
-
23Na MRI in Patients with suspected Prostate Cancer: External and Internal References for Quantification of Tissue Sodium Concentration
Anne Adlung1, Fabian Tollens2, Nadia Karina Paschke1, Jennifer Hümsch1, Niklas Westhoff3, Daniel Hausmann2,4, Lothar Rudi Schad1, Dominik Nörenberg2, and Frank Gerrit Zöllner1,5
1Computer Assisted Clinical Medicine, Medical Faculty Mannheim, Heidelberg University, Mannheim, Germany, 2Department of Radiology and Nuclear Medicine, Medical Faculty Mannheim, Heidelberg University, Mannheim, Germany, 3Department of Urology and Urosurgery, Medical Faculty Mannheim, Heidelberg University, Mannheim, Germany, 4Department of Radiology, Kantonspital Baden, Baden, Switzerland, 5Mannheim Institute for Intelligent System in Medicine, Medical Faculty Mannheim, Heidelberg University, Mannheim, Germany
This study investigates TSC quantification in the human prostate based
on internal references (iliac artery). 23Na-MRI of 19 male patients with suspected
PCa was included. No statistically significant differences were found compared
to external references.
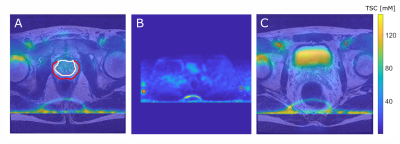
Figure 1:
A: T2w and
coregistered 23Na MRI illustrated as overlay with the TZ (white) and
the PZ (red).
B: TSC quantification based on reference vials prior to image co-registration
(method 1, vials encirecled in red).
C: Quantification based on VOIs within the
iliac artery after image co-registration to the T2w image (method 2, iliac
arteries encircled in red).
For all three images a
slice was chosen that best depicts the corresponding ROI. Images show high
intensity lines at the bottom which are artifacts that were caused by the
B1-corrections.
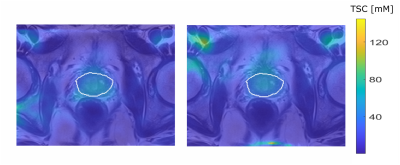
Figure 3: Quantified 23Na
MRI from one patient with a PI-RADs 5 lesion in the TZ, image focused on the prostate
region. TSC quantification based on method1 (left) and method2 (right).
-
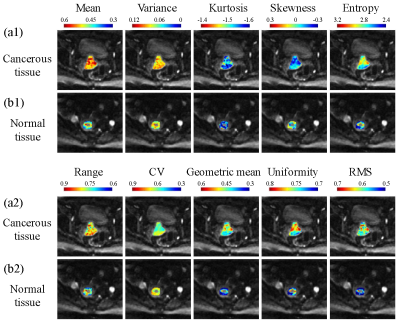
A comparison study of the value of Diffusion Kurtosis Imaging and Amide Proton Transfer imaging in the evaluation of prostate cancer
Huijia Yin1, Dongdong Wang1, Ruifang Yan1, Xuekun Li1, Kaiyu Wang2, and Dongming Han1
1MR, the First Affiliated Hospital of Xinxiang Medical University, Xinxiang, China, 2MR Research China,GE Healthcare, Xinxiang, China
In our study, the diagnostic value of DKI and APT for prostate cancer (PCa), as well as the risk assessment of PCa by using DKI and APT were analyzed. According to the results of the study, MTRasym(3.5ppm), MK and MD can be used to distinguish prostate cancer from BPH. ROC analysis showed that MK has the greatest diagnostic efficiency for PCa, which is consistent with the conclusions of other researchers. Meanwhile, these three parameters shows ability in the risk assessment of prostate cancer, which is consistent with previous research results. Our study also shows that MK and MTRasym(3.5ppm) respectively have an extremely and moderately strong positive correlation (r = 0.844, 0.640) with GS, and MD has an extremely strong negative correlation (r = -0.811) with GS. This implies that MK value has the strongest ability to predict GS of PCa, and some other researchers had the same conclusion. In summary, MK, MD and MTRasym(3.5ppm) values can be used to evaluate the potential invasion of PCa and have correlations with GS risk. In conclusion, both DKI and APT can be used to diagnose PCa and assess its risk without additional use of external contrast agent, but DKI shows better diagnostic efficiency.
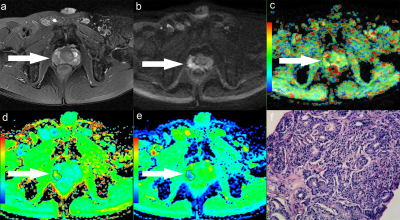
Figure.1 A 58-year-old man with PCa in right peripheral zone, GS is 8. (a) T2-weighted image shows hypointense signal in the lesion, (b) Diffusion-weighted imaging indicates hyperintense signal, (c) APT pseudo-colored map shows yellow-green pseudocolor in the lesion, (d) Mean kurtosis pseudo-colored map indicates red-yellow-green pseudocolor in the lesion, (e) Mean diffusivity pseudo-colored map shows blue-green pseudocolor in the lesion, (f) pathological image
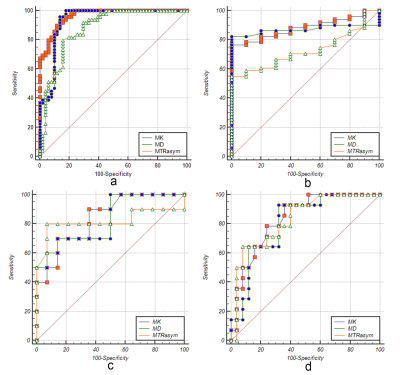
Figure.3 ROC curves of MK/MD/MTRasym(3.5ppm) values between BPH and PCa groups(a), BPH and low-risk groups (b), low-risk and intermediate-risk groups (c), intermediate-risk and high-risk groups (d), respectively.
-
A pilot study of 18F-PSMA PET/CT or PET/MRI and ultrasound fusion targeted prostate biopsy for intra-prostatic PET-positive lesions
Yachao Liu1, Hongkai Yu2, Jiajin Liu1, Xiaojun Zhang1, Mu Lin3, Holger Schmidt4, Jiangping Gao2, and Baixuan Xu1
1Department of Nuclear Medicine, Chinese PLA General Hospital, Beijing, China, 2Department of Urology Surgery, Chinese PLA General Hospital, Beijing, China, 3MR collaborations, Diagnostic Imaging, Siemens Healthcare, Shanghai, China, 4MR Education, Customer Services, Siemens Healthcare, Erlangen, Germany
18F-PSMA PET/CT-US or PET/MRI-US fusion-targeted
prostate biopsy are feasible for prostate cancer diagnosis due to its
high detection rate of clinically significant prostate cancer. PET/MR can rule
out some false PET-positive lesions, which may potentially reduce unnecessary biopsies.
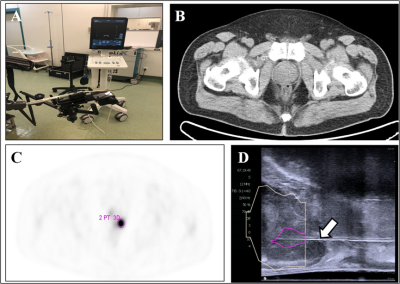
Figure 1. 18F-PSMA PET/CT-US or PET/MRI-US fusion targeted
prostate biopsy for the intraprostatic PET-positive lesions were performed (A). The
boundaries of the prostate were delineated on the CT image (B, white circle). The
PET-positive lesion was marked as the target for biopsy (C, pink circle). The previous delineated prostate and PET-positive
lesion from PET/CT was registered to the prostate volume acquired from the
3-dimensional transrectal ultrasonography; the puncture needle (D, arrow) then
reached the target biopsy area.
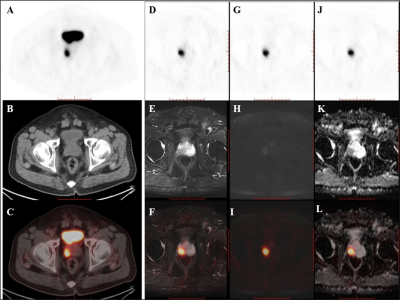
Figure 2. PET/CT
found one PET-positive lesion in the prostate gland (A: PET, B: CT, C: fused PET/CT).
PET/MRI showed short T2 signal (D: PET, E: T2WI, F: fused PET/T2WI), high DWI
signal (G: PET, H: DWI, L: fused PET/DWI), and a decreased ADC value at the
site of the PET-positive lesion (J: PET, K: ADC map, L: fused PET/ADC map). The
subsequent pathology confirmed prostate cancer.
-
Head-to-head comparison of PSMA-PET/CT and ferumoxtran-10-enhanced MRI for the diagnosis of lymph node metastases in prostate cancer patients
Melline Gabrielle Maria Schilham1, Patrik Zamecnik1, Bas Israel1, Bastiaan Privé1, Mark Rijpkema1, Jelle Barentsz1, James Nagarajah1, Martin Gotthardt1, and Tom Scheenen1
1Medical Imaging, Radboudumc, Nijmegen, Netherlands
Nano-MRI identifies significantly
more small suspicious lymph nodes compared to PSMA-
PET/CT in the same patient.
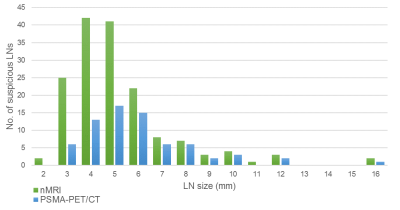
Size distribution of suspicious lymph nodes as
detected by nanoparticle-enhanced MRI (green) and prostate-specific membrane
antigen PET/CT (blue).
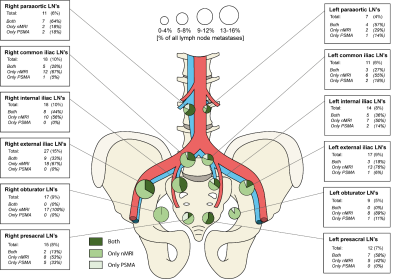
FIGURE 3. Anatomic distribution of identified suspicious lymph nodes as
detected by nanoparticle-enhanced MRI and prostate-specific membrane antigen
PET/CT.