Optimized Sampling & Sequence Design
Acq/Recon/Analysis Thursday, 20 May 2021
Digital Poster
4165 - 4183
4184 - 4202

Oral Session - Optimized Sampling & Sequence Design
Acq/Recon/Analysis
Thursday, 20 May 2021 18:00 - 20:00
  • B-spline Parameterized Joint Optimization of Reconstruction and K-space Sampling Patterns (BJORK) for Accelerated 2D Acquisition
    Guanhua Wang1, Tianrui Luo1, Jon-Fredrik Nielsen1, Jeffrey A. Fessler2, and Douglas C. Noll1
    1Biomedical Engineering, University of Michigan, Ann Arbor, MI, United States, 2Electrical Engineering and Computer Science, University of Michigan, Ann Arbor, MI, United States
    The proposed model, BJORK, provides a robust and generalizable workflow to jointly optimize non-Cartesian sample patterns and physics-informed reconstruction. Results demonstrate improved image quality compared with previous trajectory optimization methods.
    Figure 1. Diagram for the proposed approach.

    Figure 5. (a) displays the scanning protocols. Radial-like corresponds to the undersampled radial trajectory, SPARKLING trajectory initialized with the undersampled radial trajectory, and BJORK trajectory initialized with the undersampled radial trajectory. (b) showcases one example from the in-vivo experiment. The first row is the CS-based reconstruction and the second row is the unrolled neural network-based reconstruction. For fully-sampled data, conjugate phase reconstruction is displayed.

  • Accelerated Ultrahigh Temporal-Resolution MRI with Random k-Space Undersampling
    Qingfei Luo1, Zheng Zhong1,2, Kaibao Sun1, and Xiaohong Joe Zhou1,2,3
    1Center for MR Research, University of Illinois at Chicago, Chicago, IL, United States, 2Department of Bioengineering, University of Illinois at Chicago, Chicago, IL, United States, 3Departments of Radiology and Neurosurgery, University of Illinois at Chicago, Chicago, IL, United States
    The scan time of epi-SPEEDI was reduced by ~50% without degrading imaging quality by using random k-space undersampling and image reconstruction based on joint spatiotemporal partial separability and sparsity constraints.
    Fig. 4. Dynamic cardiac valve images acquired using epi-SPEEDI (A) and epi-SPEEDI-kt (B). Each image corresponds to a specific time point during the aortic valve movement process. The temporal resolution was 0.6 ms. Images 6-30 show the opening status of cardiac valve (annotated by the yellow arrow) and the cardiac valve is closed in the other images. The red arrows indicate artifacts.
    Fig. 2. Comparison of phase-encoding schemes used in epi-SPEEDI and epi-SPEEDI-kt sequences (A) and the k-space sampling pattern in epi-SPEEDI-kt (B). Nnav phase lines (yellow lines) in the central k-space (kc) region are sampled in all the time blocks (TBs) while the outer k-space (ko) regions are randomly and sparsely sampled (green lines). The k-space sampling patterns are the same at the echoes in one TB but different between TBs.
  • ECcentric Circle ENcoding TRajectorIes for Compressed-sensing (ECCENTRIC): A fully random non-Cartesian sparse k-space sampled MRSI at 7 Tesla
    Antoine Klauser1,2,3, Bernhard Strasser2,4, Wolfgang Bogner4, Lukas Hingerl4, Claudiu Schirda5, Bijaya Thapa2, Daniel Cahill6, Tracy Batchelor7, François Lazeyras1,3, and Ovidiu Andronesi2
    1Radiology and Medical Informatics, University of Geneva, Geneva, Switzerland, 2Athinoula A. Martinos Center for Biomedical Imaging, Department of Radiology, Massachusetts General Hospital, Harvard Medical School, Boston, MA, United States, 3CIBM Center for Biomedical Imaging, Geneva, Switzerland, 4High‐Field MR Center, Department of Biomedical Imaging and Image‐guided Therapy, Medical University of Vienna, Vienna, Austria, 5Department of Radiology, University of Pittsburgh, Pittsburgh, PA, United States, 6Department of Neurosurgery, Massachusetts General Hospital, Harvard Medical School, Boston, MA, United States, 7Department of Neurology, Brigham and Women, Harvard Medical School, Boston, MA, United States
    We presented a new trajectory: ECCENTRIC that enables the acquisition of high-resolution MRSI without temporal interleaving and with random sparse sampling of the Fourier domain for unrestricted axial brain coverage, which has high potential for clinical applications.
    Sketch of the FID-ECCENTRIC sequence. 4-pulses WET water suppression precedes the excitation pulse. After the excitation, cartesian encoding along z-axis and gradient ramp along x and y axes are played before the acquisition simultaneous to the sinusoidal gradient waveform. Right, the parametrization of the circle position and the Fourier domain trajectory of ECCENTRIC for a 64x64x9 encoding matrix.
    Choline (Cho), total NAA (tNAA) and ratio maps resulting from ECCENTRIC FID-MRSI acquisition performed on a brain tumor patient. Results from retrospective acceleration AF=2 and AF=3 show that the tumor lesion and contrast was preserved through acceleration. Spectra from the tumor location (1) and healthy tissue (2) are shown for all AFs. Bottom left, histograms of the Cramer-Rao Lower Bound (CRLB) for tNAA and Cho LCModel fit from the entire slab are presented.
  • Faster fetal whole-heart anatomical and blood flow 4D cine MRI with k-t SWEEP
    Thomas A Roberts1, Laurence H Jackson1, Joshua FP van Amerom2, Alena Uus1, Anthony N Price1, Johannes K Steinweg1, David FA Lloyd1,3, Milou PM van Poppel1, Kuberan Pushparajah3, Mary A Rutherford1, Reza Razavi1,3, Maria Deprez1, and Joseph V Hajnal1
    1Biomedical Engineering Department, School of Biomedical Engineering and Imaging Sciences, King's College London, London, United Kingdom, 2Division of Pediatric Cardiology, The Hospital for Sick Children, Toronto, ON, Canada, 3Department of Congenital Heart Disease, Evelina Children's Hospital, London, United Kingdom
    We combine k-t SENSE with a SWEEP excitation to perform faster fetal whole-heart anatomical and blood flow 4D cine MRI. In combination with self-calibrated k-t methods, this framework paves the way for development of comprehensive clinical 4D fetal whole heart MRI in under five minutes.
    Figure 3: Movie showing every fourth image frame from a k-t SWEEP acquisition acquired in a fetus aged 30+2 weeks gestational age.The k-t SWEEP acquisition smoothly sweeps across the field-of-view (compare against the k-t M2D movie in Fig 2). In the k-t SWEEP data a stable signal is reached after an initial transient period, which manifests as noisy, fluctuating image frames at the beginning of the movie. Note: image quality not fully representative of scan quality due to the need for extreme gif compression.
    Figure 1: Simulations of M2D and SWEEP [6] acquisition schemes. In both, the same number of images are acquired and coverage in the z-direction is equivalent. For the M2D acquisition (A), multiple dynamics are acquired for each slice z-location. (B) For each slice, 100s of RF pulses are required before the steady-state signal is reached. With SWEEP, (C) the excitation frequency of the RF pulse is slowly linearly increased resulting in a gradually shifting slice profile across the FOV. (D) After the initial transient period, a stable signal results throughout the rest of the acquisition.
  • SPRING-RIO TSE: 2D T2-Weighted Turbo Spin-Echo Brain Imaging using SPiral RINGs with Retraced In/Out Trajectories
    Zhixing Wang1, Steven Allen1, Xue Feng1, John P. Mugler2, and Craig H. Meyer1
    1Biomedical Engineering, University of Virginia, Charlottesville, VA, United States, 2Radiology & Medical Imaging, University of Virginia, Charlottesville, VA, United States
    This study presents a new approach to 2D TSE imaging using annular spiral rings with a retraced in/out trajectory, dubbed “SPRING-RIO TSE”, for fast, high-quality, T2-weighted brain imaging with higher scan efficiency and reduced SAR, when compared with Cartesian TSE imaging.
    Figure 4. Comparison of in-vivo images acquired using the proposed SPRING-RIO TSE method and standard Cartesian TSE. From top to bottom are trajectory- and off-resonance-corrected images from SPRING-RIO TSE with one signal average and with two signal averages, and images from standard Cartesian TSE. The red arrows point to structures where residual signal loss or artifacts exist, likely due to strong susceptibility, concomitant gradients or flow effects. The white circles indicate the spots where the image contrast is visually better in SPRING-RIO TSE than that in Cartesian TSE.
    Figure 1. Pulse sequence diagram showing the sampling strategy, which includes fat saturation, field-map acquisition, and data acquisition using annular spiral rings. The center of k space is sampled by a self-retraced spiral in-out arm. The spiral-in rings in the orange box are designed to cover the outer k space, while the spiral-out rings in the blue box retrace the corresponding spiral-in rings. The refocusing RF pulse angles are set to 150° for reducing SAR.
  • Rapid T2-DIADEM Echo-Planar Imaging as an Alternative to T2-FSE: A Clinical Feasibility Study
    Myung-Ho In1, Norbert G Campeau1, John III Huston1, Zijing Dong2,3, Kawin Setsompop4,5, Daehun Kang1, Uten Yarach6, Yunhong Shu1, Joshua D Trzasko1, and Matt A Bernstein1
    1Department of Radiology, Mayo Clinic, Rochester, MN, United States, 2A. A. Martinos Center for Biomedical Imaging, Department of Radiology, Massachusetts General Hospital, Charlestown, MA, United States, 3Department of Electrical Engineering and Computer Science, MIT, Cambridge, MA, United States, 4Department of Radiology, Stanford University, Stanford, CA, United States, 5Stanford University, Stanford, CA, United States, 6Department of Radiologic Technology, Faculty of Associated Medical Sciences, Chiang Mai University, Chiang Mai, Thailand
    DIADEM, a variant of multi-shot EPI, was optimized and evaluated as a high-speed alternative to T2-FSE in 24 subjects. Overall T2-DIADEM performed well relative to T2-FSE in terms of resolution and contrast, but suffered more from flow related artifacts, signal dropout and Gibbs ringing.
    Figure 2 Imaging sequences of T2-FSE and T2-DIADEM (A) and corresponding images (B). The flow compensation gradients on the DIADEM sequence are shown in red-colors in (A). For demonstration purpose, four slices among 38 are shown in (B).
    Figure 3. Advantages of T2-DIADEM over T2-FSE: T2-DIADEM provides better depiction of internal details of left temporal lobe multi-cystic lesion (a), falx calcifications (white arrows in b), small T2 hyperintensities (c). T2-DIADEM identifies small developmental venous anomaly, as demonstrated in MPRAGE (green arrows in b)
  • Spiral Cardiac bSSFP with Phase-Modulation to Enable Long Repetition Times
    Michael Schär1
    1Radiology, Johns Hopkins University School of Medicine, Baltimore, MD, United States
    Phase-modulated bSSFP cine imaging with long repetitions times is demonstrated with spiral readouts and spectral-spatial water-only excitation. Signal pileup from blood flowing out of the slice is shown to be reduced with pre-saturation modules.
    Figure 3: (Animated gif, please click) Mid-ventricular short-axis cine acquired with phase-modulated bSSFP with BIPS and a long TR of 15ms enabling more efficient spiral readout and water-only excitation pulses. 60 cardiac frames were reconstructed with an in-plane resolution of 2.2mm; images from frequency bins were combined with RMS.
    Figure 5: Diastolic cine frames in short-axis orientation (A,C) and orthogonal to right coronary artery (B,D) acquired with conventional Cartesian bSSFP (A,B) or the proposed phase-modulated bSSFP with BIPS method (C,D). Yellow arrows point to dark band artifacts in conventional bSSFP, and green arrows point at the coronary arteries that are obstructed by Indian ink artifacts in conventional bSSFP without fat suppression. Images from frequency bins were combined with complex sum and deblurred.
  • Echo-train bSSFP for Rapid Golden-angle Radial Sampling
    Kaibao Sun1, Zheng Zhong1,2, Kezhou Wang1, and Xiaohong Joe Zhou1,2,3
    1Center for MR Research, University of Illinois at Chicago, Chicago, IL, United States, 2Department of Bioengineering, University of Illinois at Chicago, Chicago, IL, United States, 3Departments of Radiology and Neurosurgery, University of Illinois at Chicago, Chicago, IL, United States
    A novel echo-train golden-angle radial bSSFP sequence, together with an integrated phase-correction algorithm, has been developed to provide scan time reduction by 36% without noticeable degradation of image quality in phantoms and the human brain.
    Figure 1: (a): A section of an ETGAR-II sequence consisting of two repetition times (TRs or shots). Blue, yellow and green gradients are the readout gradient pulses in the echo train. Red and purple gradients are the steering gradient pulses. Brown gradients are for phase-rewinding, as required by bSSFP. (b): k-Space trajectory of the sequence segment in (a). The dashed curves illustrate the effect of the steering gradient pulses or the rewinding gradient pulses on the k-space trajectory. The k-space rotation angle between two consecutive TRs is set to golden angle (111.24…°).
    Figure 5: Human brain images obtained with single-echo golden-angle radial bSSFP (left) and ETGAR-II bSSFP with (middle) and without (right) phase corrections. With echo-train bSSFP, the scan time was reduced by 36% without substantial reduction in image quality as compared to single-echo bSSFP. In the middle image, the susceptibility/banding artifacts were slightly elevated in the frontal area (red arrow) due to the increased sensitivity to off-resonance in echo-train acquisitions.
  • A whole-blade turboPROP technique with motion correction for rapid and robust DWI
    Zhiqiang Li1, Melvyn B Ooi2, and John P Karis1
    1Neuroradiology, Barrow Neurological Institute, Phoenix, AZ, United States, 2Philips Healthcare, Gainesville, FL, United States
    A whole-blade turboPROP was developed to increase the blade width, and consequently the scan speed by a factor of ~2, relative to the original turboPROP. Increased blade width also enables robust motion correction. In vivo data demonstrate advantages over ssEPI, msEPI, and SPLICE-PROPELLER.
    Fig. 4. (a) compares overall image quality of 4 techniques and (b) shows a special case in the presence of metal. In (a), ssEPI shows strong signal pileup, which is reduced but still present in msEPI. Signal pileup is minimized in turboPROP (with slight signal drop off) and SPLICE-PROPELLER. SNR of turboPROP is much better than SPLICE-PROPELLER, while slightly lower than but still close to msEPI. (b) shows images from a volunteer with a surgical patch that causes signal pile up in ssEPI and msEPI, which is not visible in turboPROP. T2 TSE is acquired as reference
    Fig. 5. Capability of motion correction with turboPROP. Image quality of both msEPI (left column) and turboPROP (middle column) are degraded by rigid body motion. With motion correction (including both PROPELLER motion correction of each source image and image registration between diffusion directions), the motion artifacts can be minimized (right column, same raw data as the middle column).
  • Fast and quiet 3D MPRAGE using a silent gradient axis - sequence development
    Edwin Versteeg1, Sarah M. Jacobs1, Ícaro A.F. Oliveira2, Dennis W.J. Klomp1, and Jeroen C.W. Siero1,2
    1Radiology, University Medical Center Utrecht, Utrecht, Netherlands, 2Spinoza centre for neuroimaging Amsterdam, Amsterdam, Netherlands
    In this work, we implemented a silent readout module that applies a silent gradient axis (driven @20kHz) to a 3D MPRAGE sequence. The resulting sequence featured a 26 dB reduction in peak sound level and comparable image contrast and scan time compared to a conventional 3D MPRAGE-scan.
    Figure 3: Representative slices of the whole brain MPRAGE scans. Note that the same windowing is used for all images, which highlight the similar contrast between the conventional (top row) and quiet scan (bottom row). A slight misalignment between anatomy might be visible due to subject movement.
    Figure 4: Part of the sound measurement used to estimate the sound levels. Here, three shots of the MPRAGE-scans are displayed. Top: the audio signal from the microphone after A-weighting. Bottom: the calculated sound pressure levels (dB(A) and fast time weighting) for each shot.
Back to Top
Digital Poster Session - Pulse Sequence II
Acq/Recon/Analysis
Thursday, 20 May 2021 19:00 - 20:00
  • High-resolution, low-SAR 3D T2 relaxometry with COMBINE
    Peter J Lally1, Matthew Grech-Sollars2,3, Joely Smith3,4, Ben Statton5, Paul M Matthews1,6, Karla L Miller7, and Neal K Bangerter4
    1Department of Brain Sciences, Imperial College London, London, United Kingdom, 2Department of Surgery and Cancer, Imperial College London, London, United Kingdom, 3Department of Imaging, Imperial College Healthcare NHS Trust, London, United Kingdom, 4Department of Bioengineering, Imperial College London, London, United Kingdom, 5MRC London Institute of Medical Sciences, London, United Kingdom, 6UK Dementia Research Institute Centre at Imperial College, London, United Kingdom, 7Wellcome Centre for Integrative Neuroimaging, Nuffield Department of Clinical Neurosciences, University of Oxford, Oxford, United Kingdom
    Here we describe a super-resolution 3D T2 relaxometry approach using an unbalanced SSFP acquisition with very low flip angle RF pulses (α≤1°), and apply this in a phantom. The proposed approach provides new options for high-resolution, low-SAR T2 relaxometry experiments in a range of tissues.
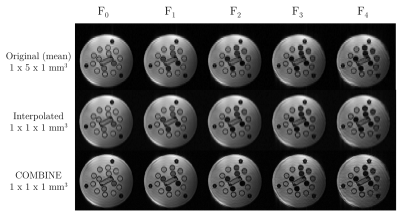
    Figure 4: Top) Mean low-resolution images (1x5x1mm3) for each of the different F-states in the T2-COMBINE acquisition (TR=8ms, TE=4ms, α=1°). Centre) Bicubic interpolation of the mean low-resolution images (top) to a nominal voxel size of 1mm isotropic. Bottom) Corresponding COMBINE reconstruction to a nominal voxel size of 1mm isotropic.
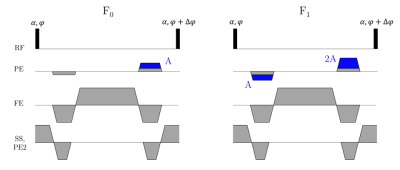
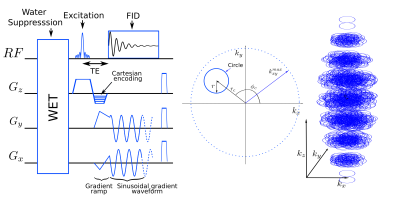
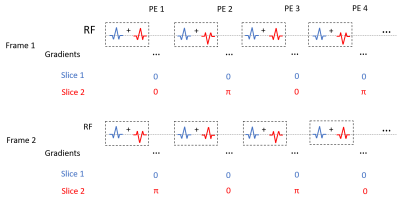
    Figure 2: Schematic of the pulse sequence for the T2-COMBINE experiment. Higher order F-states are reached by adding integer increments of the unbalanced gradient area (denoted A) either side of the readout.
  • Radial Fast Spin Echo MRI with Compressed Sensing for Simultaneous ADC and T2 Mapping
    Lars Bielak1,2, Thomas Lottner1, and Michael Bock1,2
    1Dept.of Radiology, Medical Physics, Medical Center University of Freiburg, Faculty of Medicine, University of Freiburg, Freiburg, Germany, 2German Cancer Consortium (DKTK), Partner Site Freiburg, Freiburg, Germany
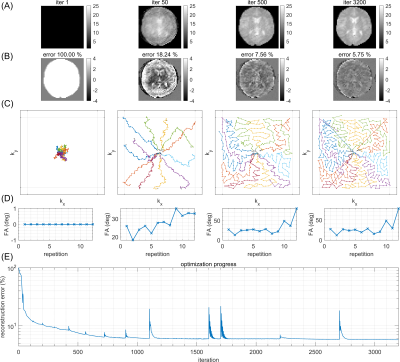
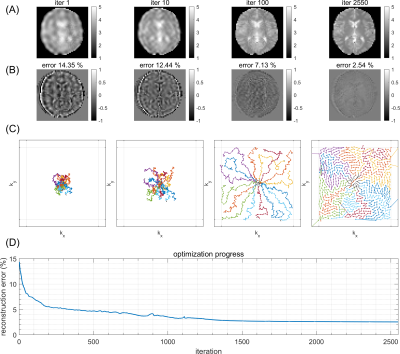
    A novel sequence design and reconstruction for simultaneous ADC and T2 mapping is presented. Simulations and phantom measurements show accurate measurement of diffusion ADC and T2 with as few as 11 spokes per TE, and 45 different TEs.
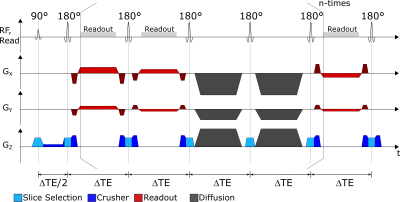
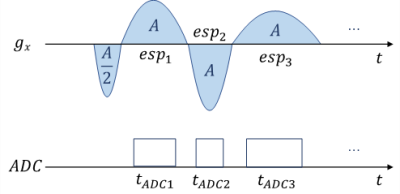
    Sequence diagram of the proposed sequence. It employs standard radial FSE readouts, interleaved with diffusion blocks. The diffusion blocks can be placed after arbitrary numbers of readout blocks. The figure shows one diffusion block after 2 readout blocks each. For simulation and measurements, we use a combination of 3 readout blocks and one diffusion block (not shown).
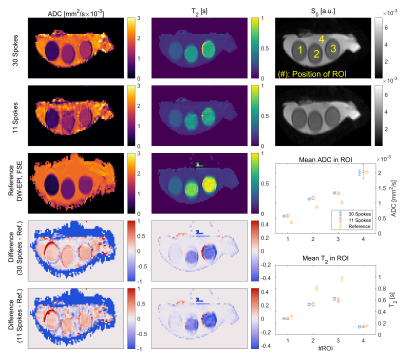
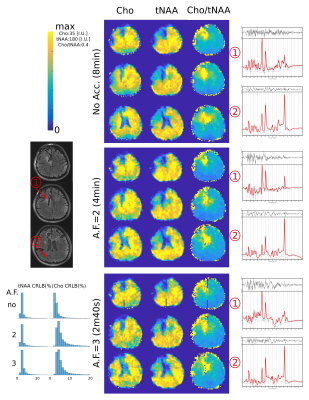
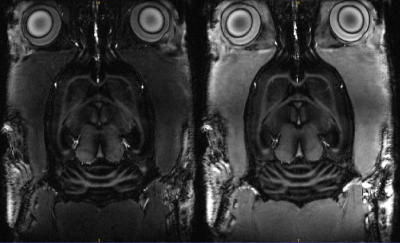
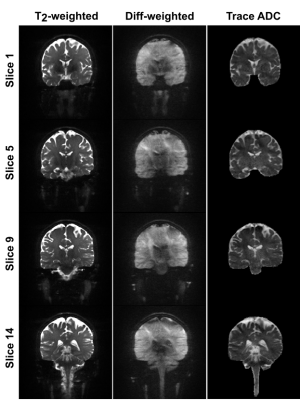
    Results of the phantom measurement. The left column shows ADC values, the middle column shows T2 values. The first two rows show the reconstruction result for different number of spokes per ΔTE-b-pair (30 and 11 spokes). The third row shows reference measurements using conventional DW-EPI and FSE sequences. Rows 4 and 5 show corresponding difference images. The two plots on the bottom right show a ROI based analysis for all cases. The position of the ROI is indicated in the top right plot.
  • T2 Quantification in Brain Using Three Dimensional Fast Spin Echo Imaging with Long Echo Trains
    Jeff Snyder1 and Alan H Wilman1
    1Biomedical Engineering, University of Alberta, Edmonton, AB, Canada
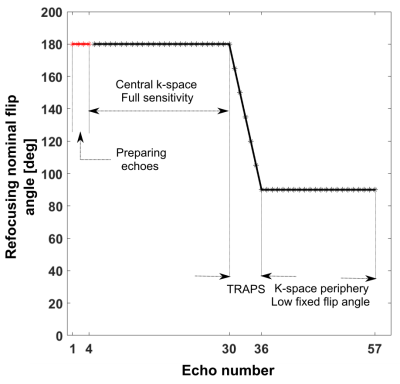
    A 3D FSE method using long echo trains is proposed for quantification of T2 in brain with mapping based on Bloch equation and Echo Phase Graph (EPG) simulations.  Echo train lengths of 96 and 192 were investigated (total scan times of 8:12 and 2:38) at 3 T, with isotropic resolutions of 0.9 and 1.3 mm3.
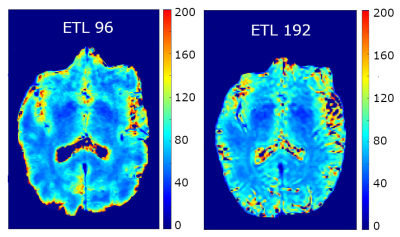
    T2 maps for the ETL = 96 (left) and ETL = 192 (right) variable flip angle trains computed from the two echo times of 6 and 132 ms. Noise is more visible in the 192 case. Note that the slice for the 192 case is slightly offset from the 96 case due to the difference in resolution (0.9 mm3 vs 1.3 mm3)
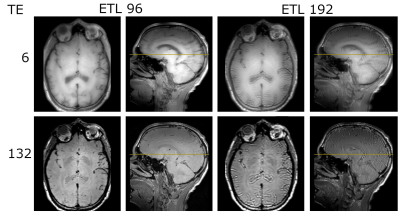
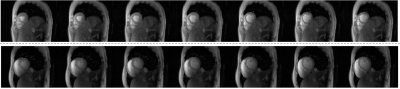
    Images acquired using the proposed echo trains (left four images – 96, and right four – 192). The top row are all images at TE = 6 ms, and the bottom is at TE = 132 ms. Axial and sagittal views are shown for each combination of TE and train length.
  • Improved echo-split GRASE imaging: a single-shot parametric T2 mapping protocol with removal of contamination from multiple echo pathways
    Mei-Lan Chu1, Tzu-Cheng Chao2, Nan-kuei Chen3, and Hsiao-Wen Chung1
    1Graduate Institute of Biomedical Electronics and Bioinformatics, National Taiwan University, Taipei, Taiwan, 2Mayo Clinic, Rochester, MN, United States, 3University of Arizona, Tucson, AZ, United States
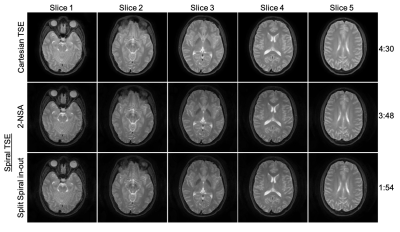
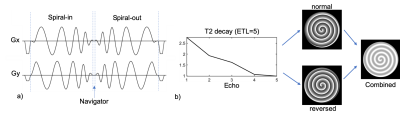
    Our novel single-shot T2 mapping framework removes signal contamination of high-order echoes and reliably generate accurate T2 relaxation times.
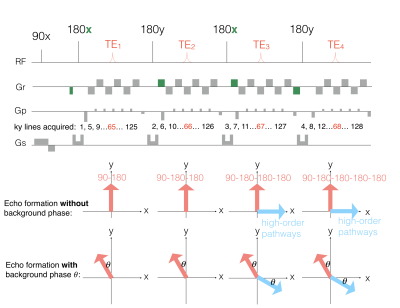
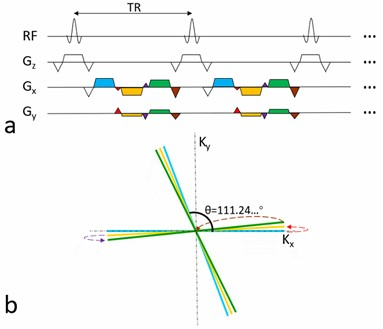
    The single-shot ES-GRASE sequence. The areas and polarities of prewinding and rewinding gradients (i.e. the green gradient) of the readout gradient are designed to remove high-order echo pathways. The alternating direction of the refocusing RF pules (i.e. 180x-180y-180x-180y) can generate 90° phase difference between the primary and residual high-order echo pathways. The phase difference is 90+2𝜃° when the background phase is involved.
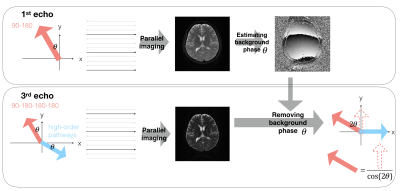
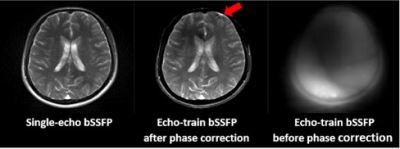
    Data preprcessing frameowrk: First, images of four echoes were reconstructed using parallel imaging techniques, and the N/2 ghost was removed using phase cycling method. Second, the background phase was estimated from the first-echo image (see the upper panel). Third, rotating the signal from the third and fourth echo with the estimated background phase . The real part of the rotated signal is only from the signal of the primary echo pathway, with which the primary echo signal can be calculated by basic Trigonometry (see the lower panel in which only the third echo is shown as an example).
  • T2-Shuff-LL: Multi-contrast 3D Shuffling Combining Fast Spin-Echo and Look-Locker Gradient Echo
    Jonathan Tamir1,2,3, Ken-Pin Hwang4, Naoyuki Takei5, and Suchandrima Banerjee6
    1Electrical and Computer Engineering, The University of Texas at Austin, Austin, TX, United States, 2Diagnostic Medicine, Dell Medical School, The University of Texas at Austin, Austin, TX, United States, 3Oden Institute for Computational Engineering and Sciences, Austin, TX, United States, 4Imaging Physics, MD Anderson Cancer Center, Houston, TX, United States, 5MR Applications and Workflow, GE Healthcare, Hino, Tokyo, Japan, 6MR Applications and Workflow, GE Healthcare, Menlo Park, CA, United States
    We propose a 3D shuffled multi-contrast acquisition combining multi-echo spin-echo and inversion-recovery spoiled gradient echo. As the acquisition is sensitive to T1 and T2, multi-contrast and quantitative images can be recovered from a single scan.
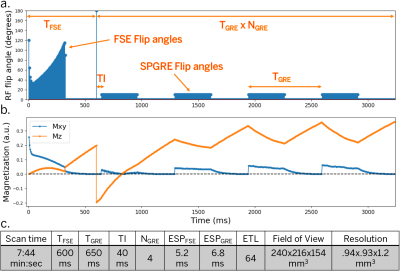
    Figure 1. EPG Simulation and scan parameters. (a) RF flip angles (90-degree excitation not shown). (b) Transverse and longitudinal magnetization for T1=1600 ms, T2=80 ms (after arriving at a stable equilibrium magnetization). (c) Scan parameters for simulation and phantom experiments. The first acquisition block uses an FSE train with non-selective variable refocusing flip angles and a fast recovery tip-up pulse. After an adiabatic inversion pulse, a series of SPGRE blocks are played in sequence.
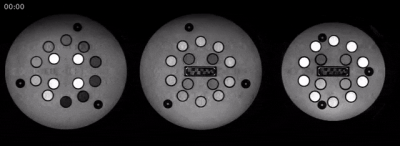
    Figure 4. Animated gif of the reconstructed time series of images at three different slices in the ISMRM-NIST phantom, corresponding to the three plates of contrast spheres. In total, a time series of 300 images are reconstructed.
  • Clinical Evaluation of Isotropic MAVRIC-SL at 3T
    Zoe Doyle1, Daehyun Yoon 1, Philip Lee1, Brian Hargreaves1, and Kathryn Stevens1
    1Stanford University, Stanford, CA, United States
    Our fast isotropic 3D MSI technique can facilitate the improved visualization of post-operative complications at 3T MRI by enabling the generation of clinically useful reformats in arbitrary imaging planes.
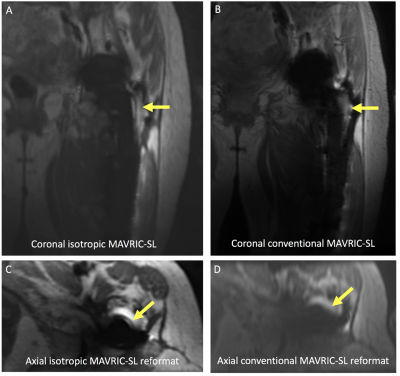
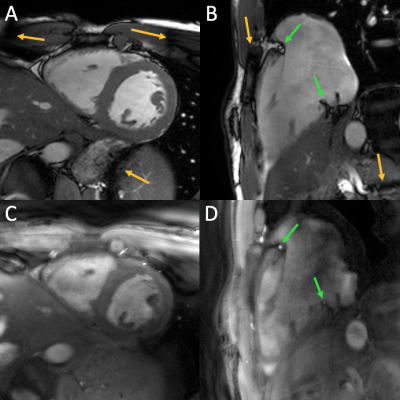
    Fig 2. (A,B) Coronal and (C,D) axial reformatted images of a painful left revision total hip replacement in a 61-year-old female demonstrating abnormal signal adjacent to the lateral aspect of the femoral component on isotropic images (arrow). However, this abnormality cannot be seen on conventional MAVRIC SL images, despite the overall image quality being graded higher. Signal abnormality corresponded to fluid on inversion recovery sequences, confirming loosening (not shown).
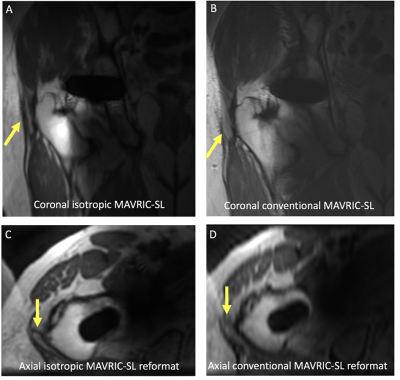
    Fig 3. (A,B) Coronal and (C,D) axial reformatted images of a painful right total hip replacement in a 73-year-old male. A discrete trochanteric fluid collection is present (arrow), but is less well seen on conventional MAVRIC SL, particularly along the superior margin. Axial reformatted images confirm the presence of a trochanteric fluid collection, but the collection is less well seen on an axial reformatted conventional MAVRIC SL image (arrow).
  • Can we achieve a better performance in metamaterial-assisted MRI combined to an SLR-based fast spin-echo sequence?
    Ekaterina A. Brui1, Stanislas Rapacchi2, David Bendahan2, and Anna Andreychenko1,3
    1Department of Physics and Engineering, ITMO University, Saint Petersburg, Russian Federation, 2Aix-Marseille Universite, CNRS, Centre de Résonance Magnétique Biologique et Médicale, Marseille, France, 3Center of Diagnostics and Telemedicine Technologies, Department of Health Care of Moscow, Research and Practical Clinical, Moscow, Russian Federation
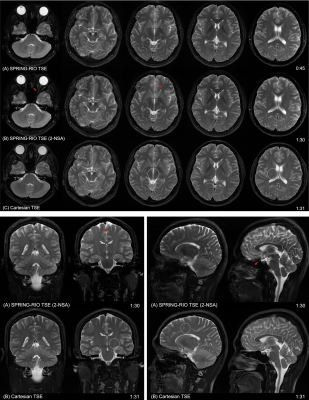
    SLR-based FSE together with the metamaterial-based coil for wrist MRI allowed to increase the slice selectivity while still being within the safe SAR limits. The actual energy deposition was decreased as compared to a conventional RF setup.
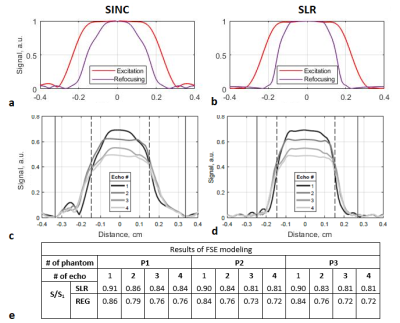
    Excitation (red curves) and refocusing (purple curves) profiles of regular pulses (a), which are used by default in 1.5 T Siemens Magnetom Avanto scanner for FSE in "Low SAR" mode, and of the constructed SLR pulses (b) for a sample with neglected relaxation. Refocusing profiles of four echo signals obtained in steady-state FSE modeling with regular pulses (c) and SLR pulses (d) (T1 = 329 ms). Black dashed vertical lines indicate the desired slice thickness (TH), black solid vertical lines indicate the entire refocused area of profiles (TH1). (c) Selectivity metric (S/S1) in FSE modeling.
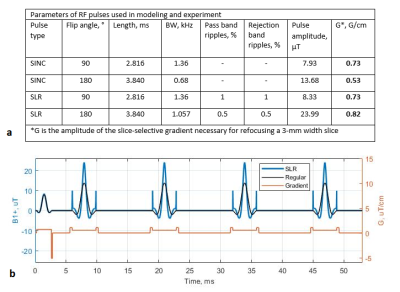
    (a) Parameters of RF pulses used in modeling and experiment. (b) The evolution in time of RF amplitudes (black and blue curves for regular and SLR-based FSE, respectively) and slice selection gradient amplitudes with crushers (orange curve) that were generated. An additional crusher gradient was applied in the end of the cycle (not shown), in order to fully spoil the transverse magnetization. The parameters of the pulse sequence: repetition/echo time TR/TE = 550/13 ms, excitation angle α = 90°, refocusing angle β = 180°, inter-echo time IET = 13 ms, echo train length ETL = 4.
  • Combined Echo Two-Point Dixon method for high efficiency water/fat separation
    Shi Cheng1, Kun Zhou1, Wei Liu1, and Dehe Weng1
    1Siemens Shenzhen Magnetic Resonance Ltd., Shenzhen, China

    An imaging method utilizing two pairs of fast-switching bipolar readout gradients and partially-opposed-phase and in-phase Dixon (CETD) is proposed to further reduce dead time. The novel steps in joint reconstruction of the two pairs ensure the consistency of water-fat separation.

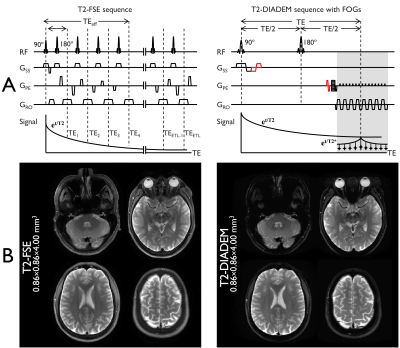
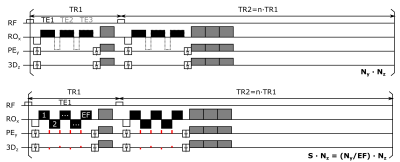
    Figure 1. The diagram in one echo spacing of the TSE Dixon method (a) and proposed combined echo two-points Dixon sequence (b). The dead time is marked with diagonal stripes, where no data sampling happens. In the proposed method, the dead time is reduced. Note that E1 and E4 are partially opp-phase echoes, while E2 and E3 are partially in-phase echoes.
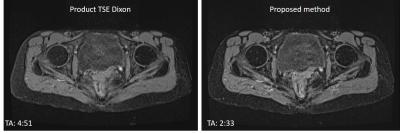
    Figure 4. Water images of a volunteer acquired with product TSE Dixon (left) and combined echo two-points Dixon (right). SNR and image quality are comparable.
  • Neuronal current imaging on clinical whole body scanners: capabilities and limitations
    Milena Capiglioni1, Claus Kiefer2, and Roland Wiest1
    1Institute for Diagnostic and Interventional Neuroradiology, Support Center for Advanced Neuroimaging (SCAN), University of Bern, Bern, Switzerland, 2Institute for Diagnostic and Interventional Neuroradiology, Support Center for Advanced Neuroimaging (SCAN), Inselspital, Bern, Bern, Switzerland
    We detected oscillating fields in the nT range using a new Spin lock based contrast. This study takes a further step towards the use of neuronal current imaging in clinical applications.
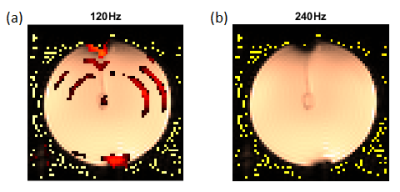
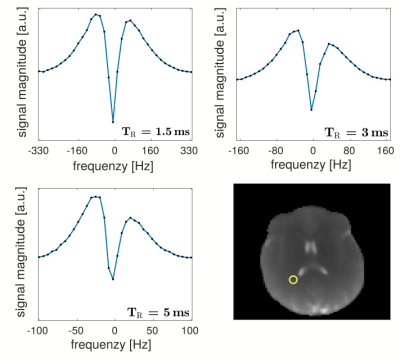
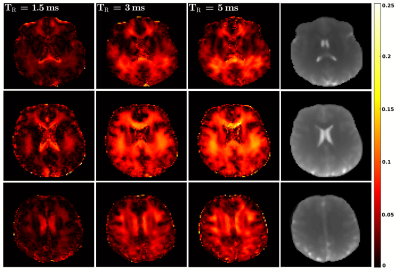
    Figure 5: Double resonance effect at two different frequencies of the Spin locking (a) 120 Hz and (b) 240 Hz. For both images, the frequency of the applied current was set at 120 Hz and the amplitude was calculated by the Biot-Savart law to be approximately 10 nT. To facilitate the visualization of the results, the rest of the deconvolution between SL on and SL off is displayed.
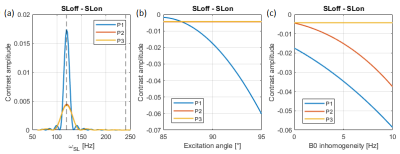
    Figure 3: Bloch simulation of the behaviour of the three SL approaches showed in Figure 1. a) Contrast as a function of the SL frequency for homogeneous fields. b) Contrast in resonance (120 Hz) for the three approaches as a function of the excitation angle, where the variation is induced by B1 inhomogeneity. c) Contrast in resonance (120 Hz) for the three approaches as a function of the off resonant frequency induced by B0 inhomogeneity.
  • Quantifying lactate using double quantum filtered 1H MRS with adiabatic refocusing pulses at 7 T
    Fabian Niess1, Albrecht Ingo Schmid1, Graham Kemp2, Ewald Moser1, Maxim Zaitsev1, and Martin Meyerspeer1
    1High Field MR Center, Center for Medical Physics and Biomedical Engineering, Medical University Vienna, Vienna, Austria, 2Department of Musculoskeletal & Ageing Science, Institute of Life Course and Medical Sciences, University of Liverpool, Liverpool, United Kingdom
    Double quantum filtered 1H MRS using adiabatic refocusing pulses at 7 T was successfully implemented. Fibre orientation-dependent quantification of lactate in meat for four different, clinically relevant angles relative to B0 was demonstrated.
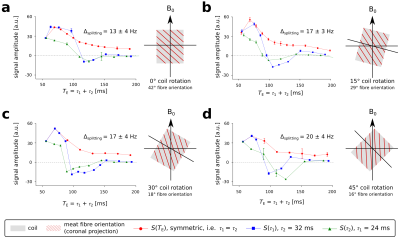
    Integrated signal area of the lactate doublet at 1.3 ppm as a function of the echo time (TE = τ1 + τ2). The coloured lines represent different combinations of τ1 and τ2 to achieve the effective TE with either τ1 = τ2 (red), holding τ2 constant (blue) or τ1 constant (green). The measurements were repeated with four different orientations of the RF coil (grey box) relative to the main magnetic field (0° to 45°) with estimated fibre orientations ranging from 42° to 16° (projections to the coronal plane hatched in red).
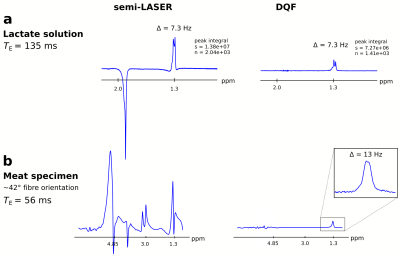
    Averaged 1H MR spectra (n = 30, TR = 3 s) acquired using semi-LASER (left) and with the adiabatically refocused DQF acquisition scheme (right). Spectra were acquired from (a) lithium lactate solution in a spherical phantom (d = 160 mm, 96mM LiLac in H2O) and (b) sodium lactate (60 %) injected into a pork meat specimen. Only lactate is visible (at 1.3 ppm) in spectra from both experiments with a peak splitting of 7.3 Hz for lactate in solution and 13 Hz for lactate injected in meat.
  • Increasing three-dimensional coverage of dynamic speech magnetic resonance imaging
    Riwei Jin1, Zhi-pei Liang1, and Bradley P. Sutton1
    1University of Illinois Urbana-Champaign, Champaign, IL, United States
    We increase the 3D coverage of dynamic speech MRI to 32 slices with 96 mm full thickness with 1.875×1.875× 3mm and temporal resolution of 35 fps by applying sparsly sampled navigators and Partial-Separability model which makes us approahing isotropic resolution with full vocal tract.
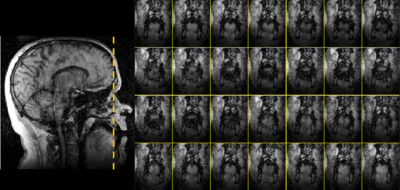
    Figure 3 Coronal images of mid-tongue region in 28 frames (about 0.8s) of subject counting ‘Four’
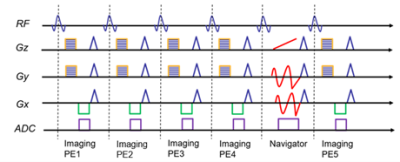
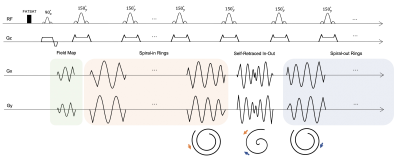
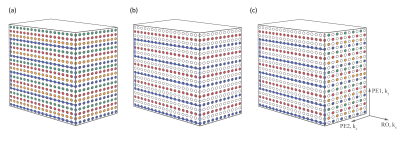
    Figure 1. A simplified pulse sequence diagram illustrating (k, t)-space sampling patterns. The navigator dataset is acquired using a spiral trajectory and is only acquired once every 4 imaging data acquisitions. The imaging dataset is acquired using a Cartesian trajectory with random phase and slice encoding to provide structural quality images.
  • Multi-Slice 2D pTx Readout-Segmented Diffusion-Weighted Imaging Using Slice-by-Slice B1+ Shimming
    Sydney Nicole Williams1, Iulius Dragonu2, Patrick Liebig3, and David A. Porter1
    1Imaging Centre of Excellence, University of Glasgow, Glasgow, United Kingdom, 2Siemens Healthcare Ltd., Frimley, United Kingdom, 3Siemens Healthineers, Erlangen, Germany
    We demonstrate slice-by-slice pTx shimming in a multi-slice readout-segmented diffusion-weighted sequence at 7 tesla. Slice-by-slice shimming is simple and efficient while greatly improving flip-angle homogeneity compared to volumetric-shimming and single-transmit.
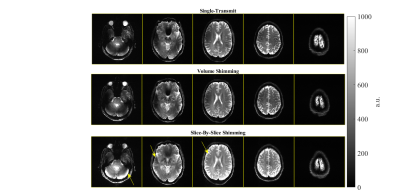
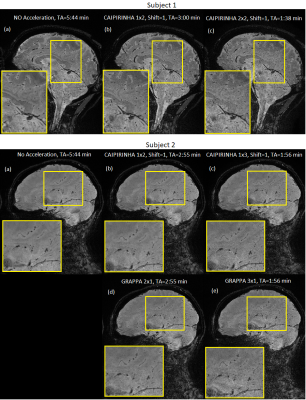
    Figure 4. Experimental readout-segmented 2D images in a healthy subject: Top row) single-transmit, Middle row) volumetric-B1+ shimming, and Bottom row) slice-by-slice B1+ shimming. The arrows highlight a few areas where slice-by-slice shimming mitigates the B1+ inhomogeneity particularly well compared to single-transmit and volumetric-shimming. Meanwhile, there is a global improvement in the column 4 slice. Each column of slice images are windowed the same.
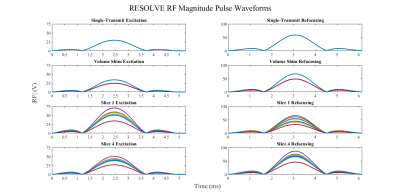
    Figure 2. Magnitude RF waveforms in volts for 8 transmit channels, excitation pulse on the left and refocusing pulse on the right. Top row) single-transmit waveforms (all channels same magnitude with incremental 45° phase offset); Second row) volumetric-shim waveforms (in this case, the shimmed solution alternated between two magnitude values on all channels); Third row) slice 1 shim waveforms; Fourth row) slice 4 shim waveforms.
  • Simultaneous Measurements of Low-b Spin-Echo and High-b Stimulated-Echo DWI for Ultrahigh-b DWI
    Kyle Jeong1, Noel Carlson2, John Rose3, and Eun-Kee Jeong4
    1Utah Center for Advanced Imaging Research, University of Utah, Salt Lake City, UT, United States, 2NeuroImunology and NeuroVirology, University of Utah, Salt Lake City, UT, United States, 3Neurology, University of Utah, Salt Lake City, UT, United States, 4Radiology and Imaging Sciences, University of Utah, Salt Lake City, UT, United States
    DWSE and DWSTE were successfully combined for ultrahigh-b DWI of CSC imaging. The combined data set provides reliable signal-b curves for further quantitative analysis. The imaging time was only 6 min for 21 slices, bmax of 9781 and 3240 s/mm2 with 13 and 7 b-values for rDWI and aDWI, respectively.
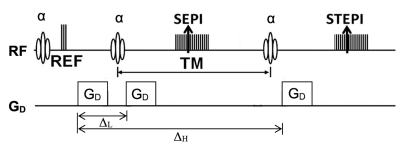
    Fig. 1. Pulse sequence diagram of DW-SESTE with the flipangle α and amplitude GD and duration δ of the diffusion gradients.
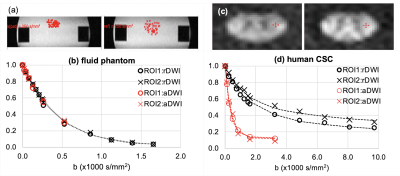
    Fig. 2. (a, c) ROI (red dots and crosses) and (b, d) signal-b curves of UHb-DWI. Signal-b curves were fit to a single-exponential function for the phantom data in (b) and human aDWI data (red O, X)) in (d), and a double-exponential function for human rDWI data (black O, X) in (d).
  • Simultaneous T1, T2 and T2* Mapping of the Carotid Plaque Using Combined Single- and Multi-echo 3D Golden Angle Radial Acquisition
    Yajie Wang1, Yishi Wang2, Haikun Qi3, Rui Guo4, Huiyu Qiao1, Dongyue Si1, and Huijun Chen1
    1Center for Biomedical Imaging Research, Department of Biomedical Engineering, School of Medicine, Tsinghua University, Beijing, China, 2Philips Healthcare, Beijing, China, 3School of Biomedical Engineering and Imaging Sciences, King's College London, London, United Kingdom, 4Department of Medicine, Beth Israel Deaconess Medical Center and Harvard Medical School, Boston, MA, United States
    A new quantitative technique using combined single- and multi-echo 3D golden angle radial acquisition for simultaneous T1, T2 and T2* mapping of the carotid plaque has been demonstrated to have good quantitative accuracy and in-vivo feasibility.
    Figure 
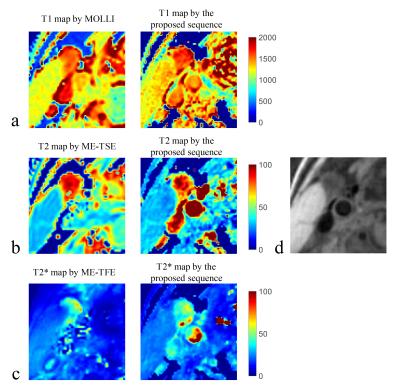
3. Quantitative mapping results of one healthy volunteer (male, 30 years). (a) T1 maps estimated by modified Look-Locker inversion recovery (MOLLI) and the proposed sequence; (b) T2 maps estimated by multi-echo tubor spin echo (ME-TSE) and the proposed sequence; (c) T2* maps estimated by multi-echo turbo field echo (ME-TFE) and the proposed sequence; (d) vessel wall image reconstructed from the proposed sequence.
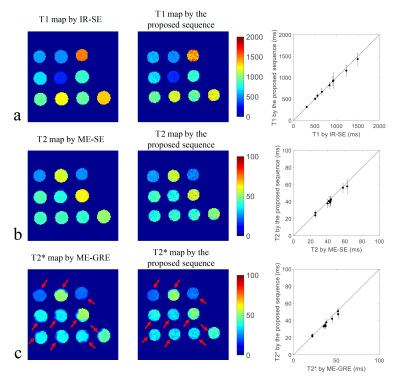
    Figure 2. Quantitative mapping results of the phantom. (a) T1 maps estimated by inversion recovery spin echo (IR-SE) and the proposed sequence with quantitative comparison (mean and SD); (b) T2 maps estimated by multi-echo spin echo (ME-SE) and the proposed sequence with quantitative comparison (mean and SD); (c) T2* maps estimated by multi-echo gradient echo (ME-GRE) and the proposed sequence with quantitative comparison (mean and SD).
  • Optimization of Magnetization Transfer Contrast for EPI FLAIR Brain Imaging
    Serdest Demir1, Bryan Clifford2, Thorsten Feiweier3, Tom Hilbert4, Zahra Hosseini5, Augusto Lio Goncalves Filho1, Azadeh Tabari1, Wei-Ching Lo2, Maria Gabriela Figueiro Longo1, Michael Lev1, Pamela Schaefer1, Otto Rapalino1, Kawin Setsompop6, Berkin Bilgic6, Stephen Cauley6, Susie Huang1, and John Conklin1
    1Radiology, Massachusetts General Hospital, Boston, MA, United States, 2Siemens Medical Solutions, Boston, MA, United States, 3Siemens Healthcare GmbH, Erlangen, Germany, 4Siemens Healthcare AG, Lausanne, Switzerland, 5Siemens Medical Solutions, Atlanta, GA, United States, 6Radiology, A. A. Martinos Center for Biomedical Imaging, Massachusetts General Hospital, Boston, MA, United States
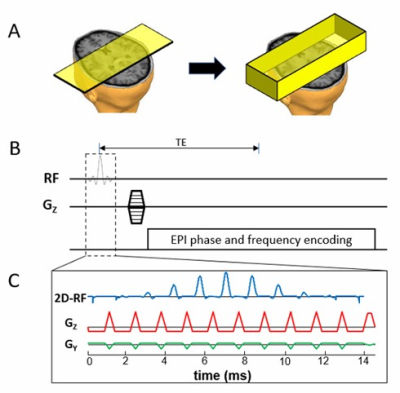
    EPI FLAIR images have lower tissue contrast than TSE FLAIR images due to the absence of significant MT effects. We demonstrate that an optimized MT-prepared EPI FLAIR acquisition can achieve equivalent tissue contrast to conventional TSE FLAIR images.
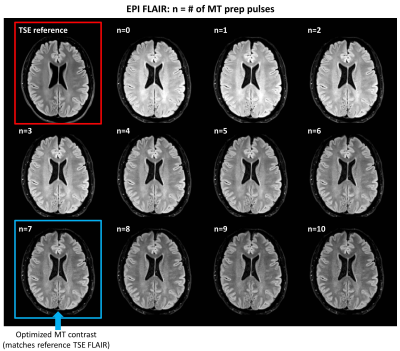
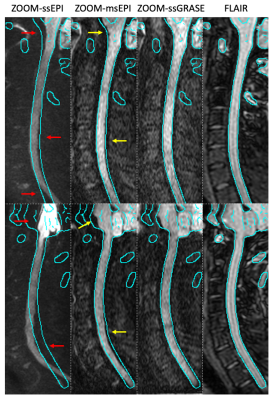
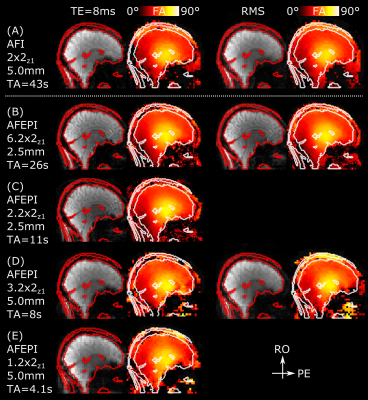
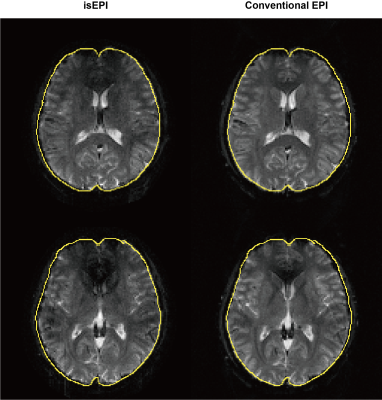
    Figure 2. Representative images showing the effect of additional magnetization preparation pulses (f=1200 Hz, a=1.0) on EPI FLAIR contrast compared to the clinical reference TSE FLAIR scan (top left). Optimal EPI FLAIR contrast (i.e., most closely matching the TSE reference scan) was achieved with 7 preparation pulses (see Figure 4 for quantitative evaluation).
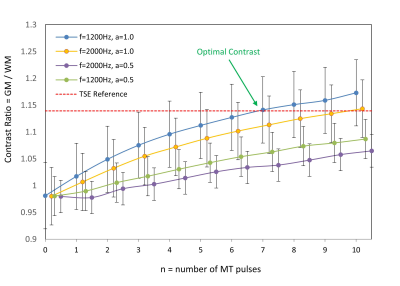
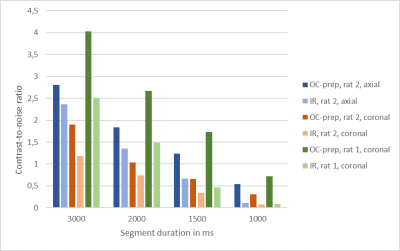
    Figure 4. Contrast ratio for EPI FLAIR images (defined as average GM / WM signal) as a function of the number of MT preparation pulses (n), resonance offset (f), and pulse amplitude (a). Contrast ratio for the TSE reference scan is shown by the dashed red line. Optimal contrast (i.e., most clostly matching the TSE reference contrast) was achieved with n=7, f=1200Hz, and a=1.0.
  • A Short TR Adiabatic Inversion Recovery Zero Echo Time (STAIR-ZTE) Sequence with Interleaved Encoding and a Modulated RF Pulse for Myelin Imaging
    Hyungseok Jang1, Yajun Ma1, Michael Carl2, Saeed Jerban1, Roland Lee1, Eric Y Chang1,3, Jody Corey-Bloom1, and Jiang Du1
    1University of California, San Diego, San Diego, CA, United States, 2GE Healthcare, San Diego, CA, United States, 3Veterans Affairs San Diego Healthcare System, San Diego, CA, United States
    In this study, we investigated feasibility and efficacy of the proposed STAIR-ZTE sequence for direct volumetric myelin imaging in human brain, which may provide an MR biomarker for diagnosis and monitoring of demyelinating disorders.  
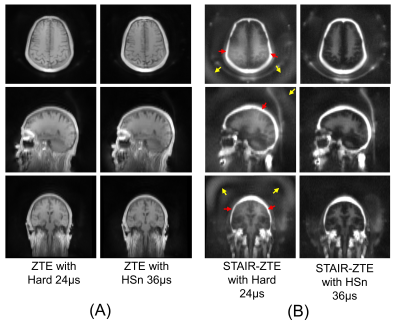
    Figure 3. Efficacy of HSn pulse (47-year-old male). (A) ZTE imaging without IR and (B) STAIR-ZTE. A regular ZTE does not show a dramatic difference between images with a hard pulse and an HSn pulse because the excitation bandwidths of both hard and HSn pulses are broad enough to include the targeted region. STAIR-ZTE shows dramatic improvement with an HSn pulse, where the low frequency signal bias (yellow arrows) affecting myelin contrast (red arrows) is well suppressed. With suppression of long T2 signals, the remaining myelin signal becomes much lower and prone to imaging artifacts.
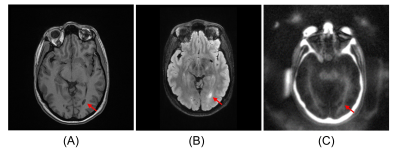
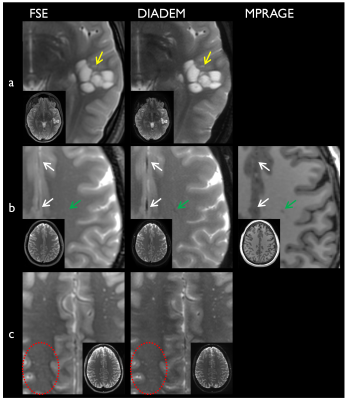
    Figure 5. A representative MS patient (22-year-old female). (A) MP-RAGE, (B) FLAIR, and (C) STAIR-ZTE. STAIR-ZTE delineates a demyelinated lesion which corresponds well with the clinical MP-RAGE and FLAIR images (red arrows).
  • Knee osteochondral junction imaging using a 3D dual adiabatic inversion recovery ultrashort echo time cones (3D DIR-UTE-cones) sequence at 3T
    Alecio F. Lombardi1,2, Zhao Wei1, Hyungseok Jang1, Saeed Jerban1, Lillian Gong1, Jiang Du1, Eric Y. Chang1,2, and Ya-Jun Ma1
    1Radiology, University of California, San Diego, CA, United States, 2Radiology Service, Veterans Affairs, San Diego, CA, United States
    The 3D-DIR-UTE-Cones sequence can produce high-resolution and high-contrast imaging of the OCJ region of the knee in vivo and shows more efficient subchondral bone marrow fat suppression compared to the IR-FS-UTE Cones sequence.
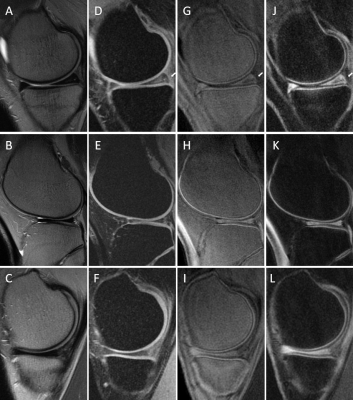
    Figure 3. T2w-FSE (A, B, C), FSPGR (D, E, F), 3D IR-FS-UTE Cones (G, H, I), and 3D DIR-UTE-Cones (J, L, M) performed in knees of two healthy volunteers (the first row represent the first volunteer). On T2w-FSE and FSPGR, the signal in the OCJ region cannot be detected due to its fast signal decay. (G-I) 3D IR-FS-UTE Cones sequences highlighting the OCJ and suppressing SC and subchondral bone. (J-L) 3D DIR-UTE-Cones sequences also highlight the OCJ but with better subchondral bone fat suppression.
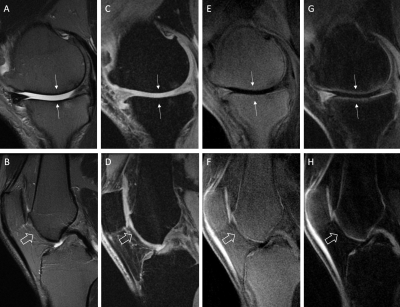
    Figure 4. T2w-FSE (A, B), FSPGR (C, D), 3D IR-FS-UTE Cones (E, F), and 3D DIR-UTE-Cones (G, H) performed in the knees of two patients with osteoarthritis. (Arrows in A, C, E, G) show interruption of the bright-line representing OCJ on the weight-bearing surface of the medial femoral condyle and medial tibial plateau in the first patient and on the femoral trochlea in the second patient (open arrows in B, D, F, H). The 3D IR-UTE-FS Cones sequences (G and H) are more efficient in suppressing the subchondral bone fat than the 3D IR-FS-UTE Cones (E, F).
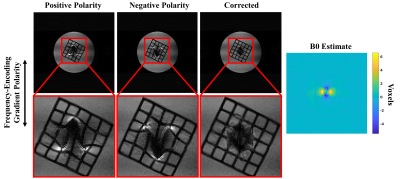
  • Phantom validation of a novel user-configurable ultrashort echo time (UTE) sequence
    Lumeng Cui1, Emily J. McWalter1,2, Gerald R. Moran3, and Niranjan Venugopal4
    1Division of Biomedical Engineering, University of Saskatchewan, Saskatoon, SK, Canada, 2Department of Mechanical Engineering, University of Saskatchewan, Saskatoon, SK, Canada, 3Research Collaboration Manager, Siemens Healthcare Limited, Oakville, ON, Canada, 4Department of Radiology, University of Manitoba, Winnipeg, MB, Canada
    The UTE sequence developed allows for 2D and 3D acquisitions, choice of trajectory, off-resonance artifact reduction, RF pulse choice and long T2 species suppression, as such it is a flexible tool that can be used and optimized for many UTE applications.
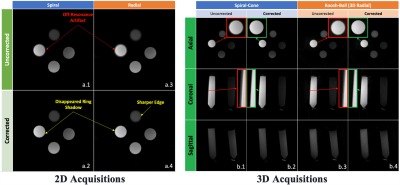
    Figure 2. The off-resonance artifact improved with the deblurring algorithm in both the 2D Spiral (a.1-2) and the 2D Radial (a.3-4) acquisitions. The off-resonance artifact improved with the deblurring algorithm in both the 3D Spiral-cone (b.1-2) and 3D Radial (“Koosh-Ball”) (b.3-4) acquisitions. The red and green enlargements in figure b highlight the comparison before and after the correction in 3D. Beginning from the top and going clockwise, the vials contain rubber, water, agar and oil.
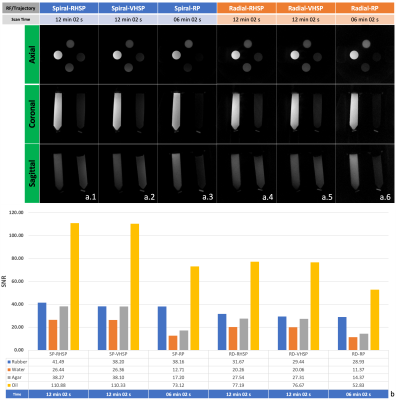
    Figure 4. Comparison of 3D radial and spiral trajectories among the regular half-Sinc pulse (RHSP) excitation, VERSE-modified half-Sinc pulse (VHSP) excitation, and the rectangular pulse (RP) excitation with matching scan parameters (a.1-6). SNR of the rubber (short T2 material) was generally higher for the spiral trajectories as compared to the radial trajectories. SP-spiral; and RD-radial. Beginning from the top and going clockwise, the vials contain rubber, water, agar and oil.
  • Volume-Selective 3D Ultrashort Echo-time Imaging
    Jinil Park1 and Jang-Yeon Park2,3
    1Biomedical Institute for Convergence at SKKU, Sungkyunkwan University, Suwon, Korea, Republic of, 2Department of Biomedical engineering, Sungkyunkwan University, Suwon, Korea, Republic of, 3Department of Intelligent Precision Healthcare Convergence, Sungkyunkwan University, Suwon, Korea, Republic of
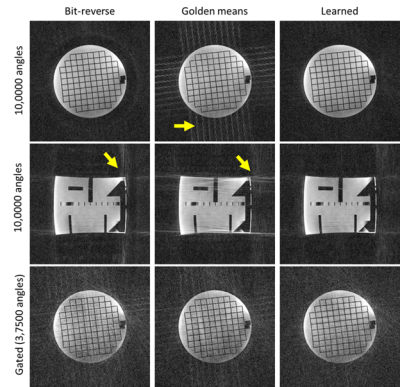
    this study demonstrates VS-UTE ability to maintain image quality when the number of projection views is undersampled or when the imaging volume is selected smaller than the imaging target.
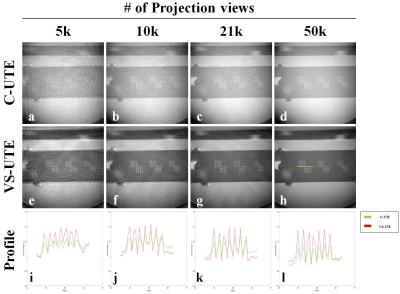
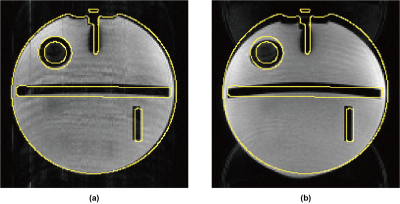
    Figure 3. the images including the resolution grids and 1D profiles of the ACR phantom acquired using conventional UTE (C-UTE) (a-d) and VS-UTE (e-h). The C-UTE image is difficult to show the internal structure due to the phantom signal outside the ROI when the number of projections was 5k, but VS-UTE provided a better internal structure image. Also, the overall CNR (contrast to noise ratio) of C-UTE was lower than that of VS-UTE(i-l).
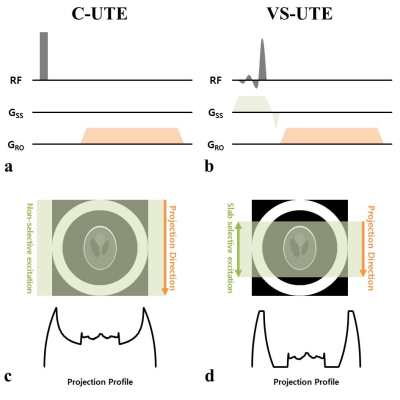
    Figure 1. Pulse sequence diagrams(a, b) and data acquisition method(c, d) of conventional UTE (C-UTE, a) and volume-selective UTE (VS-UTE, b). C-UTE, which uses a non-selective pulse for spin excitation(a), acquires projection data including spin information of the entire object(c). In contrast, The spin excitation of the unexcited object is not included in the signal(d) by using the slab selective pulse and the slab selective gradient simultaneously and setting the projection direction in the same direction as the slab selection direction(b).
Back to Top
Digital Poster Session - Pulse Sequence I
Acq/Recon/Analysis
Thursday, 20 May 2021 19:00 - 20:00
  • A Revised Algorithm for Spiral Gradient Waveforms with a Compact Frequency Spectrum
    James Pipe1
    1Mayo Clinic, Rochester, MN, United States
    Gradients for arbitrary spiral trajectories are optimized to have lower frequency content, so that the designed trajectory better matches a given gradient transfer function.  Precompensation conditioning results in precompensated waveforms which optimally match gradient limits.
    Designed (left) and precompensated (right) waveforms for the Standard trajectory, from (a) the initial design, then adding (b) frequency limiting, (c) transition smoothing, and (d) precompensation conditioning. Frequency, slew, and gradient amplitude waveforms are colored red, blue, and green, while the gray waveforms show the positive part of Gx. The blue arrows illustrate the spikes in the slew rate of the precompensated waveforms, which are further mitigated with each layer. Waveforms are normalized by the design maximum for easier visualization.
    Designed (left) and precompensated (right) waveforms for the (a) spiral-in, (b) variable density, and (c) single shot trajectories. Frequency, slew, and gradient amplitude waveforms are colored red, blue, and green, while the gray waveforms show the positive part of Gx. Waveforms are normalized by the design maximum for easier visualization.
  • Accelerated Spiral Turbo-Spin-Echo Sequence with Split Spiral In-out Acquisition
    Xi Peng1, Daniel Borup2, and James Pipe1
    1Mayo Clinic, Rochester, MN, United States, 2Philips Healthcare, Rochester, MN, United States
    We accelerated a previous spiral-TSE method by a factor of 2 using a split spiral in-out acquisition strategy with reversed arm orderings to intrinsically compensate for the T2-decay induced artifacts and produce low-SAR and improved contrast for fast T2-weighted imaging in the brain.
    Figure 3. Comparison between Cartesian TSE and Spiral TSE images at five representative slices. The total scan time were 4 min 30 sec, 3 min 48 sec and 1 min 54 sec respectively.
    Figure 1. a) The spiral in-out trajectory used in TSE sequence; b) Illustration of reversed arm ordering for T2-decay compensation.
  • T2*-Weighted Imaging Using Gradient-Echo BURST Combined with EPI and Spiral Readout Trajectories
    Rolf F Schulte1, Ana Beatriz Solana1, and Scott R Hinks2
    1GE Healthcare, Munich, Germany, 2GE Healthcare, Waukesha, WI, United States

    - EPI and Spiral imaging were with combined with BURST, where magnetisation is excited with a train of RF pulses

    - Off-resonance artefacts are reduced by splitting the long single-shot readout trajectories into multiple segments acquired inside the same pulse-and-acquire block

    Fig. 3: Sequence comparison results in the brain of a healthy volunteer. A particularly sensitive area are the sinuses (depicted by arrows). B0 inhomogeneities again lead to geometric distortions (EPI), blurring (Spirals) and also signal dropout, particularly in case of the single shot spiral.
    Fig. 1: Sequence diagram and corresponding k-space of the 3 BURST sampling schemes. A train of 4 slice-selective RF pulses excites magnetisation, storing it in outer parts of k-space through gradients in (logical) xy (top and middle) or z direction (bottom). The readout is split into 4 segments, and each respective sub-RF pulse is refocused in centre of k-space (central line of EPI and beginning of Spiral trajectory). Hence, in the k-space depiction, the 4 separate regions in k-space all encode a similar area in k-space with EPI shifted by a quarter of a line and Spiral interleaved by 90°.
  • A single-shot GRASE technique for rapid and distortion-free diffusion-weighted spinal imaging
    Zhiqiang Li1, Melvyn B Ooi2, and John P Karis1
    1Neuroradiology, Barrow Neurological Institute, Phoenix, AZ, United States, 2Philips Healthcare, Gainesville, FL, United States
    DWI of the spine has not been widely adopted due to geometric distortion artifacts with EPI. Here we present a single-shot GRASE technique with whole-mode acquisition and reduced FOV imaging. Volunteer studies demonstrate minimum distortion artifacts and comparable SNR to msEPI.
    Fig. 3. Comparison of geometric distortion artifacts in 2 volunteers. The strong distortion artifacts in ssEPI (red arrows) are reduced but still present in msEPI (yellow arrows), while are eliminated in ssGRASE, as indicated by the contour extracted from FLAIR.
    Fig. 5. Illustration of T and L spine images. As can be observed, strong distortions exist in ssEPI. These artifacts are significantly reduced in msEPI with some residuals. msEPI may exhibit some artifacts (cyan arrows) and degraded quality of the vertebral body (orange arrows), which are improved in ssGRASE. It is typical that the spinal nerve bundle is not well seen in L-spine, where instead the vertebral bodies are the primary focus in many neurological applications. The shading in the lower corner of ssGRASE T-spine image (blue arrow) will be investigated.
  • Auto-calibrated simultaneous multiband cardiac GRE cine MRI at 5 Tesla
    Yuan Zheng1, Lele Zhao2, Zhongqi Zhang2, Yu Ding1, and Jian Xu1
    1UIH America, Inc., Houston, TX, United States, 2United Imaging Healthcare, Shanghai, China
    a
    Eight consecutive frames from systole to diastole. Two slices were imaged simultaneously and shown in the first and second rows. The temporal resolution of each frame is 3.7 ms × 15 views per shot = 56 ms. The heart contraction and relaxation motion is well preserved in both slices.
    Slice-dependent phase modulation can be achieved by adjusting the RF excitation pulse. The blue and red pulses are components of the multiband rf pulse for slice 1 and slice 2 respectively. The phase of slice 1 is not modulated, while the phase of slice 2 changes by π in between PE lines. In adjacent frames, a phase offset of π is applied on slice 2.
  • Rapid 3D Actual Flip Angle Echo Planar Imaging at 7 Tesla
    Rüdiger Stirnberg1, Philipp Ehses1, Eberhard Daniel Pracht1, and Tony Stöcker1,2
    1German Center for Neurodegenerative Diseases (DZNE), Bonn, Germany, 2Department of Physics and Astronomy, University of Bonn, Bonn, Germany
    We propose fast 3D Actual Flip angle Echo Planar Imaging (AFEPI) with CAIPIRINHA acceleration and arbitrary EPI factor. In-vivo experiments at 7T show that 2.5mm isotropic whole-head FA maps obtained in about 10s are feasible with negligible signal dropouts and negligible distortions.
    Fig. 3 Sagittal example slice of S(TR1) magnitude images and corresponding FA maps for 5mm isotropic AFI (A, top) and AFEPI protocols at 2.5mm (B,C) and 5mm (D,E) isotropic resolution without distortion correction. Regardless of TE and segmentation factor, major signal dropouts in the FA maps of 5mm AFEPI scans with anterior-posterior PE direction make those FA maps unreliable above the sphenoid sinus. The 2.5mm AFEPI maps match well with the AFI reference maps, again regardless of TE and segmentation. [Open figure to see both PE directions as animated GIF.]
    Fig. 1 Schematic sequence diagram of the AFI sequence (top) with optional multi-echo extension (dotted outlines), and the proposed AFEPI sequence with y- and a z-blips (red) to achieve skipped-CAIPI sampling (bottom). Spoiler gradient pulses (shaded gray) correspond to 6π/2π/2π (RO/PE/3D) and n times increased voxel dephasing at the end of TR1 and TR2, respectively2. For simplicity, an example EF=5 and n=TR2/TR1=3 is displayed.
  • Segmented 3D EPI with CAIPIRINHA for Fast, High-Resolution T2*-weighted Imaging
    Jin Jin1,2, Monique Tourell2, Pascal Sati3, Sunil Patil4, Kecheng Liu5, John Derbyshire6, Fei Han7, Saskia Bollmann2, Simon Robinson2, Josef Pfeuffer8, Steffen Bollmann2, Markus Barth2, and Kieran O'Brien1
    1Siemens Healthcare, Brisbane, Australia, 2The University of Queensland, Brisbane, Australia, 3Cedars-Sinai Medical Center, Los Angeles, CA, United States, 4Siemens Medical Solutions USA, Baltimore, MD, United States, 5Siemens Medical Solutions USA, Baltimore, OH, United States, 6National Institute of Mental Health, Bethesda, MD, United States, 7Siemens Medical Solutions USA, Los Angeles, CA, United States, 8Siemens Healthcare, Sydney, Australia
    A 3D EPI provides a flexible combination of single/multi shot scheme, in-plane segmentation, echo-train length, partial Fourier, and 2D-GRAPPA/2D-CAIPIRINHA acceleration. Highly accelerated high-resolution susceptibility-based imaging with markedly reduced scan time is presented.
    Figure 4 T2*-weighted 3D EPI images acquired using the proposed implementation with 2 subjects. Imaging protocols are summarized shown in Figure 3. Sections of the images were enlarged for detailed examination.
    Figure 1 Examples of k-Space sampling patterns when fully-sampled (a), and with GRAPPA 2×1 (b) and CAIPIRINHA 1×2 (c) accelerations. (a): The 3D EPI volume was separated into shots in the kx-ky plane (four shots in this case; blue, yellow, red and green) and partitions in the kz direction. (b): The GRAPPA acceleration was achieved by skipping the 2nd and 4th shots for all the partitions. (c): The CAIPIRINHA acceleration was achieved by alternatively skipping 2nd and 4th shots and then 1st and 3rd shots between successive partitions.
  • Interleaved single-shot EPI for geometric distortion improvement
    Hao Chen1, Shiwei Yang1, Sijie Zhong1, and Zhiyong Zhang1
    1School of Biomedical Engineering, Shanghai Jiao Tong University, Shanghai, China
    We develop a new interleaved single-shot EPI method (isEPI) to reduce geometric distortions on EPI images.
    Figure 2 Experimental results of ACR phantom in inhomogeneous field. (a) Image acquired by interleaved single-shot EPI. (b) Image acquired by conventional EPI. The yellow boundaries were extracted from the standard 2D FSE image. The vertical stripes are induced by phase correction error.
    Figure 3 Results on human brain. Left column: Images acquired by isEPI. Right column: Images acquired by conventional EPI. Both isEPI and conventional EPI images were acquired with 2-fold acceleration. The yellow boundaries were extracted from the standard 2D FSE image.
  • Varying Echo Spacing for Acoustic Noise Optimization in Single-Shot Echo-Planar Imaging
    Zhenliang Lin1, Qikang Li1, Huanhuan Liu2, Ming Liu2, Qiufeng Yin2, Rui Wang3, Guobin Li3, Dengbin Wang2, and Jie Luo1
    1Shanghai Jiao Tong University, Shanghai, China, 2Xinhua Hospital Affiliated to Shanghai Jiao Tong University School of Medicine, Shanghai, China, 3Shanghai United Imaging Healthcare Co., Ltd, Shanghai, China
    In this study, we optimized both volume and timbre for single-shot EPI sequence by varying the duration of each readout unit with a sinusoidal waveform. The noise level was reduced by 22.4dBA, and spectral entropy was increased over two times, while preserving image quality.
    Figure 1. Schematic plot of Varied ESP EPI pulse sequence design.
    Figure 3. a) The optimized Varied ESP values along the echo train; b) Noise spectrums of different sequences; c) Zoomed part of interest in Figure 3b.
  • Three-dimensional reduced field-of-view imaging (3D-rFOVI)
    Kaibao Sun1, Zheng Zhong1,2, Guangyu Dan1,2, Muge Karaman1,2, Qingfei Luo1, and Xiaohong Joe Zhou1,2,3
    1Center for MR Research, University of Illinois at Chicago, Chicago, IL, United States, 2Department of Bioengineering, University of Illinois at Chicago, Chicago, IL, United States, 3Departments of Radiology and Neurosurgery, University of Illinois at Chicago, Chicago, IL, United States
    A 3D reduced field-of-view imaging (3D-rFOVI) sequence based on a slab-selective 2D RF pulse has produced images with high isotropic spatial resolution and reduced image distortion that are useful in fMRI and DWI.
    Figure 1: (A): A schematic to illustrate 3D rFOVI by replacing slice selection with slab selection using a 2D RF pulse in (C), followed by through-slab phase-encoding as shown in (B). (B): A conceptual 3D rFOVI sequence with phase-encoding gradient along the slab direction. (C): Details of the 2D RF excitation pulse with a fly-back EPI excitation k-space trajectory to avoid the issues associated with Nyquist ghosts.
    Figure 4: (A): Visual fMRI activation maps, selected from the 3D volume, overlaid onto the baseline images acquired with 3D-rFOVI GRE-EPI. (B): The averaged time course showing the activation. The signal change in (B) is approximately 2.5%. The green bar represents the time period for visual stimulus, which was 24s.
  • Contrast enhancement of a magnetization prepared steady state sequence: an optimal control framework
    Benoît Vernier1,2, Eric Van Reeth1,3, Frank Pilleul1,4, Olivier Beuf1, and Hélène Ratiney1
    1CREATIS, Université de Lyon, INSA Lyon, UCBL Lyon 1, UJM Saint Etienne, Unité CNRS UMR 5220, INSERM U1206, F69621, Lyon, France, 2Siemens Healthineers, Saint-Denis, France, 3CPE, Lyon, France, 4Centre Léon Bérard, Lyon, France
    A generic optimal control framework for contrast optimization in presence of a longitudinal steady state is presented. In vitro and in vivo experiments validate the improvement of the contrast-to-noise ratio per unit of time of an MP-RAGE sequence.
    Figure 3: Rat 1, coronal slice, at the left side MP-RAGE with a simple inversion, at the right side MP-RAGE with a T2prep-IR, both optimized with an optimal control framework aiming at enhancing contrast between cortex and corpus callosum. Same acquisition parameters are used (segment duration: 3s, TR: 6.5ms, flip angle: 13°).
    Figure 2 : Contrast-to-noise ratio over the two rats, the four segment duration and the different slices orientations
  • Pure balanced steady-state free precession (bSSFP) imaging
    Jessica Schäper1,2, Grzegorz Bauman1,2, Carl Ganter3, and Oliver Bieri1,2
    1Department of Biomedical Engineering, University of Basel, Basel, Switzerland, 2Department of Radiology, Division of Radiological Physics, University Hospital Basel, Basel, Switzerland, 3Department of Diagnostic and Interventional Radiology, Klinikum rechts der Isar, Technical University of Munich, Munich, Germany
    For some tissues the frequency response of bSSFP exhibits a pronounced asymmetry due to the intra-voxel frequency distributions. In this work we show that this asymmetry disappears for brain tissue in the limit of $$$\mathit{TR}\sim 1\,\mathrm{ms}$$$ at $$$3\,\mathrm{T}$$$.
    The bSSFP profiles for the mean value of a white matter ROI, shown in the reference on the bottom right, are displayed. The asymmetry for $$$\mathit{TR}=5\,\mathrm{ms}$$$ $$$(\mathit{AI}=0.14)$$$ and $$$\mathit{TR}=3\,\mathrm{ms}$$$ $$$(\mathit{AI}=0.08)$$$ is clearly visible, while the profile for $$$\mathit{TR}=1.5\,\mathrm{ms}$$$ $$$(\mathit{AI}=0.02)$$$ exhibits almost no asymmetry.
    The calculated $$$\mathit{AI}$$$ maps for the different $$$\mathit{TR}$$$ are shown for three different axial slices of the in vivo brain scans. It is clearly visible that, overall, the values for $$$\mathit{TR} = 1.5\,\mathrm{ms}$$$ are smaller than for $$$\mathit{TR} = 3\,\mathrm{ms}$$$ and $$$\mathit{TR} = 5\,\mathrm{ms}$$$. The right pictures show anatomical references.
  • Half Fourier Acquisition Single Shot Turbo Spin Echo Diffusion Encoding with Transition between Pseudo-Steady States for 3T
    Aidin Arbabi1 and David G Norris1
    1Donders Institute, Radboud University, Nijmegen, Netherlands
    High quality imaging at 3T with half-Fourier acquisition single-shot turbo spin-echo diffusion-weighted with smooth transition between pseudo-steady states pulse sequence, characterized by a low specific absorption rate and no sensitivity loss.
    Figure 1. Refocusing radio frequency pulse scheme for TRAPS HASTE DW: Central k-space lines (30 lines, including preparing echoes shown by the red color) are sampled with nominal 180° flip angles, followed by a smooth ramp of 6 echoes (TRAPS). All other refocusing pulses have a low fixed nutation angle. Horizontal axis shows the number of echoes collected for the protocol used in this study.
    Figure 3. Example coronal slices from TRAPS HASTE DW in a healthy female subject at 3T: (left) T2-weighted (b0), (middle) diffusion-weighted (b = 1000 s/mm2), and (right) trace apparent diffusion coefficient (ADC) maps. Background noise has been masked from ADC maps.
  • Achieving High Spatial Resolution with Dual Polarity Missing Pulse Steady-State Free Precession in a Clinically Relevant Scan Time
    Michael Mullen1 and Michael Garwood1
    1Center for Magnetic Resonance Research and Department of Radiology, University of Minnesota, Minneapolis, MN, United States
    The authors previously reported a broadband, low flip angle method at 1.5T to image near metallic implants quickly relative to non-selective multispectral approaches. Herein this approach is demonstrated to achieve 1mm3 resolution at 3T with a large 3D FOV and scan time of ~8.74 minutes.
    An experimental demonstration of the distortion correction technique, showing a single plane along the second phase encoded dimension of the image to highlight the correction along the frequency encoded axis. Zoomed insets show the geometric and intensity distortion correction, and the B0 estimate is in units of voxels. The receiver bandwidth was 650 Hz/voxel, so the B0 estimate in this plane corresponds to approximately +/- 3250kHz.
    A comparison of the normalized fully sampled reconstruction to the accelerated reconstruction for one gradient polarity in a single plane along the frequency encoding dimension. There are some small high spatial frequency artifacts along the edges of the plastic grid in the phantom, but the residual aliasing artifacts are extremely minor. The peak SNR in the fully sampled cross section shown is approximately 97.43, and approximately 36.83 in the accelerated scan, in good agreement with the g-factor map and the acceleration (R=3x2) used.
  • Analytical Characterization and Comparison of Magnetization-Relaxation-Induced Point Spread Functions of TFE, bSSFP and TSE Acquisitions
    Dan Zhu1 and Qin Qin2,3
    1Department of Biomedical Engineering, Johns Hopkins University, Baltimore, MD, United States, 2The Division of MR Research, Department of Radiology, Johns Hopkins University, Baltimore, MD, United States, 3F.M. Kirby Research Center for Functional Brain Imaging, Kennedy Krieger Institute, Baltimore, MD, United States
    We provide analytical formulation of the point spread function of Cartesian TFE, bSSFP, and TSE with 180° refocusing. The contrast-to-noise ratio is defined and maximized analytically with optimal TFE/TSE factors and flip angles.
    Figure 1: MTF (a-c) and PSF(d-f) at variant Mz(0) levels, and the linear relationship between Mz(0) and the PSF peak-amplitude (g-i) of a typical TFE (left), bSSFP (center) and TSE sequence (right) when T1=1000ms, T2=100ms and T2*=50ms. Optimal TFE/TSE factors and FAs are chosen for TFE and TSE sequence at TR/ESP=10ms that maximize CNR. The TFE factor and the flip angle of bSSFP are chosen with 95% maximum CNR. Grey lines in g-i demonstrate contrast loss in all sequences and increased intercept (bias) in TFE and bSSFP with TR or TFE/TSE Factors 8 times larger than the optimal choice.
    Figure 2: MTF (a-c) and PSF(d-f) with different TFE/TSE factors of a typical TFE (a,d), bSSFP (b,e) and TSE sequence (c,f) when T1=1000ms, T2=100ms, T2*=50ms and Mz(0)=1. The FWHM of the main PSF lobe (g) and CNR (h) are plotted as curves over TFE/TSE factors, demonstrating the blurring effect and contrast preservation performance, respectively. The colored markers are from the respective TFE/TSE factors shown in (a-f). All methods are subject to peak-amplitude loss of the PSF peak with longer TFE/TSE factors.
  • MRzero –- Automated invention of MRI sequences using supervised learning
    Alexander Loktyushin1,2, Kai Herz1,3, Nam Dang4, Felix Glang1, Anagha Deshmane1, Simon Weinmüller4, Arnd Doerfler4, Bernhard Schölkopf2, Klaus Scheffler1,3, and Moritz Zaiss1,3
    1Max Planck Institute for Biological Cybernetics, Tübingen, Germany, 2Max Planck Institute for Intelligent Systems, Tübingen, Germany, 3Eberhard Karls University Tübingen, Tübingen, Germany, 4University Clinic Erlangen, Erlangen, Germany
    We propose a framework — MRzero — that allows automatic invention of MR sequences. At the core of the framework is a differentiable forward process allowing to simulate image measurement process and reconstruction.
    Figure 1: MRzero schematic. Figure a) shows the general MRI pipeline from spin system to reconstructed image. A differentiable MR scanner simulation implements Bloch equations for signal generation. (b): The output of forward process is compared to the target image, analytical derivatives w.r.t. sequence parameters are computed using auto-differentiation, and gradient descent is performed in parameter space to update sequence parameters. (c) Final or intermediate sequences can then be applied at the real scanner using the pulseq framework7.
    Figure 2: Learning RF and spatial encoding. Row a: k-space sampling at different iterations, Row b: flip angles over measurement repetitions. Row c: simulation-based reconstruction at different iterations 9, 99, 255, 355, and 1000. row d: phantom measurement, row e: in vivo brain scan. Row f: training error curve. An animated version can be found at: www.tinyurl.com/y4blmpe7. Target sequence: 2D transient gradient- and RF-spoiled GRE, matrix size 96, TR = 25 ms, TE = 3.2 ms, FA=5˚.
  • Advances in MRzero – supervised learning of parallel imaging sequences including joint non-Cartesian trajectory and flip angle optimization
    Felix Glang1, Alexander Loktyushin1, Kai Herz1,2, Hoai Nam Dang3, Anagha Deshmane1, Simon Weinmüller3, Arnd Doerfler3, Andreas Maier4, Bernhard Schölkopf5, Klaus Scheffler1,2, and Moritz Zaiss1,3
    1High-field Magnetic Resonance Center, Max-Planck Institute for Biological Cybernetics, Tübingen, Germany, 2Department of Biomedical Magnetic Resonance, Eberhard Karls University Tübingen, Tübingen, Germany, 3Friedrich-Alexander Universität Erlangen-Nürnberg (FAU), Neuroradiology, University Clinic Erlangen, Erlangen, Germany, 4Pattern Recognition Lab, Friedrich-Alexander-University Erlangen-Nürnberg, Erlangen, Germany, 5Empirical Inference, Max-Planck Institute for Intelligent Systems, Tübingen, Germany
    The proposed approach allows fully differentiable supervised learning of MRI sequences, including parallel imaging, non-Cartesian trajectories and flip angle optimization. By that, it extends the recently proposed MRzero framework.
    Figure 3. Optimization of free non-Cartesian k-space trajectory and RF flip angles for parallel imaging (R=4) at various intermediate iterations, including the final result at the last iteration. (A) Reconstructions, (B) difference maps to the target image (Figure 2A) and (C) current trajectory (colors corresponding to shots) and (D) current flip angles across the iterations. (E) Loss curve, i.e. normalized root mean squared error to target image over iterations. An animated version of the Figure can be found at https://tinyurl.com/ydgb9gf8
    Figure 2. Optimization of free non-Cartesian k-space trajectory for parallel imaging (R=3) at various intermediate iterations, including the final result at iteration 2550. (A) Reconstructions, (B) difference maps to the target image (Figure 2A) and (C) current trajectory (colors corresponding to shots) across the iterations. (D) Loss curve, i.e. normalized root mean squared error to the target image over iterations.
  • Optimized DANTE preparation for intracranial DANTE-SPACE vessel wall imaging at 7T
    Matthijs de Buck 1, Aaron Hess2, and Peter Jezzard1
    1Wellcome Centre for Integrative Neuroimaging, FMRIB Division, Nuffield Department of Clinical Neurosciences, University of Oxford, Oxford, United Kingdom, 2Oxford Centre for Clinical Magnetic Resonance Research, Department of Cardiovascular Medicine, University of Oxford, Oxford, United Kingdom
    Optimized DANTE-preparation when using DANTE-SPACE at 7T increases the vessel wall visibility while reducing the SAR.
    Figure 4: DANTE-SPACE data acquired using (a) 300 DANTE-pulses of 10 degrees, (b) 200 DANTE-pulses of 9 degrees, and (c) without DANTE-preparation. (d-e) The mean of Figures (a) and (b), showing (d) conservatively drawn tissue masks for the vessel wall (red), CSF (orange), and lumen (yellow), and (e) an example of a vessel wall location (red line). (f) The corresponding vessel wall profiles using “standard” DANTE-preparation (a) and “optimized” DANTE-preparation (b). Dashed lines indicate Gaussian fits to the 7 pixels surrounding the peaks.
    Figure 3: Simulations of DANTE-SPACE using different DANTE-parameters. Blue dots correspond to “standard” DANTE; green asterisks to “optimized” DANTE. Black and blue lines indicate iso-contour SAR-lines of the DANTE-preparation (which accounts for approximately 30% of the total SAR in DANTE-SPACE), relative to the SAR of “standard” DANTE; values for each line are shown in (a). Figures show (a) contrast between the vessel wall and blood, (b) contrast between the vessel wall and CSF, (c) the FWHM of the vessel wall signal (px.), and (d) intensity of the vessel wall signal.
  • Acoustic and sampling optimization of 3D Radial MRI using neural network optimization
    Chenwei Tang1, Laura B Eisenmenger2, Steven Kecskemeti3, and Kevin M Johnson1,2
    1Department of Medical Physics, University of Wisconsin-Madison, Madison, WI, United States, 2Department of Radiology, University of Wisconsin-Madison, Madison, WI, United States, 3University of Wisconsin-Madison, Madison, WI, United States
    3D radial sampling can be optimized using sub-TR shifts and neural network angle optimization to obtain better sampling distribution and whiter acoustic noise. 
    (a) Schematic representation of the unsupervised neural network for better sampling uniformity and reduced acoustic noise autocorrelation. The two green arrows indicate gridding operators. The gridding operator for kspace coordinates grids kspace to 4D array (3D + time) for assessing sampling density. (b) In our design, the TR is variable with a small delay and learned delay prior to excitation. These delay values are learned though gradient descent of the acoustic loss function through the gridding operator.
    Phantom comparison of bit-reverse, golden mean, and learned view orders demonstrate a high level of sampling flexibility in learned sampling. Using 10,000 angles, learned angles avoid streak artifacts which occur in both bit-reverse and golden means (arrows). Subsampling acquisitions to 3750 projections maintains a low level of coherent artifact.