Renal
Body Tuesday, 18 May 2021
Oral
417 - 426
Digital Poster

Oral Session - Renal
Body
Tuesday, 18 May 2021 18:00 - 20:00
  • Harmonisation of Multiparametric Renal MRI for Multi-Centre Studies
    Charlotte E Buchanan1, Hao Li2, Fabio Nery3, Alexander J Daniel1, Joao De Sousa4, Steven Sourbron4, Andrew Priest2,5, David Thomas6,7,8, and Susan T Francis1
    1Sir Peter Mansfield Imaging Centre, University of Nottingham, Nottingham, United Kingdom, 2Department of Radiology, University of Cambridge, Cambridge, United Kingdom, 3Great Ormond Street Institute of Child Health, University College London, London, United Kingdom, 4University of Sheffield, Sheffield, United Kingdom, 5Department of Radiology, Addenbrooke's Hospital, Cambridge, United Kingdom, 6Neuroradiological Academic Unit, UCL Queen Square Institute of Neurology, UCL, London, United Kingdom, 7Dementia Research Centre, UCL Queen Square Institute of Neurology, UCL, London, United Kingdom, 8Wellcome Centre for Human Neuroimaging, UCL Queen Square Institute of Neurology, UCL, London, United Kingdom
    We have developed a multiparametric renal MRI protocol, harmonised across GE, Philips and Siemens 3T scanners. This comprises B0 and B1 mapping, diffusion weighted imaging (DWI), T1, T2 and T2* mapping, phase contrast (PC-MRI) and volumetric T1- and T2-weighted scans.
    Figure 1.Illustration of the harmonised multiparametric renal MRI protocol
    Table 1. The detailed parameters of harmonised multiparametric renal protocols
  • Multiparametric Renal MRI in Chronic Kidney Disease: Changes in MRI and Clinical Measures Over Two Years
    Charlotte E Buchanan1, Rebecca Noble2, Eleanor Cox1, Huda E Mahmoud2, Isma Kazmi2, Benjamin Prestwich1, Nicholas Selby2, Maarten Taal2, and Susan T Francis1
    1Sir Peter Mansfield Imaging Centre, University of Nottingham, Nottingham, United Kingdom, 2Centre for Kidney Research and Innovation, University of Nottingham, Derby, United Kingdom
    We assessed changes in renal MR measures to predict progression of CKD. Baseline measures of T1 and perfusion were different between progressors and stable patients, this could predict progression. Over time T1 and volume changed more in progressors which could be used to monitor progression
    Figure 1: A) Longitudinal relaxation time (T1) for the CKD cohort at baseline divided into ‘stable’ (n=13) and ‘progressors’ (n=9), B) Percentage change in T1 at Year 1 and Year 2 as compared to baseline for the ‘stable’ and ‘progressor’ group, C) Individual subjects shown at baseline, Year 1 and Year 2 with the ‘stable’ group shown in black and ‘progressors’ in red. [CM diff = corticomedulllary difference]
    Figure 2: A) Renal cortex perfusion for the CKD cohort at baseline divided into ‘stable’ (n=13) and ‘progressors’ (n=9), B) Percentage change in perfusion at Year 1 and Year 2 as compared to baseline for the ‘stable’ and ‘progressor’ group. C) Individual subjects shown at baseline, Year 1 and Year 2 with the ‘stable’ group shown in black and ‘progressors’ in red.
  • Multiparametric Renal MRI in Children and Young Adults: Comparison between Healthy Participants and Patients with Chronic Kidney Disease
    Deep B. Gandhi1, Jonathan R. Dillman2, Andrew T. Trout2, Jean A. Tkach2, Prasad Devarajan3, and Stephanie W Benoit4
    1Department of Radiology, Cincinnati Children's Hospital Medical Center, Cincinnati, OH, United States, 2Imaging Research Center, Department of Radiology, Cincinnati Children's Hospital Medical Center, Cincinnati, OH, United States, 3Department of Nephrology, Cincinnati Children's Hospital Medical Center, Cincinnati, OH, United States, 4Department off Nephrology, Cincinnati Children's Hospital Medical Center, Cincinnati, OH, United States
    Renal T1 and DWI ADC measurements significantly differ between healthy controls and pediatric and young adult patients with CKD and may be useful noninvasive biomarkers for CKD.
    Figure 3: Diffusion weighted imaging (DWI) ADC values in control participants and patients with CKD. (Top panel) ADC maps of a control and (failing renal transplant) patient. (Bottom panel). ADC values were significantly lower in patients compared to healthy controls for whole kidney, cortex and medulla.
    Figure 4: T1 MOLLI relaxation times in controls and patients with CKD. (Top panel) T1 maps of a control and (failing renal transplant) patient. (Bottom panel). T1 relaxation times were significantly greater in patients compared to healthy controls for whole kidney and cortex, whereas no significant difference was observed in the medulla between the two groups.
  • Renal perfusion imaging with free-breathing pCASL MRI in persons with salt-sensitive blood pressure
    Michael Pridmore1, Maria Garza1, Laura Jones2, Cassandra Reynolds2, Deepak Gupta2, Manus Donahue1, and Rachelle Crescenzi1
    1Radiology and Radiological Sciences, Vanderbilt University Medical Center, Nashville, TN, United States, 2Cardiovascular Medicine, Vanderbilt University Medical Center, Nashville, TN, United States
    Free-breathing pCASL MRI measuring cortical kidney RBF shows promise for applications in clinical research. SSBP showed reduced renal blood flow, consistent with poor sodium handling, which may provide a noninvasive clinically feasible imaging biomarker for salt sensitivity.
    Figure 4. Case examples of renal blood flow maps in persons A) with SSBP and B) non-SSBP. Cortical renal blood flow maps (ml blood/100 g tissue/min) are shown from the 4x acquisition protocol. The subject with SSBP exhibits lower cortical perfusion compared to the non-SSBP subject, consistent with group trends. The color bar and range of values for renal blood flow are shown top-right using a perceptually uniform colormap (magma)7.
    Figure 3. Renal blood flow (RBF) in groups with SSBP and non-SSBP. Salt sensitive blood pressure (SSBP) and non-SSBP groups were compared for cortical RBF, that demonstrated a trend towards reduced cortical RBF in SSBP (174.5 ± 53.9 mL/100g/min) compared to non-SSBP (253.8 ± 111.7 mL/100g/min) groups (p=0.07). This box plot demonstrates the median as the central line, and upper and lower quartiles as the edges of the boxes.
  • Imaging renal fibrosis in an oxalate induced chronic kidney disease model
    Luke Xie1, Aaron K Wong2, Rohan S. Virgincar1, Patrick Caplazi3, Vineela D. Gandham1, Alex J. De Crespigny4, Robby M. Weimer1, and Hans D. Brightbill2
    1Biomedical Imaging, Genentech, South San Francisco, CA, United States, 2Translational Immunology, Genentech, South San Francisco, CA, United States, 3Pathology, Genentech, South San Francisco, CA, United States, 4Clinical Imaging Group, Genentech, South San Francisco, CA, United States
    In an oxalate induced CKD model, we find that MRI FA and AD in the medulla are most correlated with fibrosis pathologies, hydroxyproline, and inflammatory and fibrotic gene expression (Col1a1, Col3a1, Fn1, SerpinE1, IL6, and CCL2).
    Fig 3. A: Pearson correlation matrix (absolute values) of MRI, hydroxyproline, histology, serum biomarkers, and gene expression data. High correlations are in red and low correlations are in blue. B: Schemaball for all metrics. Curves are colored by correlation between two metrics (magenta = negative correlations and yellow = positive correlations). Green nodes represent cumulative correlation between the individual metric and all other metrics. Control n=5 and oxalate n=8 for all data points except for gene expression (control n=5, oxalate n=4).
    Fig. 1. Images of control and oxalate fed mouse kidneys. T2-weighted, axial diffusivity, and fractional anisotropy of control (A) and oxalate kidneys (B). Collagen III histology of control (C) and oxalate kidneys (D). Collagen I histology of control (E) and oxalate kidneys (F). Histology insert images are shown at 5× magnification. Control n=5 and oxalate n=8. Scalebar = 2mm.
  • MR imaging of tuberous sclerosis complex in kidneys
    Shubhangi Agarwal1, Emilie Decavel-Bueff1, Yung-Hua Wang1, Hecong Qin1, Romelyn Delos Santos1, Michael Evans1, and Renuka Sriram1
    1Department of Radiology and Biomedical Imaging, University of California, San Francisco, San Francisco, CA, United States
    Multiparametric 1H MRI was able to report the stasis in tumor growth as compared to baseline as well as decrease in cellularity of kidney tumors in mice suffering from tuberous sclerosis (TSC) post everolimus treatment. 
    Figure 2: Comparison of axial vs coronal slice orientation and its effect on the tumor volume estimation (A). Representative T2-weighted axial and coronal images (B). Comparison of 1 mm vs 0.5 mm slice thickness and its effect on the tumor volume estimation (C). Representative T2-weighted 1mm and 0.5 mm slice thickness images (D).
    Figure 3: Lesion volume change with respect to baseline in control and treated mice (A). Mean ADC changes in control and treated mice over time (B). Representative ADC maps overlaid on diffusion weighted imaged at b = 25 s/mm2 at baseline and week 3 for control and treated tumors (C).
  • High-resolution kidney MRI in mice for longitudinal tracking of kidney volume and cyst burden
    Florian Schmid1, Geogios Koukos1, Yi Liu1, Matt Sooknah1, Sandip Chatterjee1, Adam Freund1, and Johannes Riegler1
    1Calico Life Sciences LLC, South San Francisco, CA, United States
    We present improved methods for acquisition and data analysis of kidney MRI in mouse models of chronic kidney disease, allowing for higher quality longitudinal tracking of disease progression and cyst development. 
    Fig. 1: Kidney images with short (left, 25 ms) and long (right, 60 ms) TE of one exemplary animal, showing fine detail, sharp boundaries and good cyst to tissue contrast
    Fig. 2: Automatically detected cysts from one exemplary animal (left), histogram of cyst size and total volume of every cyst size (right)
  • Motion-insensitive DTI of Kidney using Prospective Acquisition Motion Correction Triggering
    Arun Joseph1,2,3, Laila-Yasmin Mani4, Tom Hilbert5,6,7, Thomas Benkert8, Tobias Kober5,6,7, Bruno Vogt4, and Peter Vermathen3
    1Advanced Clinical Imaging Technology, Siemens Healthcare AG, Bern, Switzerland, 2Translational Imaging Center, Sitem-Insel, Bern, Switzerland, 3Departments of Radiology and Biomedical Research, University of Bern, Bern, Switzerland, 4Department of Nephrology and Hypertension, University Hospital Bern, Inselspital, Bern, Switzerland, 5Advanced Clinical Imaging Technology, Siemens Healthcare AG, Lausanne, Switzerland, 6Department of Radiology, Lausanne University Hospital and University of Lausanne, Lausanne, Switzerland, 7LTS5, École Polytechnique Fédérale de Lausanne (EPFL), Lausanne, Switzerland, 8Application Predevelopment, Siemens Healthcare GmbH, Erlangen, Germany
    We implemented diffusion tensor imaging of the kidney based on prospective acquisition motion correction and free-breathing acquisitions yielding robust performance and motion-insensitive reliable quantitative diffusion parameters.
    Figure 1: Example ADCT, ADCD, FA, and FP parameter maps a) derived from a PACE-triggered and (b) derived from a respiratory-triggered DTI scan of a volunteer.
    Table 3: Mean ± SD of the DTI parameters obtained from the three different sequence variants and comparison between medulla and cortex.
  • Mask R-CNN for Segmentation of Kidneys in Magnetic Resonance Imaging
    Manu Goyal1, Junyu Guo1, Lauren Hinojosa1, Keith Hulsey1, and Ivan Pedrosa1
    1Radiology, UT Southwestern Medical Center, Dallas, TX, United States
    This paper validated the Mask R-CNN for the segmentation of Kidneys in 2D T2-weighted fast spin-echo slices of 94 MRI exams. We achieved an average dice score of 83.9% and IoU of 76.3% in 5-fold cross-validation data.
    Table 1: The performance measures of Mask R-CNN for segmentation of kidney using 2D T2w images.
    Fig. 1. The bar plot demonstrates the total number of slices in which Dice and IoU scores ranged from 0 to 1.
  • Volumetric Renal ASL MRI using 3D TSE Cartesian Acquisition with Variable Density Sampling (VD-CASPR)
    Yiming Wang1, Limin Zhou1, Ivan Pedrosa1,2,3, and Ananth J. Madhuranthakam1,2
    1Radiology, UT Southwestern Medical Center, Dallas, TX, United States, 2Advanced Imaging Research Center, UT Southwestern Medical Center, Dallas, TX, United States, 3Urology, UT Southwestern Medical Center, Dallas, TX, United States
    We applied a variable density sampling method to renal ASL, which acquires the center of the k-space with higher averages and improves SNR and robustness, and combined it with partial k-space acquired M0 to compensate for increased scan time, but without compromising perfusion quantification
    Figure 1. (a) A Cartesian grid of a ky-kz space showing CASPR view ordering, where the earlier echoes are acquired at the beginning of each echo train (blue dots) following a pseudo-spiral trajectory towards the later echoes (red). (b) VD-CASPR method acquires profiles in region 1 (R1, open circle), 2 (R2, asteroid) and R3 (dot) with variable density (e.g. 3, 2, and 1 averages respectively), but still maintaining a spiral profile ordering on a Cartesian grid for each echo train.
    Figure 2. Kidney perfusion weighted images of a normal volunteer acquired using single-average 3D TSE-CASPR (a, top row) and with VD-CASPR method (b, bottom row), shown for several slices of the kidneys. VD-CASPR images showed minimized background noise and improved SNR. Note some signal variation between the right and left kidneys, probably due to B1 inhomogeneities.
Back to Top
Digital Poster Session - Renal Functional Imaging
Body
Tuesday, 18 May 2021 19:00 - 20:00
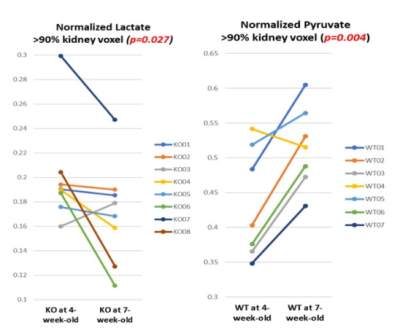
  • Comparison of pharmacokinetic models for assessing murine renal function by DCE-MRI
    Soham Mukherjee1, Mahon L Maguire1, Jack Sharkey1, Sourav Bhaduri1, Patricia Murray2, Rachel Bearon3, Bettina Wilm2, and Harish Poptani1
    1Centre for Preclinical Imaging, University of Liverpool, Liverpool, United Kingdom, 2Department of Cellular and Molecular Physiology, University of Liverpool, Liverpool, United Kingdom, 3Department of Mathematical Sciences, University of Liverpool, Liverpool, United Kingdom
    Dynamic contrast enhanced magnetic resonance imaging was used to determine the permeability parameter Ktrans, to assess renal function.
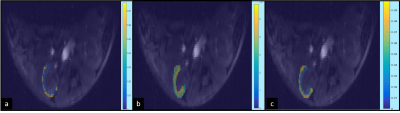
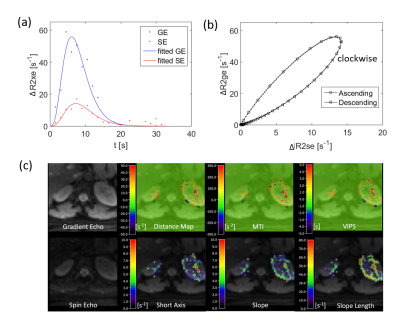
    Fig. 1: Ktrans (s-1) maps of the cortical region overlaid on the left kidney of a mouse. The raw AIF was used to compute the Ktrans maps using the non-linear Tofts (a), extended Tofts (b), and the SSM (c).
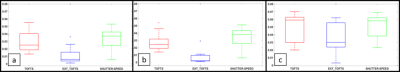
    Fig. 2: Boxplot of mean Ktrans (s-1)values from fitting of nonlinear Tofts, extended Tofts and SSM using AIF derived from (a) raw data, (b) SSA denoising, and (c) bi-exponential fitting.
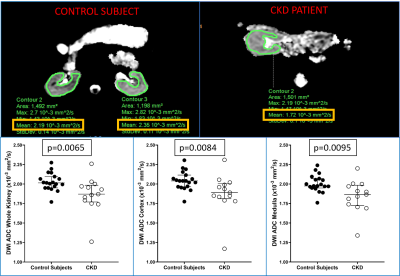
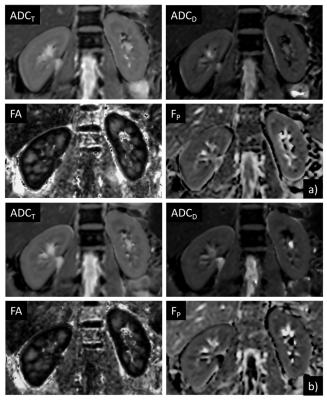
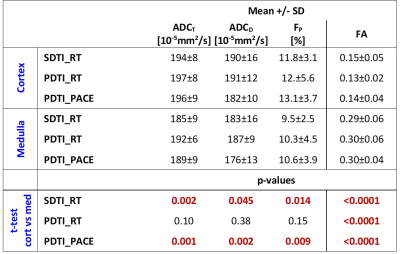
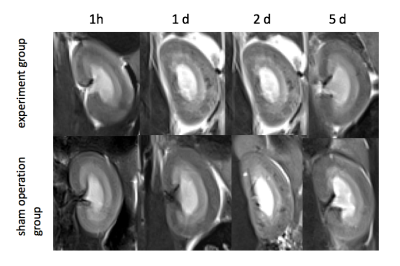
  • Diffusion Time Dependence of Apparent Diffusion Coefficient and Intravoxel Incoherent Motion Diffusion Parameters in the Human Kidney
    Julia Stabinska1, Hans-Joerg Wittsack1, and Alexandra Ljimani1
    1Department of Diagnostic and Interventional Radiology, Heinrich Heine University Dusseldorf, Dusseldorf, Germany
    Mono-exponential ADC and IVIM-related diffusion coefficient D of the kidney slightly increase with diffusion time as opposed to ADC of skeletal muscle. Pseudodiffusion coefficient D* shows the strongest dependence on diffusion time among the investigated parameters.
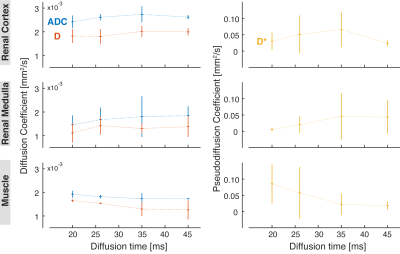
    Mono-exponential ADC and IVIM-related parameters (D, D*) measured in the renal cortex (top row), renal medulla (middle row) and skeletal muscle (bottom row).
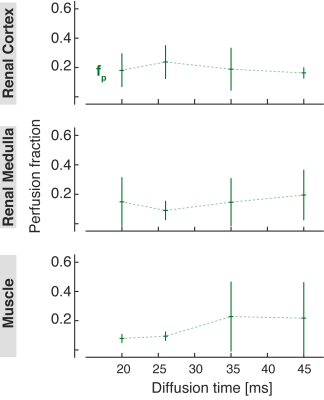
    Perfusion fraction fp obtained from the IVIM analysis in the renal cortex (top row), medulla (middle row), and skeletal muscle (bottom row).
  • Phosphorus Magnetic Resonance Spectroscopy of Healthy Human Kidney in-situ at 3T
    Maysam Jafar1 and Jan Weis2
    1Clinical Science, Philips Healthcare, Stockholm, Sweden, 2Department of Medical Physics, Uppsala University Hospital, Uppsala, Sweden

    ·       31P-MRS of normal human kidney in-situ is feasible on 3T clinical MR systems in an acceptable measurement time.

    ·       The amplitudes of b-ATP resonances are decreased due to the narrowing of the effective excitation bandwidth with respect to distance from the surface coil.  

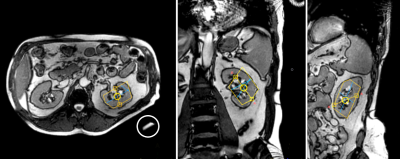
    Figure 1: Typical voxel position in axial, coronal and sagittal planes. A small water-containing bottle (circled) was attached to the centre of the coil as a marker of coil position.
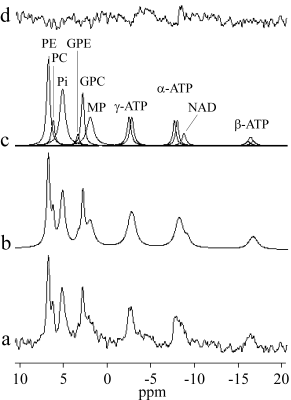
    Figure 2: 31P spectrum of the normal human kidney in situ. (a) The added spectrum of the five healthy volunteers, (b) fitted spectrum, (c) individual components, and (d) residue.
  • Repeatability of multi-parametric renal MRI biomarkers in healthy subjects: An iBEAt pilot study
    Kanishka Sharma1, Bashair Alhummiany2, David Shelley2,3, Margaret Saysell2,3, Maria-Alexandra Olaru4, Bernd Kühn4, Julie Bailey3, Kelly Wroe3, Cherry Coupland3, Michael Mansfield3, and Steven Sourbron1
    1Department of Imaging, Infection, Immunity and Cardiovascular Disease, University of Sheffield, Sheffield, United Kingdom, 2Department of Biomedical Imaging Sciences, University of Leeds, Leeds, United Kingdom, 3Leeds Teaching Hospitals, Leeds, United Kingdom, 4Siemens Healthcare GmbH, Erlangen, Germany
    The results indicate overall comparable repeatability for MRI biomarkers of renal tissue structure and perfusion using phase contrast, while also highlighting the need for formal MRI quality assurance prior to image processing.
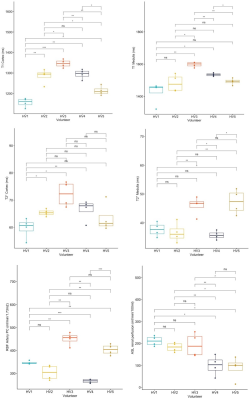
    Figure 3. Box plots for T1, T2* mapping in the renal cortex and medulla (ROIs), arterial RBF (BSA normalised) using PC-MRI, and renal perfusion (ml/min/100ml) with ASL, from 4 repeatability measurements in 5 healthy volunteers (HV) on the reference MRI scanner (MAGNETOM Prisma 3T, Siemens Healthcare GmbH, Erlangen, Germany) using the iBEAt MRI protocol. Pairwise comparison using t-test shows the statistical significance of differences (ns: not significant = p > 0.05; *p ≤ 0.05; **p ≤ 0.01; ***p ≤ 0.001) between HVs.
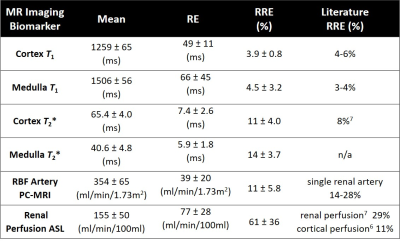
    Table 1. 95% confidence interval for the mean value of each parameter (1st column), and for the mean value of their RE (2nd column) and RRE (3rd column). Literature values of RRE (4th column).
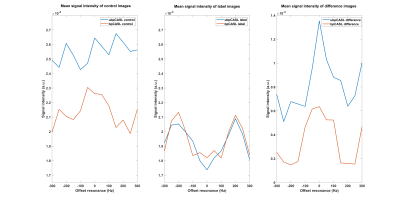
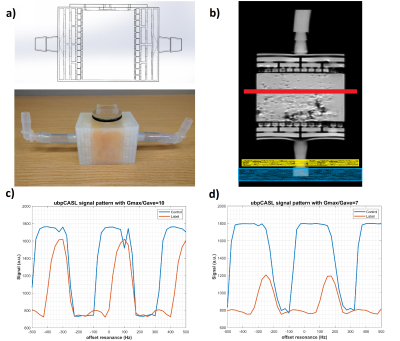
  • Measurement of renal medullary perfusion using a 7-compartment model for MR Renography
    Anneloes de Boer1, Bashair Al Hummiany2, Kanishka Sharma3, and Steven Sourbron3
    1University Medical Center Utrecht, Utrecht, Netherlands, 2University of Leeds, Leeds, United Kingdom, 3University of Sheffield, Sheffield, United Kingdom
    A 7-compartment model was developed to measure medullary perfusion using MR renography and validated using simulations. In diabetic patients, the model produced relatively high medullary perfusion values of 81 mL/100mL/min.
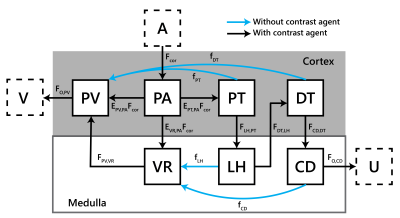
    Figure 1: The 7 compartment model; Fmed=EVR,PAFcor . A aorta; V renal veins; PV venous plasma compartment (low pressure vascular spaces including veins and peritubular capillaries); PA arterial plasma compartment (high pressure vascular spaces including arteries and glomeruli); PT proximal tubules; DT distal tubules; VR vasa recta; LH loop of Henle; CD collecting ducts; U urine. The blue arrows represent reabsorption flows carrying mainly water but no contrast agent.
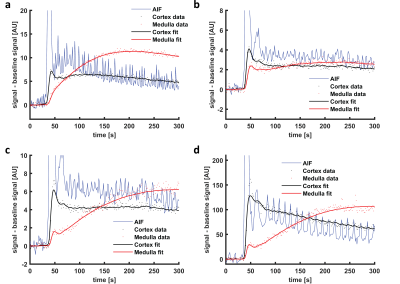
    Figure 3: Example of a and b) a 7CM fit to simulated data and c and d) a 7CM fit to patient data (only the first 300 s are shown). Note that the model fits the first pass peak well in simulated data, while it is not capable to capture the full height of the first pass peak in patient data. The oscillations on the AIF are due to inflow effects.
  • Improved Accuracy of Ratiometric CEST pH Mapping using Two Iodinated Agents with Nonequivalent Amide Protons and a Single Low Saturation
    Quan Tao1, Peiwei Yi1, Zimeng Cai1, Yingjie Mei2, Ruiyuan Liu1, and Yanqiu Feng1
    1School of Biomedical Engineering, Southern Medical University, Guangzhou, China, 2Philips healthcare, Guangzhou, China
    The combination of iobitridol and iodixanol with the mixed ratio of 1:1 was found to be the best for pH mapping. Improved accuracy and extended pH detection range have been achieved under a single reduced B1 of 1.5 μΤ, which enable the reliable pH mapping of kidney in vivo.
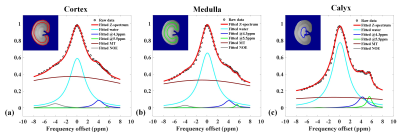
    Figure 4. In vivo Z-spectra of cortex (a), medulla (b) and calyx (c) in one rat kidney after intravenous injection of iodixanol and iobitridol mixture, and the fitting results using the multi-pools Lorentzian model .
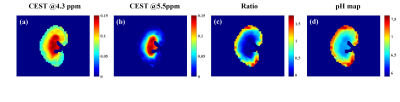
    Figure 5. Resolved maps of two CEST effects at 4.3 ppm (a) and 5.5 ppm (b) obtained from acquired Z-spectra of one rat kidney under a saturation power of 1.5 μT; Ratiometric image (c) and the pH map (d) obtained from the two CEST effects.
  • Effect of gravity on kidney function: evaluation using multiposture MRI
    Yuki Oda1, Tosiaki Miyati1, Naoki Ohno1, Seiya Nakagawa1, and Satoshi Kobayashi1
    1Division of Health Sciences, Kanazawa University, Kanazawa, Japan
    Gravity reduces the blood flow and T2 of the kidney. Multiposture MRI makes it possible to evaluate the effect of gravity on regional kidney function.
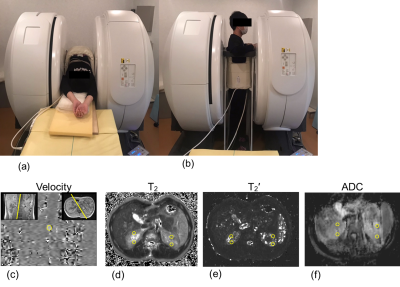
    Figure 1. (a) Supine and (b) upright positions in the multiposture MRI. Regions of interest (yellow open circles) on the (c) velocity, (d) T2, (e) T2’, and (f) apparent diffusion coefficient (ADC) images.
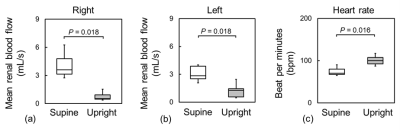
    Figure 2. Mean renal blood flow of the (a) right and (b) left kidneys, and (c) heart rate in the supine and upright positions.
  • BOLD MRI for evaluating intra-renal oxygenation level during acute saline loading
    El-Sayed H Ibrahim1, Abdul Parchur1, Srividya Kidambi1, Allen Cowley1, and Mingyu Liang1
    1Medical College of Wisconsin, Milwaukee, WI, United States
    BOLD MRI is capable of monitoring acute changes in the regional hemodynamics within the kidney. The variable responses seen in the imaged subjects may reflect differences in salt-sensitive versus salt-insensitive individuals
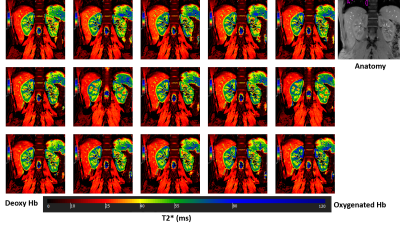
    Fig 1. Sequential T2* BOLD images acquired in a volunteer during one hour of saline infusion. An anatomical image is shown for reference. The images show clear gradient in tissue oxygenation level between cortex and medulla, represented by higher and lower T2* values, respectively, based on the T2* color map (measured in ms).
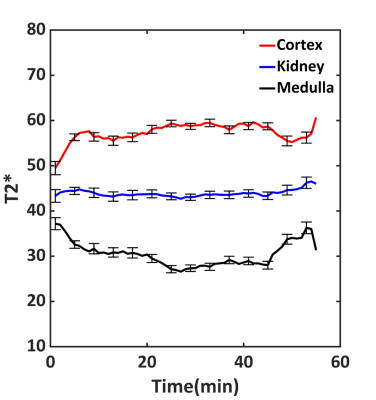
    Fig 3. Average T2* values (ms) from all volunteers during one hour of saline infusion. Average T2* in the kidney was constant, while T2* values in the cortex were significantly higher than those in the medulla. Note changes in T2* values at the beginning and end of the experiment when infusion rate was lower than the rest of the experiment.
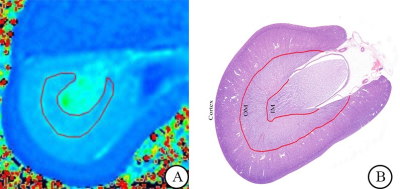
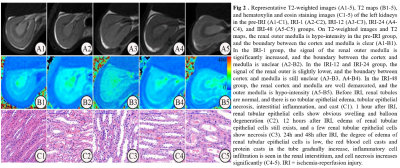
  • Severity of Tubular Atrophy and Fibrosis in Acute Kidney Injury Revealed by Multi-parametric MRI
    Feng Wang1,2, Tadashi Otsuka3, Zhongliang Zu1,2, Mark P de Caestecker3, Raymond C Harris3, Takamune Takahashi3, and John C Gore1,2
    1Vanderbilt University Institute of Imaging Science, Vanderbilt University Medical Center, Nashville, TN, United States, 2Department of Radiology and Radiological Sciences, Vanderbilt University Medical Center, Nashville, TN, United States, 3Division of Nephrology and Hypertension, Vanderbilt University Medical Center, Nashville, TN, United States
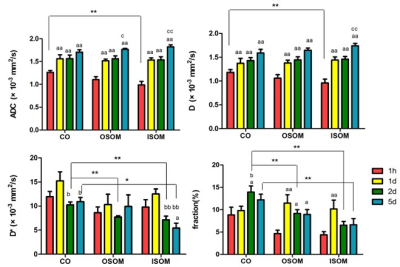
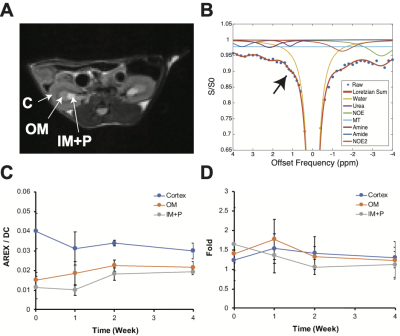
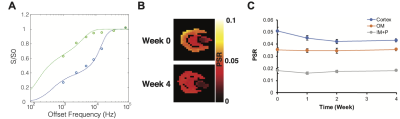
    MRI measures such as pool size ratio, relaxation rates, and parameters derived from  R dispersion are sensitive to tubular atrophy and fibrosis in kidneys. Spin-lock MRI provides parameters with higher sensitivity than R1 and R2.  
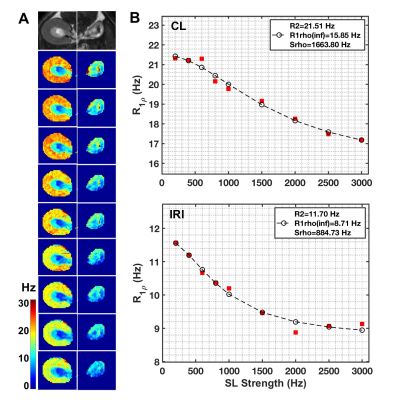
    Figure 4. Comparison of representative in vivo R dispersion between CL and IRI kidneys. (A) T2-weighted images (T2W) and R maps at different spin-locking strength with locking frequency from 200 to 3000 Hz (top to bottom). (B) Comparison of R dispersions between CL and IRI kidneys. The parameters were derived from Chopra model, with fitting results from SL strength ranges 200-3000 Hz shown. Cortex and OSOM were included to calculate the averaged R at each spin-lock strength for further fitting.
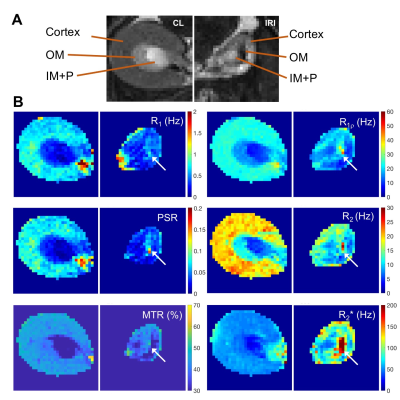
    Figure 5. Representative comparison of MRI images and maps of CL and IRI kidneys. (A) T2-weighted (T2W) images zoomed on CL and IRI kidneys. (B) R1, R (spin-lock frequency 1000 Hz), R2, R2*, pool size ratio (PSR) from quantitative magnetization transfer (qMT) modeling, and magnetization transfer ratio (MTR) based on images without and with magnetization transfer saturation (flip angle 820 degree and RF offset 5000 Hz). The arrows indicate outer medulla.
  • Detection of fibrosis in patients with moderate renal impairment with multiparametric MRI
    Pete Thelwall1,2, Jehill Parikh1, Benjamin Pippard1, Caroline Wroe3, Rob Janiczek4, Steven Sourbron5, and Neil Sheerin1
    1Translational and Clinical Research Institute, Newcastle University, Newcastle upon Tyne, United Kingdom, 2Centre for In Vivo Imaging, Newcastle University, Newcastle upon Tyne, United Kingdom, 3South Tees Hospitals NHS Foundation Trust, Middlesborough, United Kingdom, 4GlaxoSmithKline, Philadelphia, PA, United States, 5University of Sheffield, Sheffield, United Kingdom
    A multiparametric kidney scan protocol was implemented. An increase in cortical native T1 and T2 was observed in patients with moderate renal impairment and biopsy-proven fibrosis compared to healthy controls. 
    T1 maps from a healthy volunteer (left) and patient with moderate renal impairment and biopsy-proven fibrosis (right). Lower contrast (ie. smaller T1 different) between cortical and medullary regions is observed in the patient with renal disease compared to the healthy volunteer.
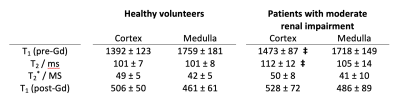
    Cortical and medullary T1 (pre- and post-administration of gadolinium-based contrast agent), T2 and T2* measurements from healthy volunteers and patients with moderate renal impairment. ‡ denotes a statistically significant different from healthy controls (p < 0.05).
  • Renal lipid content based on PDFF Imaging is a new potential biomarker for assessing early renal injury in patients with metabolic syndrome
    Shisi Li1, Yanjun Chen1, Yingjie Mei2, Xianfu Mo1, Jialing Chen1, Yongqiang Li3, and Xiaodong Zhang1
    1Department of Medical Imaging, The Third Affiliated Hospital of Southern Medical University, Guangzhou, China, 2Philips Healthcare, Guangzhou, China, 3Department of Nephrology, The Third Affiliated Hospital of Southern Medical University (Academy of Orthopedics· Guangdong Province), Guangzhou, China
    Renal fat content has been known as correlated with renal injury in type 2 diabetes. However, it is not clear the change of renal fat content in patients with metabolic syndrome (MS), which is a more popular disease threatened human health. In the present study, we assess the feasibility and reproducibility of renal fat fraction (FF) using PDFF imaging with MR mDixon-Quant sequence. And we aim to investigate the changes of renal FF in patients with MS, whose estimated glomerular filtration rate (eGFR) grade were G1(normal or elevated) and G2(mild decline) described in KDIGO (Kidney Disease: Improving Global Outcomes). In addition, we evaluate the correlation of renal FF and eGFR and the major factors of eGFR. The results show that with eGFR decreasing, renal FF in patients with MS-G2 group increased significantly compared with control and MS-G1 group. And the renal FF is an important affection factor of eGFR with a significant negative correlation. The noninvasive quantitative Dixon-based MRI may be a new biomarker for the evaluation of early renal impairment.
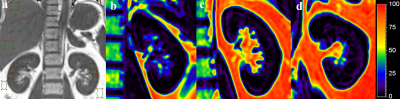
    Fig.1 Regions of interest were drawn manually on the kidney, liver and perirenal fat to obtain the quantitative FF(a). Colour-coded FF maps from a 25-year-old non- Metabolic syndrome male (b) , a 28-year-old male in MS-G1 group (c), and a 40-year-old male in MS-G2 group (d), whose average renal FF are 3.34%, 4.41% and 5.71% respectively .
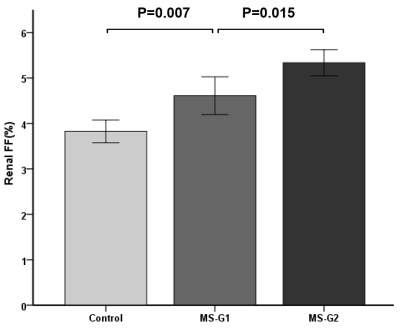
    Fig.2 In groups of control, MS-G1 and MS-G2, renal FF increased gradually and with significant differences among the groups(P<0.01).
  • Explore the performance of FF and R* value measured by mDIXON-quant for heathy controls, mild and acute CKD patients.
    Haoyang Jiang1, Ailian Liu2, Ye Ju2, Jiazheng Wang3, Changyu Du1, Lingli Qi1, Xinmiao Bu2, Wenjun Hu2, Nan Wang2, and Liangjie Lin3
    1Dalian Medical University, Dalian, China, 2The First Affiliated Hospital Of Dalian Medical University, Dalian, China, 3Philips Healthcare, Beijing, China
    In summary, the R2* value and fat fraction by mDIXON-Quant may help clinical diagnosis of CKD with quantitative evaluation of hypoxia and lipid deposition in renal tissues.
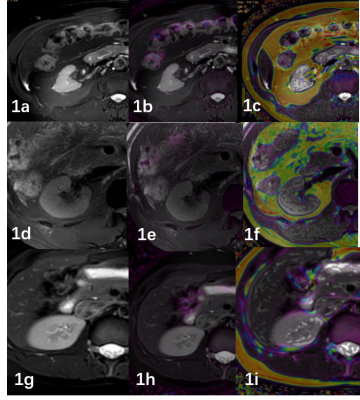
    Fig1. A 50-year-old male with CKD grade 5,eGFR was 7.87ml/min (1a). T2WI image. (1b)R2* image (1c). FF image.

    A 40-year-old male with CKD grade 1,eGFR was 124.09ml/min (1d). T2WI image. (1e)R2* image (1f). FF image

    A 31-year-old female volunteer (1g). T2WI image. (1h)R2* image (1i). FF image

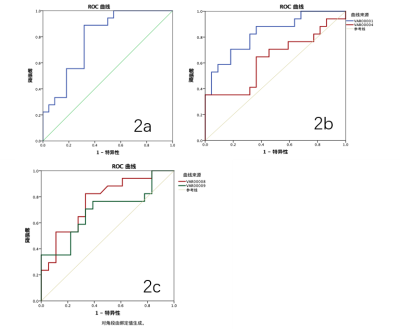
    Fig2. Diagnostic efficiency curve of the R2* values in heathy controls and mild CKD patients (2a).

    Diagnostic efficiency curve of the R2* values in heathy controls and acute CKD patients (2b).

    Diagnostic efficiency curve of the FF values in mild CKD patients and acute CKD patients (2c).

  • Value of quantitative susceptibility mapping for detecting renal fibrosis of early diabetic nephropathy in type 2 diabetes
    Jiayuan Shan1, Jinggang Zhang1, Jie Chen1, Wei Xing1, and Jilei Zhang2
    1Radiology, Third Affiliated Hospital of Soochow University, Changzhou, China, 2Philips Healthcare, Shanghai, China
    The purpose was to explore if quantitative susceptibility mapping (QSM) can assess renal fibrosis about early diabetic nephropathy (DN) in type 2 diabetes (T2D).
    Susceptibility maps of both kidneys for DN stage Ⅰ(a), Ⅱ(b) and Ⅲ(c). As the stage of DN increased, the medulla showed stronger diamagnetic value. However, there was no significant changes in the cortex.
  • Multiparametric MR imaging in diabetic nephropathy: New insights to evaluate early diabetic nephropathy noninvasively
    Akira Yamamoto1, Tsutomu Tamada2, Yu Ueda3, Takeshi Fukunaga2, and Atsushi Higaki2
    1Radiology, Kawasaki Medical School, Kurashiki, Japan, 2Kawasaki Medical School, Kurashiki, Japan, 3Phillips Japan, Tokyo, Japan
    This study suggests the possibility that MRI using the values of T2 in cortex and T2* in medulla, which can sensitively capture edematous changes in the renal cortex and hypoxia in renal medulla, can be used to evaluate early diabetic nephropathy non-invasively and in a short period of time.
    Recent studies of MR imaging have shown that water content level of tissue could be evaluated sensitively with T2 mapping 1). Steady-state free precession (SSFP) with spatially selective inversion recovery (ss IR) pulse using multi inversion time (TI) is able to distinct renal corticomedullary differentiation
    In two-group comparisons, significant differences were seen between group 0 and group 1 in values of T2 (mean ± SD: 95.8±8.39 vs. 106.4±11.49; p=0.015) T2* (33.4±2.41 vs. 38.3.0±6.31; p=0.020), inverted TI (1205±49.4 vs. 1288±55.3; p=0.001) and optimal TI (1367±61.2 vs. 1450±60.0; p=0.002). Significant differences were seen between group 0 and group 2 in values of T2 (95.8±8.39 vs. 105.7±6.38; p=0.021) T2* (33.4±2.41 vs. 41.4±4.69; p=0.001)
  • Quantitative T1 and R2* mapping in the evaluation of renal function in chronic kidney disease
    Jiaxin Yan1, Weiqiang Dou2, Hongmei Gu1, Xinquan Wang1, Weiyin Vivian Liu2, Huijian Lu1, Ying Zhou1, Xuejun Zhou1, and LI Yuan1
    1Affiliated Hospital of Nantong University, Nantong, China, 2GE Healthcare, MR Research China, Beijing, China
    T1 mapping combined with BOLD-MRI derived R2* mapping might provide an effective method in assessing renal function.
    Fig.1 Representative T1 and R2* mapping of the normal (a,b), the mild (c,d) and the moderate to severe patients (e,f) were shown.
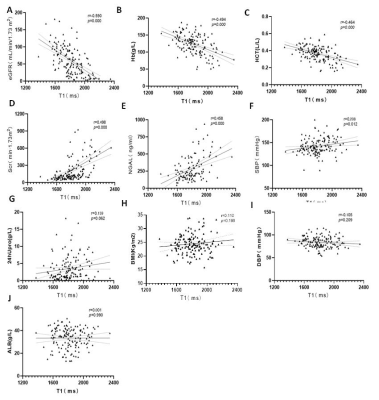
    Fig. 3 A-C:T1 value was negatively correlated with eGFR, Hb and HCT(p<0.05); D-F:T1 value was positively correlated with the NGAL, Scr, SBP(p<0.05); G-J: T1 value has no correlation with 24hUpro, BMI, DBP and ALB.
  • Evaluation of renal oxygenation and hemodynamics in patients with chronic kidney disease by BOLD-MRI and intrarenal Doppler ultrasonography
    Jing Yang 1, Shuohui Yang 2, Zheng He3, Mengxiao Liu4, and Caixia Fu5
    1Nephrology, Shuguang Hospital Affiliated to Shanghai University of Traditional Chinese Medicine, Shanghai, China, 2Radiology, Shuguang Hospital Affiliated to Shanghai University of Traditional Chinese Medicine, Shanghai, China, 3Ultrasonography, Shuguang Hospital Affiliated to Shanghai University of Traditional Chinese Medicine, Shanghai, China, 4MR Scientific Marketing, Siemens Healthcare, Shanghai, China, 5MR Applications Development, Siemens Shenzhen Magnetic Resonance Ltd, Shenzhen, China
    BOLD-MRI and IDU evaluating renal oxygenation and hemodynamics on CKD
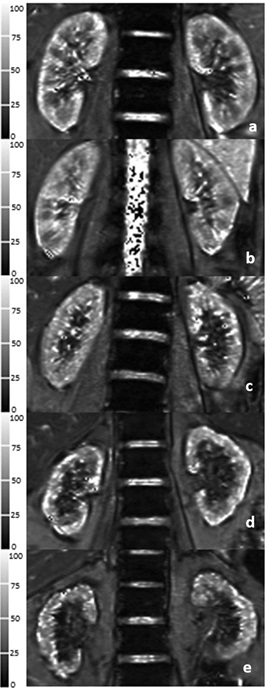
    Fig.1 Five typical T2* images of BOLD-MRI in healthy volunteer and CKD1-4 patients. a Healthy volunteer, male/26 years old. b Stage 1 CKD patient, female/28 years old. c Stage 2 CKD patient, male/29 years old. d Stage 3 CKD patient, female/ 62 years old. e Stage 4 CKD patient, female/58 years old.
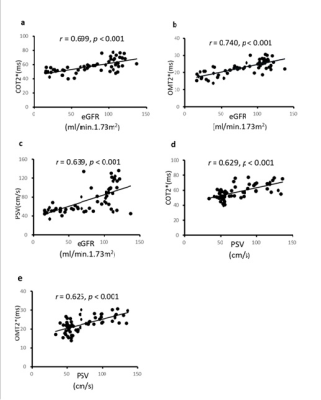
    Fig.2 Correlation coefficients among the cortical T2* (COT2*), outer medullary T2* (OMT2*) values, peak systolic velocity (PSV), and estimated glomerular filtration rate (eGFR). a Correlation of COT2* values and eGFR. b Correlation of OMT2* values and eGFR. c Correlation of PSV values and eGFR. d Correlation of COT2* values and PSV values. e Correlation of OMT2* values and PSV. Spearman coefficient testing was performed to assess statistical significance.
  • Renal hypoxia estimated by O2-inhalation T2* BOLD MRI: association with renal dysfunction and left ventricular remodeling in cardiomyopathy
    Michinobu Nagao1, Kiyoe Ando1, Yasuhiro Goto1, Isao Shiina1, Kazuo Kodaira1, Masami Yoneyama2, Takashi Namiki2, Atsushi Yamamoto1, Eri Watanabe1, Akiko Sakai1, Risako Nakao1, and Shuji Sakai1
    1Tokyo Women's Medical University, Tokyo, Japan, 2Philips Japan, Tokyo, Japan
    O2-inhalation T2*-BOLD MRI is a non-invasive imaging techniqueto evaluate renal oxygenation. Renal hypoxia expressed as decreased ΔR2*ratio is strongly associated with reduced eGFR. Early LV remodeling can lead to renal hypoxia.
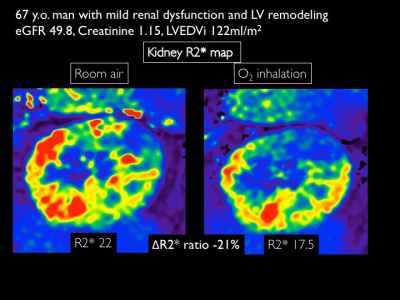
    O2-inhalation T2* BOLD MRIR2* map for 67 years man with cardiomyopathy and mild renal dysfunction
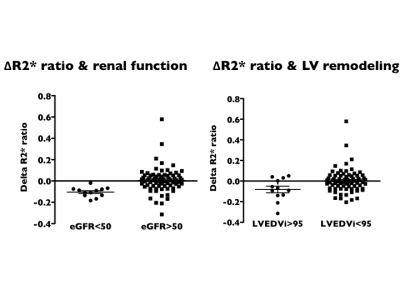
    Comparison of ΔR2*ratio between patients with eGFR <50mL/min/1.73m2and >50 mL/min/1.73m2(left) and between patient with LVEDVi >95 ml/m2 and <95 ml/m2.
  • The value of intravoxel incoherent motion diffusion-weighted imaging and T1-Mapping in the evaluation of renal transplantation function
    Dejuan Shan1,2, Xianquan Cui3, Xiangtao Lin1,2, Ruiyuan Diao2, Peng Zhao2, Mengxiao Liu4, Shuai Zhang2, Xiaoli Li2, Nan Lin2, Zhongyu Hou2, and Bing Liu5
    1Department of Radiology, Shandong Provincial Hospital Affiliated to Shandong University, Jinan, China, Jinan, China, 2Department of Radiology,Shandong Provincial Hospital Affiliated to Shandong First Medical Uiversity, Jinan, China, 3Qilu Hospital of Shandong University, Jinan, China, 4MR Scientific Marketing, Diagnostic Imaging, Siemens Healthcare Ltd., Shanghai 201318, China, Shanghai, China, 5Department of Radiology, China-Japan Friendship Hospital, Beijing, China, Beijing, China
    T1 mapping shows a promising prospect in the evaluation of Renal allograft function, and can provide the early detection of impairment of the renal allograft function.
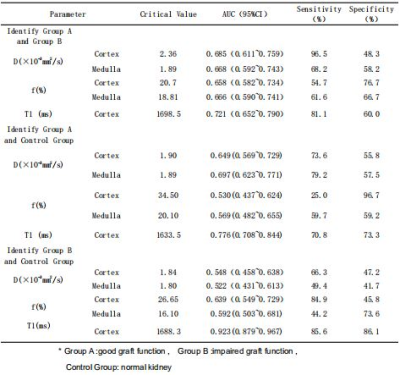
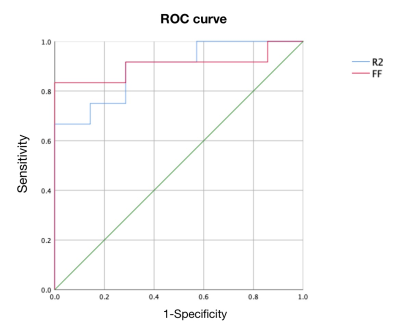
    Table2. ROC Curve analysis of Renal allograft function in patients with Group A and Group B, Group B and Control group by IVIM and T1-Mapping
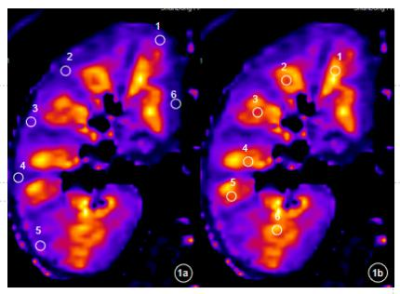
    Fig. 1 The Kidney,s selection method of region of interest (ROI). 1a) the upper, middle and lower poles of the kidney are located in the kidney, and several ROIs are delineated in thecortex;1 b) the upper, middle and lower poles of the kidney are located in the kindey, and several ROIs are delineated in the Medulla
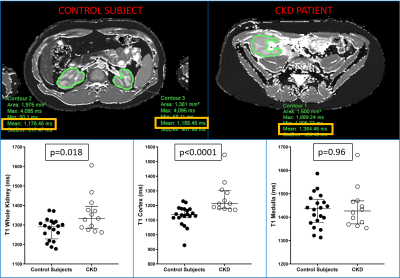
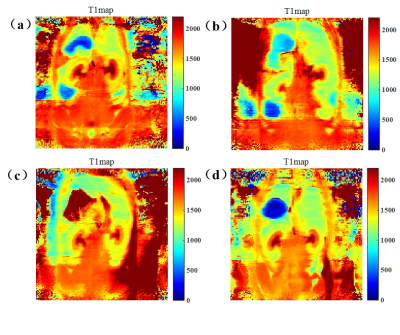
  • Native T1 mapping in assessment of kidney fibrosis in patients with chronic glomerulonephritis
    Zhaoyu Shi1, Fangfang Shang1, Xinquan Wang1, Hongmei Gu1, Xiaoyan Liu1, Weiqiang Dou2, Weiyin Vivian Liu2, Yuan Zhang1, Jianhua Wu1, and Li Yuan1
    1Affiliated Hospital of Nantong University, Nantong, China, 2GE Healthcare, MR Research China, Beijing, China
    Native T1-mapping demonstrated good diagnostic performance in evaluation of renal function and non-invasive detection of fibrosis in chronic glomerulonephritis patients.
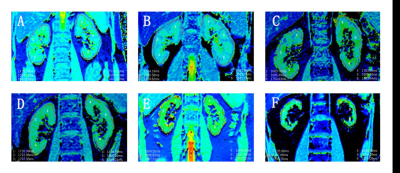
    Fig.1 Renal T1 maps. A: Coronal native T1 map of two kidneys of a healthy subject, T1=1539ms. B: CKD stage 1, T1=1622ms. C: CKD stage 2, T1=1751ms. D: CKD stage 3, T1=1796ms. E: CKD stage 4, T1=1902ms. F: CKD stage 5, T1=2068ms.
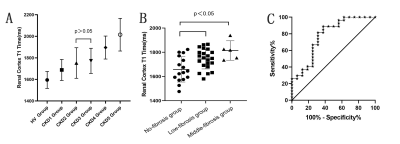
    Fig.2 A: T1 value of renal cortex was significantly lower in the HC group than in CKD patients(F=29.62, P<0.001). Statistical differences of T1 values were found between CKD stages except for stage 2 and 3 (p<0.05). B: Compared to non-fibrosis group, T1 value increased in the low and medium fibrosis group (p<0.05). C: The area under the ROC curve of T1 value for the prediction of IF is 0.762, and the optimal cutoff value of T1 is 1695 ms.
  • Evaluation of renal function in healthy volunteers and patients with chronic kidney disease by using APT weighted  imaging and R2* mapping
    Ye Ju1, Ailian Liu1, Jiazheng Wang2, Wenjun Hu1, Changyu Du3, Lingli Qi3, Haoyang Jiang3, Xinmiao Bu1, Nan Wang1, and Peng Sun2
    1First Affiliated Hospital of Dalian Medical University, Dalian, China, 2Philips Healthcare, Beijing, China, 3Dalian Medical University, Dalian, China
    The AUC, sensitivity and specificity of APT combined R2* were 0.925, 88% and 100%, respectively. The combination of APT and R2* can improve the diagnostic ability of discriminating CKD from HVs, which has certain clinical application value.
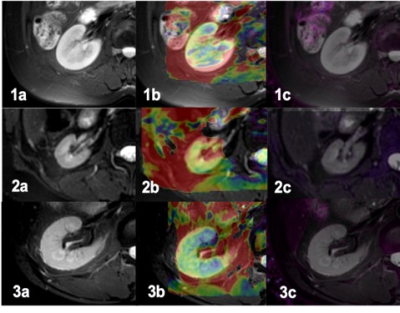
    Figure 1. A 55-year-old female volunteer. T2w image (1a), APT image(1b), R2* image(1c). A 34-year-old female with CKD grade 5, eGFR was 3.96, T2w image (2a), APT image(2b), R2* image(2c). A 59-year-old male with CKD grade 1, eGFR was 114.58. T2w image (3a), APT image(3b), R2* image(3c).
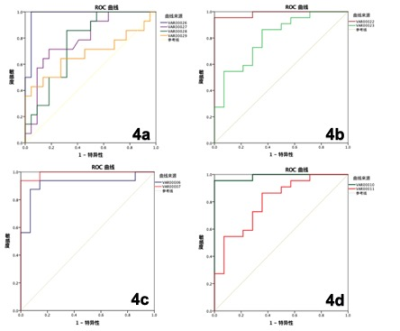
    Figure 4. Diagnostic efficiency curve of VHs and mRD(4a), diagnostic efficiency curve of VHs and sRD(4b), diagnostic efficiency curve of the APT values in mRD and sRD(4c) , diagnostic efficiency curve of joint use of the APT values and the R2* value in VHs and mRD (4d).
Back to Top
Digital Poster Session - Renal Vascular & Parenchymal Pathology
Body
Tuesday, 18 May 2021 19:00 - 20:00
  • Navigator-triggered kidney vessel architecture imaging
    Ke Zhang1, Simon M.F. Triphan1, Felix T. Kurz2, Christian H. Ziener3, Heinz-Peter Schlemmer 3, Hans-Ulrich Kauczor1, and Oliver Sedlaczek1,3
    1Department of Diagnostic and Interventional Radiology, Heidelberg University Hospital, Heidelberg, Germany, 2Department of Neuroradiology, Heidelberg University Hospital, Heidelberg, Germany, 3Department of Radiology, German Cancer Research Center, Heidelberg, Germany
    Navigator-triggered, dual gradient echo/spin echo EPI based kidney vessel architecture imaging
    Fig 2. Kidney VAI results. (a) Gradient echo (GE) and spin echo (SE) relaxation time curves from a selected pixel. These signals are fitted before calculation of the hysteresis loops. A clockwise hysteresis loop in this case is generated from the two signal series (b). Six VAI parametric maps are calculated based on the properties of loops and overlaid on gradient echo images (c).
    Fig 1. Respiration motion and motion correction in two heathy subjects (top down). M-mode display of navigator data showing abdomen motion with respiration (a, c). Note the signal saturation in the navigator signal caused by imaging slices (a, c). The calculated motion information are overlaid (red curve in a and c). Signal of liver in the last slices are compared before and after motion correction (b, d).
  • Evaluation of Image Quality of Renal Artery based on Balanced Turbo Field Echo Sequence using Compressed Sensing with Acceleration Factors
    Haonan Zhang1, Qingwei Song1, Jiazheng Wang2, Zhiwei Shen2, Renwang Pu1, Nan Zhang1, and Ailian Liu1
    1Department of Radiology, the First Affiliated Hospital of Dalian Medical University, Dalian, China, 2PHILIPS——Philips Healthcare, beijing, China
    In this study, we evaluated the image quality of renal artery based on B-TFE sequence with SENSE and CS-SENSE. CS factor of 6 is recommended for clinical renal artery imaging based on B-TFE sequence.
    Figure2. Reconstruction of renal artery. The first row, from left to right: SENSE2, CS2-CS4. The second row, from left to right: CS6-CS10.
    Figure 1. Location of two ROI of the blood vessels and the renal medulla. Use ROI to measure SI and SD on the left sides. The measured left blood vessel SI value was 1651.55, muscle SI value was 152.66, and muscle SD value was 25.95.
  • Improving the robustness of pseudo-continuous arterial spin labeling for renal perfusion imaging
    Limin Zhou1, Yiming Wang1, and Ananth Madhuranthakam1,2
    1Department of Radiology, University of Texas Southwestern Medical Center, Dallas, TX, United States, 2Advanced Imaging Research Center, University of Texas Southwestern Medical Center, Dallas, TX, United States
    In this study, we implemented and evaluated the optimized unbalanced pCASL gradient scheme with perfusion phantom and 4 healthy volunteers. The results showed this optimized unbalanced pCASL gradient scheme was more robust to off-resonance than the corresponding  scheme of balanced pCASL.
    Figure 4. The comparison of mean signal intensities in control (left), label (middle) and difference (right) images of second subject’s kidney (fig. 3) between unbalanced pCASL (blue) and balanced pCASL (red) across different off-resonance.
    Figure 2. a) 3D printed phantom mimics the branching vessels with input/output tubes connected to the pump. b) Labeling plane (yellow) and inflow saturation setup (blue) for 2D image acquisition (red). c) and d) Control and label signal pattern among different offset resonances of unbalanced pCASL (ubpCASL) with Gmax to Gave ratio of 10 and 7 respectively.
  • Ex-Vivo Renal Vascular Dominant Region Mapping using High Resolution 3D-T2w-MRI and Artery-Selective Contrast Injections in Porcine Kidneys
    Nathan Sennesael1,2, Pieter R.E. De Backer3,4,5, Charlotte Debbaut4,6, Karel Decaestecker3,5, Pieter L.J. De Visschere2,7, Marijn M. Speeckaert8,9, Saar Vermijs4,5, Geert Villeirs2,7, and Pim Pullens1,2,7
    1GIfMI, Ghent University, Ghent, Belgium, 2Diagnostic Sciences, Ghent University, Ghent, Belgium, 3Urology, Ghent University Hospital, Ghent, Belgium, 4IBiTech-bioMMeda, Ghent University, Ghent, Belgium, 5Human Structure and Repair, Ghent University, Ghent, Belgium, 6Cancer Research Institute Ghent (CRIG), Ghent University, Ghent, Belgium, 7Radiology, Ghent University Hospital, Ghent, Belgium, 8Nephrology, Ghent University Hospital, Ghent, Belgium, 9Internal diseases and Paediatrics, Ghent University, Ghent, Belgium
    We found that high resolution 3D-T2w-MRI scans in combination with artery-selective contrast injections is an effective alternative to ex-vivo kidney casting as it allows for 3D mapping of the renal vascular dominant regions and shows potential for segmentation of the renal vascular tree.
    Figure 2: Frontal views of scan in which upper and lower segmental arteries are injected with water.
    Figure 4: Visualization of the renal vascular tree
  • T2 mapping in the dynamic evaluation of renal ischemia-reperfusion injury: an animal study
    Jing Chen1, Jinggang Zhang1, Weiqiang Dou2, and Jie Chen1
    1The Third Affiliated Hospital of Soochow University, Changzhou, Jiangsu, China, 2GE Healthcare, MR Research China, Beijing, Beijing, China
    T2 values of the outer medulla increased at 1 hour after IRI and decreased from 1 hour to 48 hours gradually.  T2 values of the renal outer medulla in the IRI group showed significant positive correlation with tubular epithelial edema.  
    Fig 1. ROIs are drawn on T2 maps, and manually delineated along the margin of the renal outer medulla (A). The outer medulla is delineated according to the anatomy on the pathological map (B). ROI = region of interest. OM = outer medulla. IM = inner medulla.
    Figure: 2
  • The value of DKI in assessing the pathologic microstructural changes in the early stages of renal cold ischemia-reperfusion injuries
    Yizhong Yuan1, Jipan Xu1, Yan Ren2, Lihua Chen2, Jinxia Zhu3, Robert Grimm4, and Wen Shen2
    1First Central Hospital Institute, Tianjin Medical University, Tianjin, China, 2Department of Radiology, Tianjin First Center Hospital, Tianjin, China, 3MR Collaboration, Siemens Healthcare, Beijing, China, 4MR Application development, Siemens Healthcare GmbH, Erlangen, Germany
    The values of diffusion kurtosis imaging can effectively and non-invasively assess the microstructural changes of renal CIRIs in the early stages. The MK values may reflect more detailed microstructural changes compared with the MD values.
    Figure 1. Various b- value images in a normal rat. b = 0, 500, 1000, 1500, and 2000 s/mm2 separately from left to right.
    Figure 2. The MK values of the cortex (a), medulla (b), and MD values of the cortex (c), medulla (d) in different groups.
  • Values of R2’ mapping on evaluation of renal ischemia-reperfusion injury:an experimental study
    Qin Chen1, JingGang Zhang1, WeiQiang Dou2, Jie Chen1, and Wei Xing1
    1The Third Affiliated Hospital of Soochow University, Changzhou, Jiangsu, China, 2GE Healthcare, MR Research, Beijing, China
    The R2’ values in IRI group decreased and reached the lowest at 1 hour after IRI, and then increased, while the changes of the tubular epithelial edema was just opposite. This study indicated that the R2’ values of the renal outer medulla was negatively correlated with tubular epithelial edema.  
    Figure 2
    Figure 3
  • Intravoxel Incoherent Motion Imaging of Renal Cold Ischemia Reperfusion Injury in Rats
    Yan Ren1, Lihua Chen1, Yizhong Yuan2, Jipan Xu2, Jinxia Zhu3, Robert Grimm4, and Wen Shen1
    1Tianjin First Center Hospital, Tianjin, China, 2First Central Hospital Institute, Tianjin Medical University, Tianjin, China, 3MR collaborations, Siemens Healthcare Ltd., Beijing, China, 4Siemens Healthcare GmbH, Erlangen, Germany
    Kidney microcirculation perfusion was the major factor affecting CIRI, and IVIM imaging may be useful for detecting the renal injury, compensation, and recoverability.
    Figure 1. T2WI images acquired at 1 hour (A, E), and at 1 (B, F), 2 (C, G), and 5 (D, H) days after surgery. Figures A-D are sham operation group. Figures E-H are experiment group.
    Figure 4. Experimental group graphs at all imaging time points following the cold ischemia-reperfusion injury model. Values of the cortex (CO), outer stripe of outer medulla (OSOM), and inner stripe of outer medulla (ISOM) are averaged over the kidney to give (A) apparent diffusion coefficients [ADC], (B) pure molecular diffusion [D], (C) pseudo-diffusion [D*], and (D) the perfusion fraction. a: versus 1h; b: versus 1d; c: versus 2d; single mark: P<0.05; double mark: P<0.01; *: P<0.05; **: P<0.01
  • Mono-exponential, bi-exponential, and kurtosis diffusion-weighted imaging for renal cold ischemia-reperfusion injury in rats
    Lihua Chen1, Yan Ren1, Yizhong Yuan2, Jipan Xu2, Jinxia Zhu3, Xuening Zhang4, Robert Grimm5, and Wen Shen1
    1Tianjin First Center Hospital, Tianjin, China, 2First Central Hospital Institute, Tianjin Medical University, Tianjin, China, 3Siemens Healthcare Ltd., Beijing, China, 4Second Hospital of Tianjin Medical University, Tianjin, China, 5Siemens Healthcare GmbH, Erlangen, Germany
    The bi-exponential and kurtosis models based on multi-b-value DWI can quantitatively and noninvasively detect pathophysiologic renal changes and evaluate molecular water diffusion, microcirculation perfusion, and microstructural changes.
    T2-weighted imaging (T2WI) images of the experimental (upper panel) and sham (lower panel) operation groups at 1 hour, 1 day, 2 day, and 5 day (left to right) after the operations to induce renal cold ischemia-reperfusion injury (CIRI).
    Column graphs show renal cortical parameter comparisons among the three groups at 1 hour, 1 day, 2 day, 5 day after surgery. a and b show statistical differences compared with the normal and sham operation groups, respectively (P < 0.05). The apparent diffusion coefficient (ADC), mean diffusivity (MD), real diffusion coefficient (D), and false diffusion coefficient (DP) values are displayed as ×10-3mm2/s, and f values as %. The mean kurtosis (MK) parameter has no unit.
  • Monitoring Subclinical Renal Injury Progression by Saline-responsive CEST and Quantitative MT Imaging
    Soo Hyun Shin1, Michael F. Wendland2, and Moriel H. Vandsburger1
    1Department of Bioengineering, University of California, Berkeley, Berkeley, CA, United States, 2Berkeley Preclinical Imaging Core (BPIC), University of California, Berkeley, Berkeley, CA, United States
    Upon renal injury progression, the urea CEST contrast decreased in the cortex, and the saline-induced fold change of contrast decreased in the inner medulla and papilla. qMT imaging showed the decrease of semi-solid macromolecule pool in the cortex.
    Figure 2. CEST data acquisition and contrast measurement. (A) A T2-weighted image for segmenting the kidneys into the cortex (C), outer medulla (OM), and inner medulla and papilla (IM+P). (B) A Z-spectrum from a cortex fitted with 7-pool Lorentzian functions. The black arrow indicates the urea contrast at +1 ppm. (C) 1 ppm AREX measurements over time at each kidney region. (D) Fold change of 1 ppm AREX induced by saline infusion measured at each kidney region. Error bars indicate standard error mean.
    Figure 3. Quantitative MT (qMT) imaging data. (A) Example qMT spectra and fitting from a voxel in the cortex at two saturation powers (green – 220o flip angle, blue – 820o). (B) Pool size ratio (PSR) map of a kidney measured before cisplatin injection (week 0) and 4 weeks after multiple cisplatin injections. (C) PSR measurements over time in different anatomical regions in the kidney. Data are presented as mean ± standard error mean.
  • MRI enhancement of TPP-TEMPOL during reduces kidney damage
    Quan Tao1, Peiwei Yi1, Zimeng Cai1, Yingjie Mei2, Ruiyuan Liu1, and Yanqiu Feng1
    1School of Biomedical Engineering, Southern Medical University, Guangzhou, China, 2Philips healthcare, Guangzhou, China
    In this study, we aimed to use mitochondria target contrast agents (TPP-TEMPOL) to alleviate the damage of AKI and monitor the T1 changes by MR scanner. The result confirmed that TPP-TEMPOL can protect from the injure induce by ROS.
    Figure 2. T1-map of mouse’s kidney in group of Control + Saline (Figure 2a), Control + TPP-TEMPOL (Figure 2b), AKI + Saline (Figure 2c), AKI + TPP-TEMPOL (Figure 2d).
    Figure 4. BUN measurement (Figure 4a), Booy weight loss (Figure 4b) of four group. Figure 4c and 4d is the H&E stain for untreated and treated AKI kidney.
  • Comparison of mono-exponential and three non-Gaussian diffusion models in characterizing low- and high-grade clear cell renal cell carcinoma
    Bowen Shi1, Ke Xue2, Yili Yin1, Qing Xu1, Binbin Shi1, Jing Ye1, and Yongming Dai2
    1Northern Jiangsu Province Hospital, Yangzhou, China, 2Shanghai United Imaging Healthcare, Shanghai, China
    This study evaluated the performance of FROC, DK, bi- and mono-exponential diffusion models in differentiating low- from high-grade ccRCCs. As a result, the diffusion parameters from the FROC model outperformed the other three models in characterizing ccRCC grades.
    Fig. 1: (a-h) A 59-year-old man with a high-grade ccRCC (WHO grade IV) in the left kidney. The lesion (red arrow) showed moderate signal intensity on T2-weighted image (a), (b-h) corresponding parametric maps (ADC, Ds, MD, MK, Dfroc, β and μ). (i-p) A 49-year-old woman with a low-grade ccRCC (WHO grade I) in the right kidney. The lesion (red arrow) showed high signal intensity on T2-weighted image (i), (j-p) corresponding parametric maps (ADC, Ds, MD, MK, Dfroc, β and μ).
    Fig. 3: (a) ROC curves of the diagnostic performance of Dfroc, 𝛽, 𝜇, MD and MK values in distinguishing high- from low-grade ccRCCs. (b) ROC curves of the diagnostic performance of ADC and Ds values in distinguishing high- from low-grade ccRCCs.
  • The predictive value of contrast-enhancement MR evaluating the efficacy of preoperative  targeted drugs for renal carcinoma with tumor thrombus
    Pei Xinlong1 and Yuan Huishu2
    1Radiology Department, Peking University Third Hospital, Beijing, China, 2Peking University Third Hospital, Beijing, China
    MR can be used to predict the efficacy of targeted drugs before operation of renal carcinoma with tumor thrombi. Tumor and thrombi with more abundant blood supply tend to be more sensitive to drugs. It is helpful to evaluate the range of tumor thrombus invading IVC wall more accurately.
    The axial contrast-enhancement image shows the tumor thrombus after using targeted drugs (figure 4)shrinking compared with before medication(figure 3) and invading the right side wall of IVC.
    See above
  • Diffusion Tensor Imaging in the Differential Diagnosis of Clear Cell Renal Cell Carcinoma invasion pelvis and Transitional Cell Carcinoma
    Jinghong Liu1, Mingzhe Xu2, Ailian Liu1, Qingwei Song1, Lihua Chen1, Ru Cao1, Weilin Li1, and Juan Ruan1
    1Radiology, First Affiliated Hospital of Dalian Medical University, Dalian, China, 2Henan Cancer Hospital, Henan, China
    In this study, a higher ADC value was observed in ccRCC group and a higher FA value was observed in RTCC group.
    Table 1 ADC values, FA values of ccRCC and TCC by two observers and ICC values.
    Table 2 Comparison of ccRCC and TCC with ADC values and FA values
  • Differential diagnosis of clear renal cell carcinoma and renal angiomyolipoma without visible fat by IDEAL-IQ sequence
    Xinmiao Bu1, Ailian Liu1, Jinghong Liu1, Qingwei Song1, Juan Ruan2, Weilin Li2, and Ru Cao2
    1The First Affiliated Hospital of Dalian Medical University, Dalian, China, 2Dalian Medical University, Dalian, China
    In this paper, we discuss the R2* value and FF value of IDEAL-IQ sequence to differentiate ccRCC from RAMLwvf. The results show that the AUC values of R2* and FF were 0.893 and 0.905 respectively,which made it possible to identify the ccRCC from RAMLwvf before operation.
    Fig. 1 The ROI placed in focus area. The white arrow indicated the lesion area. A&B A 55 years old male patient with clear renal cell carcinoma. A was R2* image,the R2* value was 19.5Hz. B was FF image,the FF value was 3.7. B&C A 60 years old female patient of renal angiomyolipoma without visible fat. C was R2* image,the R2* value was 38.7Hz. D was FF image,the FF value was 25.1.
    Fig 2.The ROC curve of R2* and FF value to diagnose ccRCC with RAMLwvf.
  • Effect of metabolic syndrome on anatomy and function of the lower urinary tract
    Cody Johnson1, Alex Tannenbaum1, Samuel Koebe1, Lucille Anzia1, Lu Mao2, Matthew Grimes3, Diego Hernando1, Alejandro Roldán-Alzate1,4,5, and Shane Wells1
    1Radiology, University of Wisconsin-Madison, MADISON, WI, United States, 2Biostatics and Medical Informatics, University of Wisconsin-Madison, Madison, WI, United States, 3Urology, University of Wisconsin-Madison, Madison, WI, United States, 4Biomedical Engineering, University of Wisconsin-Madison, MADISON, WI, United States, 5Mechanical Engineering, University of Wisconsin-Madison, Madison, WI, United States
    Metabolic syndrome contributes to anatomic and functional changes of the lower urinary tract in men.
    Table 1: Comparison by metabolic syndrome status in males and females. Variables are summarized by median (IQR). P-values are based on win ratio (LUTS score) or Wilcoxon rank sum test (volume measurements)
    Table 2: Comparison by LUTS score in Males and Females. Binary variables are summarized by N (%), quantitative variables by median (IQR). P-values are based on chi-square (met syndrome) or Wilcoxon rank sum test (volume measurements)
  • In Vivo Assessment Of Metabolic Abnormality In Alport Syndrome Using Hyperpolarized [1-13C]Pyruvate MR Spectroscopic Imaging
    Nguyen Trong Nguyen1, Ilwoo Park2,3, Ngoc Luu Do2, Tien Anh Nguyen2, Sang Heon Suh 4, Eun Hui Bae4, and Sang Soo Shin2
    1Department of Biomedical Science, Chonnam National University, Gwangju, Korea, Republic of, 2Department of Radiology, Chonnam National University Medical School and Hospital, Gwangju, Korea, Republic of, 3Department of Artificial Intelligence Convergence, Chonnam National University, Gwangju, Korea, Republic of, 4Department of Internal Medicine, Chonnam National University Hospital, Gwangju, Korea, Republic of
    In this studies, we show the potential of Hyperpolarized MRI 13C technique to detect the abnormal metabolic activity of kidney in Alport Syndrome.


    Figure 3. The comparison of normalized lactate and normalized pyruvate between knockout and wildtype at different time points.
    Figure 2. Temporal changes in metabolites. Normalized lactate for knock-out and normalized pyruvate for wildtype are shown between 4 and 7 week-old
  • Intravoxel Incoherent Motion Diffusion-weighted MRI in Kidneys of Acute Leukemia and Its Clinical Significance: A Pilot Study
    Jianting Li1, Jinliang Niu1, and Rong Zheng2
    1The second hospital of Shanxi medical university, Taiyuan, China, 2The first hospital of Shanxi medical university, Taiyuan, China

    Intravoxel incoherent motion MRI may offer an opportunity to identify early changes in renal function in acute leukemia.

    Figure 1. Intravoxel incoherent motion diffusion-weighted MRI parametric maps in a 25-year-old man with AL. (a), ADC mapping. renal cortex ADC= 2.23×10⁻³mm2/sec, renal medulla ADC=1.83×10⁻³mm2/sec, (b), D mapping. renal cortex D= 2.10×10⁻³mm2/sec, renal medulla D=1.70×10⁻³mm2/sec, (c), f mapping. renal cortex f= 30.6%, renal medulla f=17.5%, (d), D* mapping. renal cortex D*= 62×10-3mm2/sec, renal medulla D*=65×10-3mm2/sec.
    Figure 2. Intravoxel incoherent motion diffusion-weighted MRI parametric maps in a 25-year-old volunteer. (a), ADC mapping. renal cortex ADC= 2.34×10⁻³mm2/sec, renal medulla ADC=2.13×10⁻³mm2/sec, (b), D mapping. renal cortex D= 2.01×10⁻³mm2/sec, renal medulla D=1.95×10⁻³mm2/sec, (c), f mapping. renal cortex f= 27.2%, renal medulla f=20.0%, (d), D* mapping. renal cortex D*= 68×10-3mm2/sec, renal medulla D*=63×10-3mm2/sec.
  • Can Diffusion Weighted MRI Predict the Response Prior to Neoadjuvant Chemotherapy in Patients with Muscular Invasive Bladder Cancer?
    Xinxin Zhang1 and Yan Chen1
    1Department of Imaging Diagnosis, National Cancer Center/National Clinical Research Center for Cancer/Cancer Hospital,Chinese Academy of Medical Sciences and Peking Union Medical College, BeiJing, China
    The baseline ADC value before treatment could not predict tumor response to NAC in patients with MIBC. After NAC treatment, the ADC value of responders increased significantly.
    Table 1 Mean Values of pre- and post-NAC, and percentage increases in ADC, Between Responders and Non-responders
    Figure 1: Images obtained in a 69-year-old man with muscular invasive bladder cancer who was a responder (pT2N0M0). (a, d) pre-NAC (a) and post-NAC (d) Axial T2 weighted image. (b, e) pre-NAC (b) and post-NAC (e) DWI Imaging (b=1000 s/mm2). In b, maximal diameter of the hyperintense signal mass was 2.6 cm. In e, tumor regressed with a maximum diameter of 0.6cm. The tumor diameter was reduced by 77%. (c, f) pre-NAC (c) and post-NAC (f) ADC maps. In c, the mass mean ADC was 1.21×10 -3 mm2/s. In f, NAC increased the mean ADC of this lesion to 2.11×10 -3 mm2/s.