-
Spiral diffusion imaging at 800 µm resolution using a scanner with 300 mT/m gradients and gradient field monitoring
Luke Joel Edwards1, Kerrin J. Pine1, Shubhajit Paul1, Fakhereh Movahedian Attar1, Michael Herbst2, Mirsad Mahmutović3, Boris Keil3, Harald Möller4, Evgeniya Kirilina1,5, and Nikolaus Weiskopf1,6
1Department of Neurophysics, Max Planck Institute for Human Cognitive and Brain Sciences, Leipzig, Germany, 2Gengenbach, Germany, 3Institute of Medical Physics and Radiation Protection, TH Mittelhessen University of Applied Sciences, Giessen, Germany, 4NMR Group, Max Planck Institute for Human Cognitive and Brain Sciences, Leipzig, Germany, 5Center for Cognitive Neuroscience Berlin, Freie Universität Berlin, Berlin, Germany, 6Felix Bloch Institute for Solid State Physics, Leipzig University, Leipzig, Germany
A spiral diffusion imaging protocol at 800 µm resolution using a scanner with 300 mT/m gradients and gradient field monitoring shows potential for enhancing the imaging of fine iron-rich regions of the brain.
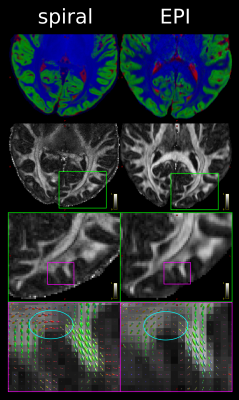
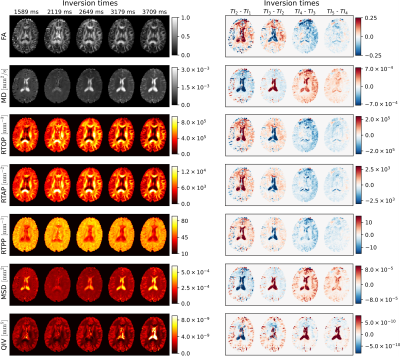
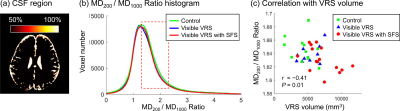
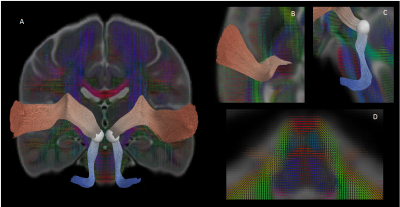
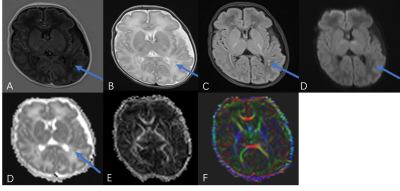
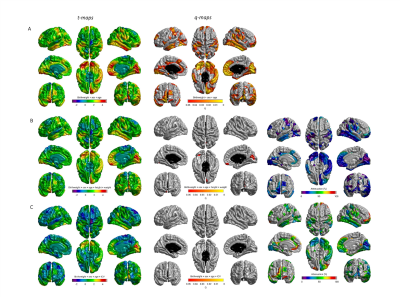
Figure 1: Comparison of spiral and EPI in the occipital lobe. Top: RGB segmentations of DWI data using multi-tissue CSD show better definition of the cortex in the spiral acquisition. Middle: Fractional anistropy (FA) maps further demonstrate the higher effective resolution of the spiral, i.e. less blurring. Bottom: fODFs seem to be more prominent for the iron-rich U-fibres connecting the two gyri (cyan ovals) in the spiral acquisition (short TE) than EPI (long TE). The same glyph scaling was used for both.
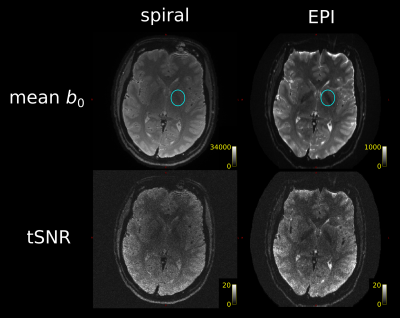
Figure 2: Spiral and EPI data show similar tSNR distributions. The anterior-left (top right of each figure panel) artefact is due to a fiducial oil capsule attached to the subject's forehead. The longer TR of the EPI acquisition resulted in higher cerebrospinal fluid (CSF) signal in the ventricles and near the surface of the brain. The contrast in the putamen (cyan ovals), an iron-rich deep grey matter structure, shows distinct differences between the spiral and EPI because of the different TEs.
-
Anisotropic transverse relaxation in the human brain white matter induced by restricted rotational diffusion
Yuxi Pang1
1Dept. of Radiology, University of Michigan, Ann Arbor, MI, United States
Anisotropic R2 and R2* relaxation has been documented in white matter, yet the
underlying relaxation mechanisms still remain not well understood. This work is
to propose a generalized magic angle effect model to better
characterize the reported anisotropic transverse relaxation.
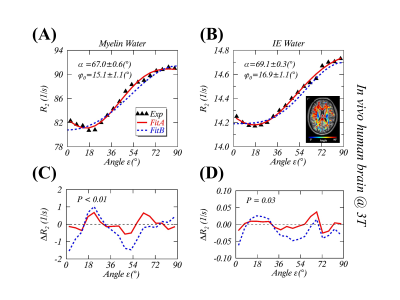
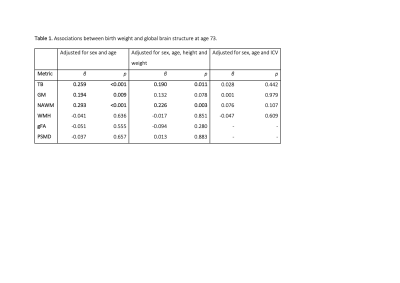
FIGURE 2. Measurements and modeling of anisotropic $$$R_2$$$ in the human
brain white matter in vivo at 3T. The measured
(black triangle) and the fitted anisotropic myelin water $$$R_2$$$ (2A) and
intra- and extracellular (IE) water $$$R_2$$$ (2B) using
the gMAE model with a phase offset $$$φ_0$$$ (Fit A, solid red lines), and the previous model (Fit B, dashed blue lines) without $$$φ_0$$$ from the
original publication [REF. 2]. The fitting residuals, defined as $$$ΔR_2$$$=Fitted-Measured, are respectively shown for myelin water (2C) and IE water (2D).
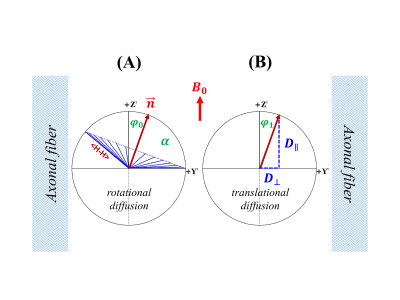
FIGURE 3. A schematic of water molecular restricted rotational diffusion (3A) and anisotropic translational diffusion (3B) in the human brain white matter.
-
High-Resolution Post-Mortem Diffusion MRI Acquisitions for Connectivity Analyses in Chimpanzees
Cornelius Eichner1, Michael Paquette1, Guillermo Gallardo1, Christian Bock2, Jenny E. Jaffe3,4, Carsten Jäger1, Evgeniya Kirilina1,5, Ilona Lipp1, Toralf Mildner1, Torsten Schlumm1, Felizitas C Wermter2, Harald E. Möller1, Nikolaus Weiskopf1, Catherine Crockford4,6, Roman Wittig4,6, Angela D Friederici1, and Alfred Anwander1
1Max Planck Institute for Human Cognitive and Brain Sciences, Leipzig, Germany, 2Alfred Wegener Institute Helmholtz Centre for Polar and Marine Research, Bremerhaven, Germany, 3Project Group Epidemiology of Highly Pathogenic Microorganisms, Robert Koch Institute, Berlin, Germany, 4Tai Chimpanzee Project, Centre Suisse de Recherches Scientifiques en Cote d'IVoire, Abidjan, Cote D'ivoire, 5Center for Cognitive Neuroscience Berlin, Freie Universität Berlin, Berlin, Germany, 6Max Planck Institute for Evolutionary Anthropology, Leipzig, Germany
Using chimpanzee post-mortem brains
and a comparison between different MRI systems, we showcase the highest
resolution dMRI data yet recorded in chimpanzees. Our research opens the option
of developmental and evolutionary research on structural brain connectivity.
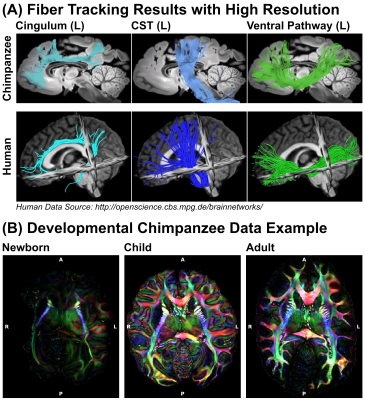
Figure 5: Reconstructions from
Preclinical MRI System - (A) The high-resolution dMRI data, acquired using the preclinical 9.4T MRI, enabled tractography on fine spatial levels. Three respective tract
reconstructions are depicted: Cingulum (turquoise), Corticospinal Tract (blue) and
Ventral Pathway (green) (B) Diffusion data were acquired from various
age groups, enabling a developmental comparison between chimpanzees.
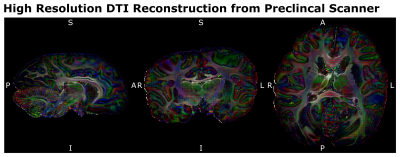
Figure 4: Preclinical Scanner
Acquisition Data Quality - The 500µm isotropic high-resolution dMRI data,
acquired at the preclinical 9.4T MRI system allowed mapping the structural
connectivity of the chimpanzee brain with unprecedented image resolution. (LR –
Left Right, AP – Anterior Posterior, SI – Superior Inferior)
-
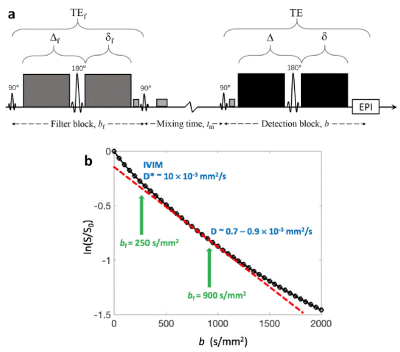
IVIM quantification and b-value optimization using deep neural network
Wonil Lee1, Byungjai Kim1, Jongyeon Lee1, and HyunWook Park1
1KAIST, Daejeon, Korea, Republic of
The trained DNN and the optimized b-values
by the proposed method quantified IVIM parameters more accurately than
combination of the conventional b-value optimization schemes with DNN fitting
method.
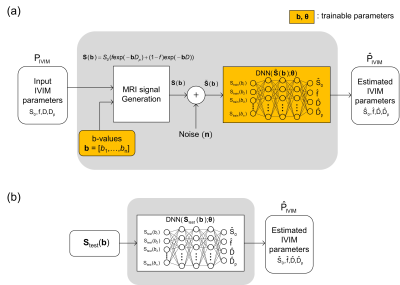
Figure 1.
Overall diagram of the proposed IVIM quantification method using DNN. a)
Diagram for training of DNN and for optimizing of b-values. b) Diagram for
quantification of IVIM parameters from the diffusion-weighted MRI signals.
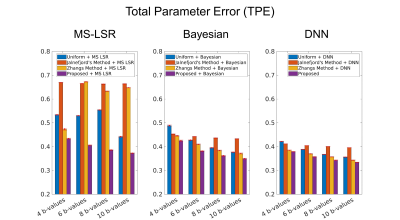
Figure 3. Total parameter errors of the IVIM parameters
from the three estimation methods (MS-LSR fitting, Bayesian fitting, and DNN) when
the diffusion weighted images were acquired using the b-values optimized by
uniform sampling, Jalnefjord’s method, Zhang’s method, and the proposed method.
The red error bar indicates the standard deviation obtained from 50
simulations.
-
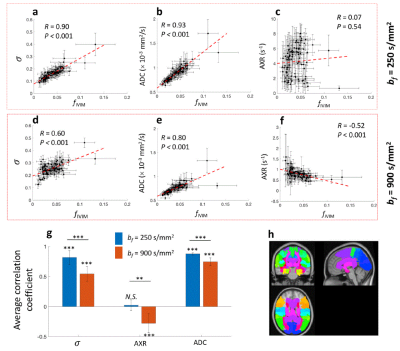
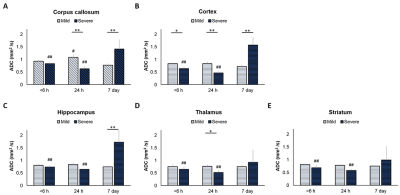
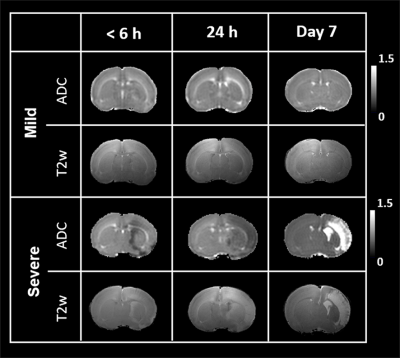
Technical performance of ADC and IVIM measurements in glioma and normal brain on a 1.5T MR-Linac
Liam S. P. Lawrence1, Rachel W. Chan2, Hanbo Chen3, Brian Keller3, James Stewart3, Mark Ruschin3, Brige Chugh3,4, Mikki Campbell3, Aimee Theriault3, Greg J. Stanisz1,2,5, Scott MacKenzie3, Sten Myrehaug3, Jay Detsky3, Pejman J. Maralani6, Chia-Lin Tseng3, Greg J. Czarnota1,2,3, Arjun Sahgal3, and Angus Z. Lau1,2
1Medical Biophysics, University of Toronto, Toronto, ON, Canada, 2Physical Sciences, Sunnybrook Research Institute, Toronto, ON, Canada, 3Department of Radiation Oncology, Sunnybrook Health Sciences Centre, Toronto, ON, Canada, 4Department of Physics, Ryerson University, Toronto, ON, Canada, 5Department of Neurosurgery and Paediatric Neurosurgery, Medical University of Lublin, Lublin, Poland, 6Department of Medical Imaging, University of Toronto, Sunnybrook Health Sciences Centre, Toronto, ON, Canada
1.5T MR-Linac measurements of the apparent diffusion coefficient are accurate and sufficiently precise to detect change in glioma; intravoxel incoherent motion blood volume fraction may be biased and insufficiently precise to detect tumour changes.
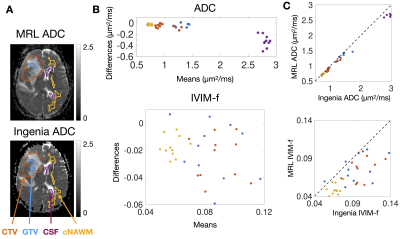
Figure 2 – Bland-Altman plots of median ADC and IVIM-f measured on the MRL versus the Ingenia: (A) shows ADC maps from the MRL and the Ingenia from the same patient on the same day. The contours are the GTV (blue), CTV (orange), cNAWM (yellow), and CSF (purple). Bland-Altman plots of the ADC and IVIM-f are shown in (B), with points coloured by ROI. (C) shows plots of Ingenia versus MRL ADC and IVIM-f.
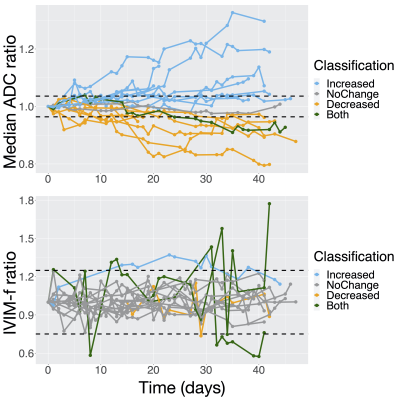
Figure 5 – ADC and IVIM-f measurements in the GTV during radiotherapy: (A) and (B) show the median ADC and IVIM-f ratio (value at a session normalized by baseline value) over the GTV as a function of time from the first fraction. The thresholds for statistically significant change (100% ± $$$\text{%RC}$$$) are shown as dashed lines: the classification is based on whether a change was detected at any session.
-
A new superficial white matter connectivity atlas of the chimpanzee brain
Maëlig Chauvel1, Ivy Uszynski1, William Hopkins2, Jean-François Mangin1, and Cyril Poupon1
1Université Paris-Saclay, CEA, CNRS, BAOBAB, Neurospin, Gif-sur-Yvette, France, 2Keeling Center for Comparative Medicine and Research, The University of Texas MD Anderson Cancer Center, Bastrop, TX, United States
Thanks to a cohort of 39 chimpanzee subjects provided by the NYPRC from Atlanta, we present here the the first atlas of the superficial white matter bundles of the chimpanzee brain, established using diffusion MRI-based tractography and advanced fiber clustering techniques.
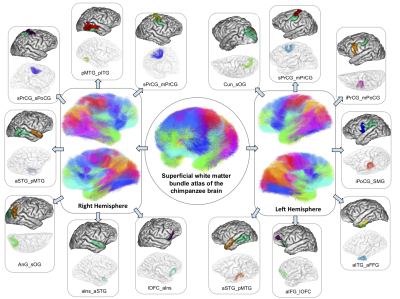
Figure 3. Superficial white matter bundle atlas of the chimpanzee brain (center), with a detailed vision of some U-fibers found in the right (on the left) and left hemispheres (on the right). Abbreviations : a,s,p,m,l : anterior, superior, posterior, medial, lateral ; AnG : Angular gyrus, Cun : Cuneus, FFG : Fusiform gyrus, IFG : Inferior frontal gyrus, ITG : Inferior temporal gyrus, OFC : Orbitofrontal cortex, OG : Occipital gyrus, lns : Insula, MTG : Middle temporal gyrus, PoCG : Postcentral gyrus, PrCG : Precentral gyrus, SMG : Supramarginal gyrus, STG : Superior temporal gyrus.
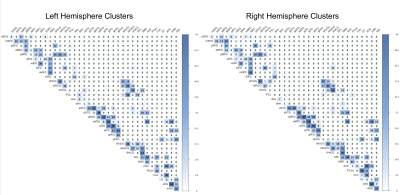
Figure 2. Matrices of the number of clusters found for each pair of regions of the left and right hemisphere superficial white matter bundles atlas. The color bar intensity is related to the number of clusters, in total, 2189 / 2182 clusters found for the left/right hemispheres.
-
Internal gradient distribution tensors of white matter tracts models
Jesus E. Fajardo1 and Gonzalo A. Álvarez1,2,3
1Centro Atómico Bariloche, CONICET, CNEA, 8400, San Carlos de Bariloche, Argentina, 2Instituto Balseiro, CNEA, Universidad Nacional de Cuyo, 8400, San Carlos de Bariloche, Argentina, 3Instituto de Nanociencia y Nanotecnología, CONICET, CNEA, San Carlos de Bariloche, Argentina
We predict the potential of extracting structural parameters of axon models measuring the variance of internal gradient distributions with modulated gradient spin echo sequences.

Fig 1: Axon distribution and internal gradient simulations. (a) Matrix encoding with ones (myelin sheath) and zeros (intra and extra axonal water) describing the axonal structure. (b) Internal Gradient G0 component along the x axis. (c) Histogram of the x axis internal gradient component. The histogram width is given by the standard deviation of the G0 strength distribution.
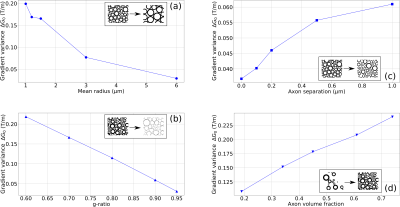
Fig 2: Internal gradient distribution width ΔG0 variations as a function of the mean axon radius (a), the g-ratio (b), the minimum axon separation (packing density) (c) and Axon Volume Fraction (AVF) (d).
-
Resolution and b Value Dependent Structural Connectome for Ex Vivo Mouse Brain
Stephanie Allan Crater1 and Nian Wang2
1Duke University, Durham, NC, United States, 2Radiology and Imaging Sciences, Indiana University, Indianapolis, IN, United States
The optimized b value for ex vivo mouse brain structural connectivity
The effects of spatial resolution and angular resolution for brain connectivity
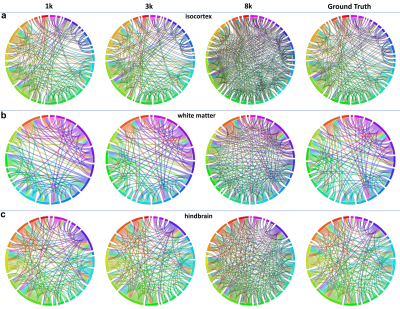
Figure 4. The connectivity maps in isocortex, white matter, and hindbrain regions. High b value (8000 s/mm2) results in more false-positive connections and low b value (1000 s/mm2) results in more false-negative connections.
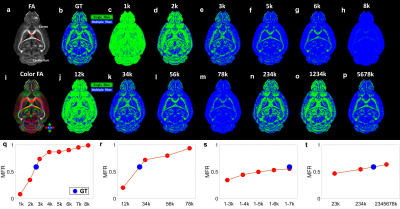
Figure 2. The crossing fibers resolved at different combination of b values. The multiple-fiber ratio (MFR) gradually increases with b value and becomes more stable with more shells/higher angular resolution.
-
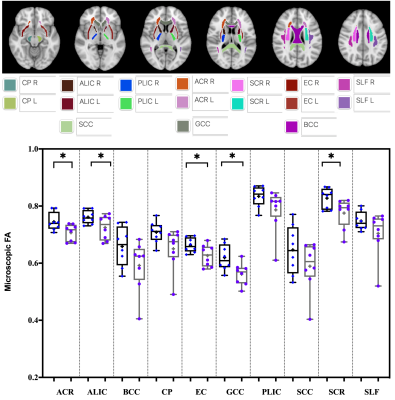
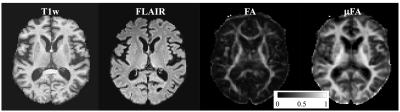
In Vivo Diffusion Tensor Distribution MRI of the Human Brain Using 300 mT/m Gradients
Kulam Najmudeen Magdoom1, Alexandru V. Avram1, Dario Gasbarra2, Qiuyun Fan3, Thomas Witzel3, Susie Y Huang3, and Peter J Basser1
1National Institute of Health, Bethesda, MD, United States, 2University of Helsinki, Helsinki, Finland, 3Massachusetts General Hospital and Harvard Medical School, Charlestown, MA, United States
A new experimental design and analysis technique is introduced to make an unbiased estimate of mean and covariance tensors of diffusion tensor distribution. Applying it in-vivo on a human brain revealed new information about brain microstructure.
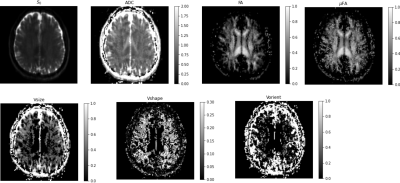
Figure 4: DTD results with the brain showing the estimated parametric maps. S0 – Non-diffusion weighted MRI, FA - fractional anisotropy map, μFA - microscopic FA map, ADC - apparent diffusion coefficient, Vsize, Vshape, Vorient – Size, shape and orientation heterogeneity metrics. The units for ADC and Vsize are in μm2/ms.
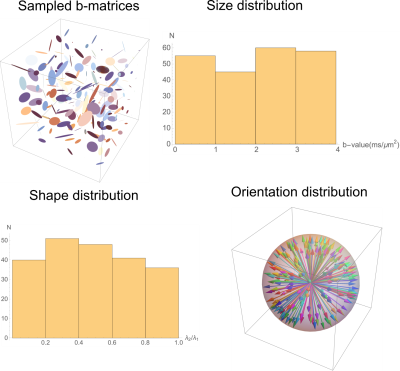
Figure 2: Experimental design showing the prescribed b-matrices shown using ellipsoids (top left), and the distribution of b-values (top right), shapes characterized by ratio of the two non-zero eigenvalues of rank-2 b-matrix (bottom left) and orientation dispersion (bottom right) they produce obtained by random sampling.
-
A Deep Learning Method for Connectome Reconstruction Using Clinical MRI Protocols
Rui Zeng1, Jinglei Lv2, He Wang3, Luping Zhou2, Michael Barnett2, Fernando Calamante2, and Chenyu Wang2
1School of Biomedical Engineering, The University of Sydney, Sydney, Australia, 2The University of Sydney, Sydney, Australia, 3Fudan University, Shanghai, China
A deep learning model called FODSRM was developed for fiber
orientation distribution (FOD) super-resolution, which enhances single-shell
FOD computed from clinic-quality dMRI data to obtain the
super-resolved quality that would have been produced
from advanced research scanners.
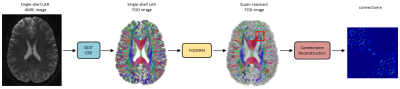
Figure 1. An
overview of the pipeline for applying FODSRM in connectome reconstruction. A
given single-shell low-angular-resolution (LAR) dMRI image is first processed
by single-shell 3-tissue CSD method to generate the single-shell LAR FOD image,
which is then taken as input by FODSRM to generate the super-resovled FOD
image. The super-resolved FOD image is used for reliable connectome reconstruction.
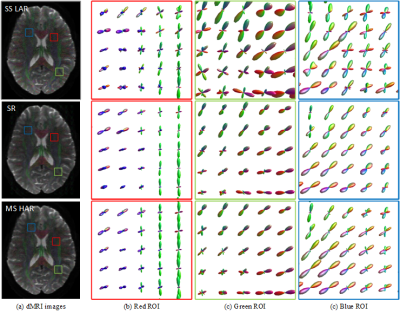
Figure 2. Illustration of FOD super
resolution. Our model is able to generate high-angular-resolution (HAR) FOD
images by enhancing the corresponding low-angular-resolution (LAR) FOD images.
The LAR FOD images are obtained with SS3T-CSD on single-shell
low-angular-resolution (typically around 32 gradient directions) data, which
are extensively used for clinical purposes. The recovered HAR FOD images have
comparable quality to those from MSMT-CSD. Three representative zoomed regions
(red, green and blue) are shown.
-
Estimation of individual brain signature and node-wise sensibility by a community-based DW-MRI connectome analysis
Juan Luis Villarreal Haro1,2, Gabriel Girard1,3,4, Jean Philippe Thiran1,4, and Alonso Ramírez-Manzanares2
1Signal Processing Lab (LTS5), École Polytechnique Fédérale de Lausanne, Lausanne, Switzerland, 2Computer Science Department, CIMAT, Centro de Investigación en Matemáticas, Guanajuato, Mexico, 3CIBM Center for BioMedical Imaging, Lausanne, Switzerland, 4Radiology Department, Centre Hospitalier Universitaire Vaudois and University of Lausanne, Lausanne, Switzerland
Our proposal improves the connectome identification from the same subject regardless of the variability in the construction. The detected structural changes between subjects could be used to distinguish structural changes associated with diseases.
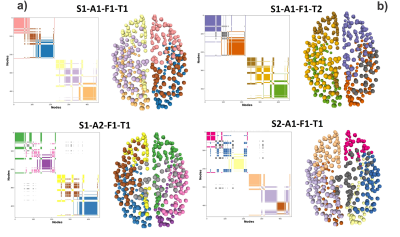
Figure 1. The Community Matrix (CoMi) is defined as the entry [n1,n2] =1 if the nodes n1 and n2 belong to the same community, otherwise zero. In the matrices visualization, white is zero, and the colors are one. Different colors represent different network communities. Note that the connectomes generated S1-A1-F1-T2 and S1-A1-F1-T2 only differ by tractography (T1 and T2), but they are not identical. They are as different as the CoMi of a different Subject S2-A1-F1-T1.
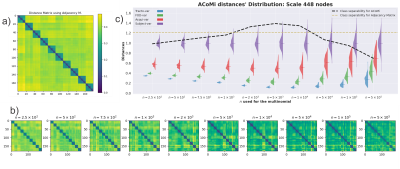
Figure 3 a) Matrix distances for the 180 connectomes constructed by using the L_{1,1} norm between adjacency matrices [2]. b) New distance matrices for ACoMi are generated for different $n$, c) for every distance matrix, the comparisons are reported separately: Traco-var, FOD-var, Acqui-var, and Subject-var. An optimization procedure is executed to estimate the $n$ that maximizes the geometric mean of the FDC (Fisher Discriminant Coefficient) and the mean error in the distributions.
-
Multimodal Apparent Diffusion (MAD) Magnetic Resonance Imaging with comprehensive quantification of diffusion in the brain
Frederick C. Damen1, Alessandro Scotti1, Frederick W. Damen2, Nitu Saran1, Tibor Valyi-Nagy3, Mirko Vukelich1, and Kejia Cai1
1Radiology, University of Illinois at Chicago, Chicago, IL, United States, 2Biomedical Engineering, Purdue University, West Lafayette, IN, United States, 3Pathology, University Of Illinois at Chicago, Chicago, IL, United States
With accurate and comprehensive fitting of the distributions of
apparent
diffusion for GM and WM, MAD MRI may be
utilized for comprehensively study microstructural changes of brain
under healthy and pathological conditions.
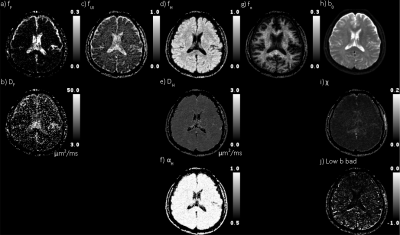
Figure 2 Quad-modal parameter maps. First four columns are flow, and
unimpeded, hindered,
and restricted diffusion, respectively. The top row are
the fractions of the DWI signal explained by each mode of diffusion
(gradient) weighting. The second row is
the pseudo perfusion and diffusivity (μm2/ms). The bottom
row is the stretch exponential shape parameter. The rightmost column
shows the b0 map, χ (rms), and low b bad map
(rxy).
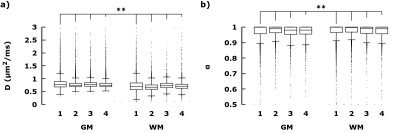
Figure 3 Distribution of Hindered
diffusion in GM vs WM in healthy brains. Boxplots (Gnuplot) of a)
DH, and b) αH, taken from slices comparable to figure 2 in
four healthy subjects. For each subject, each distribution between
GM(fH > 0.8) and WM(fR > 0.1) were statistically different
(Student t-test, P<0.05).
-
Anatomical connectivity of the anterior-posterior axis of the human hippocampus: new insights using quantitative fibre-tracking
Marshall Axel Dalton1, Arkiev D'Souza2, Jinglei Lv1, and Fernando Calamante3
1School of Biomedical Engineering, Faculty of Engineering, University of Sydney, Sydney, Australia, Sydney, Australia, 2DVC Research, Brain and Mind Centre, University of Sydney, Sydney, Australia, Sydney, Australia, 3Sydney Imaging, University of Sydney, Sydney, Australia, Sydney, Australia
We
observed striking differences in structural connectivity between
anterior/middle/posterior portions of the hippocampus and cortical regions and that
specific cortical regions may preferentially target circumscribed regions
within the hippocampus.
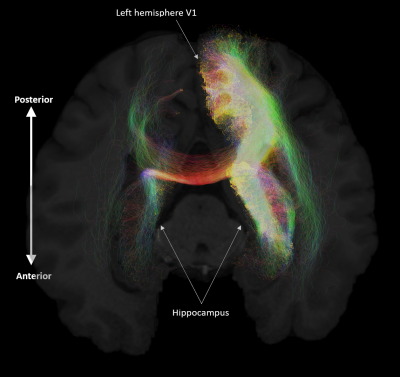
A representative example of streamlines connecting a specific cortical ROI and the bilateral hippocampus. (A) We present streamlines between the left hemisphere area V1 and bilateral hippocampus overlaid on a T1 structural scan viewed in the axial
plane for anatomical reference. Note the dense innervation of the ipsilateral
hippocampus and the comparatively weak innervation of the contralateral
hippocampus.
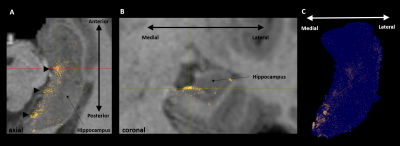
Representative
images showing (A) endpoints associated with streamlines between the left retrosplenial
cortex and left hippocampus overlaid on a T1 structural image viewed in the
axial plane. Note clusters of endpoints (marked by black triangles) along the
anterior-posterior axis of the hippocampus. (B) the coronal plane corresponding
with the red line in A. Note clusters are clearly localised in the medial
hippocampus. (C) A 3D rendering of endpoints overlaid on a transparent
hippocampus mask viewed in the axial plane.
-
Semi-automated assessment of the principal diffusion direction in the corpus callosum: application across brain diseases
Maria Eugenia Caligiuri1, Andrea Quattrone2, Alessandro Mechelli2, and Aldo Quattrone1
1Neuroscience Research Center, University "Magna Graecia", Catanzaro, Italy, 2Institute of Neurology, University "Magna Graecia", Catanzaro, Italy
Altered PDD orientation in the splenium underlies iNPH but not PSP or AD. Splenium fibers might be damaged in PSP and AD due to Wallerian degeneration, while in iNPH ventricles could "push" the bundle upwards, deviating the physiological laterolateral PDD of the callosal fibers.
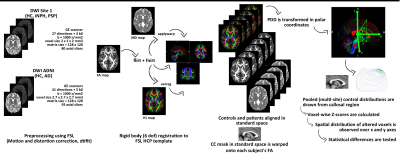
Figure 1: Image processing and analysis workflow.
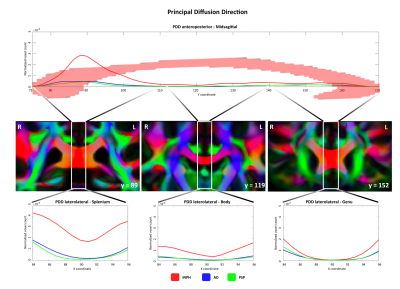
Figure 2. Top row: altered PDD voxel count compared to control distribution along the anteroposterior axis (z-scores for both theta and phi values > 2.5 or < -2.5). Middle row: CC splenium, body and genu in the coronal plane of PDD-color-coded FA template. Bottom row: altered PDD voxel count along the latero-lateral axis in CC subregions. Abbreviations: PDD = Principal Diffusion Direction; FA = Fractional Anisotropy; iNPH = idiopathic Normal Pressure Hydrocephalus; AD = Alzheimer’s Disease; PSP = Progressive Supranuclear Palsy.
-
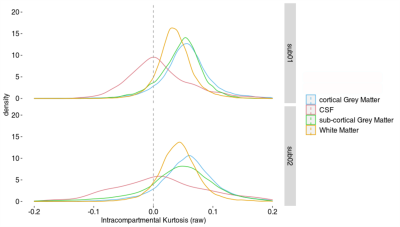
Harmonization of diffusion kurtosis imaging metrics with rotational invariant spherical harmonics (RISH) to remove cross-site biases
Alberto De Luca1,2, Suheyla Cetin Karayumak3, Alexander Leemans2, Yogesh Rathi3, Stephan Swinnen4,5, Jolien Gooijers4,5, Amanda Clauwaert4,5, Roald Bahr6, Stian Bahr Sandmo6, Nir Sochen7,8, David Kaufmann9, Marc Muehlmann10, Geert-Jan Biessels1, Inga K Koerte3,11, and Ofer Pasternak3
1Department of Neurology, University Medical Center Utrecht, Utrecht, Netherlands, 2PROVIDI Lab, Image Sciences Institute, University Medical Center Utrecht, Utrecht, Netherlands, 3Brigham and Women's Hospital, Harvard Medical School, Boston, MA, United States, 4Movement Control and Neuroplasticity Research Group, KU Leuven, Leuven, Belgium, 5Brain Institute, KU Leuven, Leuven, Belgium, 6Oslo Sports Trauma Research Center, Norwegian School of Sport Sciences, Oslo, Norway, 7Department of Applied Mathematics, Tel Aviv University, Tel Aviv, Israel, 8Sagol School of Neuroscience, Tel Aviv University, Tel Aviv, Israel, 9Department of Radiology, Charite University Hospital, Berlin, Germany, 10Department of Radiology, LMU Munich, Munich, Germany, 11cBRAIN, Department of Child and Adolescent Psychiatry, LMU Munich, Munich, Germany
The rotation invariant spherical harmonics (RISH) method allows to remove cross-site differences in diffusion kurtosis imaging (DKI) metrics while retaining longitudinal effects, posing a foundation for the application of DKI in large multi-site studies.
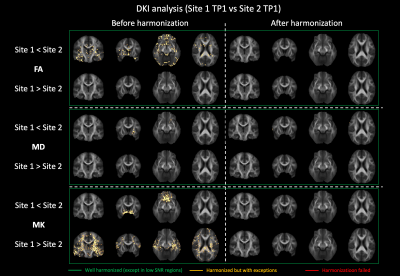
Figure 2: Voxel-wise comparison (t-test) of FA, MD and MK between Site 1 and Site 2 before and after harmonization. Significantly different voxels are shown as yellow overlay. After harmonization, all significant differences were removed.
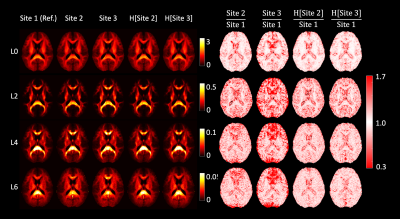
Figure 1: Harmonization of data at b = 2500 s/mm2. The left half of the image shows the RISH features of all three sites before and after harmonization (H[]). The right side shows the voxel-wise scaling between the RISH features of the harmonized site and the reference site. Before harmonization, large scaling can be observed for L0 in periventricular regions, and in L2/L4/L6 in frontal and occipital regions. After harmonization, the cross-site scaling is close to 1.
-
Subsampling Diffusion Gradients via Poisson Sphere Elimination
Ye Wu1, Sahar Ahmad1, Lei Ma1, Erkun Yang1, and Pew-Thian Yap1
1Biomedical Research Imaging Center, University of North Carolina, Chapel Hill, Chapel Hill, NC, United States
We show that the weighted Poisson sphere sample elimination can be used for robust uniform subsampling of diffusion gradient directions.
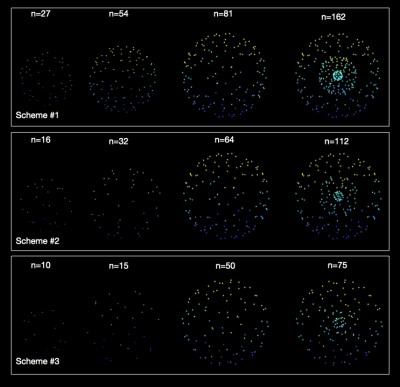
Figure 2. Multi-shell subsampling of the HCP directions for three different sampling schemes using the proposed method.
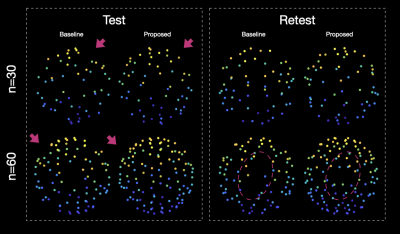
Figure 1. Subsampling the HCP gradients using the baseline method and the proposed method.
-
Subsampling an existing diffusion MRI multi-shell scheme: impact on histogram measures derived from DTI and DKI
Ana R Fouto1, Rita G Nunes1, Amparo Ruiz-Tagle1, Marc Golub1, Inês Esteves1, Athanasios Vourvopoulos1, Raquel Gil-Gouveia2, Andreia C Freitas1, Nuno A Silva3, and Patrícia Figueiredo1
1ISR-Lisboa/LARSyS and Department of Bioengineering, Instituto Superior Técnico, Universidade de Lisboa, Lisbon, Portugal, 2Neurology Department, Hospital da Luz, Lisbon, Portugal, 3Learning Health, Hospital da Luz, Lisbon, Portugal
To shorten exams, subsampling dMRI acquisitions may be desirable. Several histogram metrics of DTI and DKI maps showed a significant effect of subsampling, producing biased estimates. Hence, this should be carefully considered depending on the expected effect size on a patient’s population.
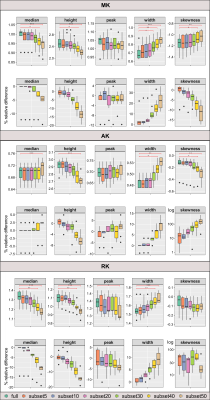
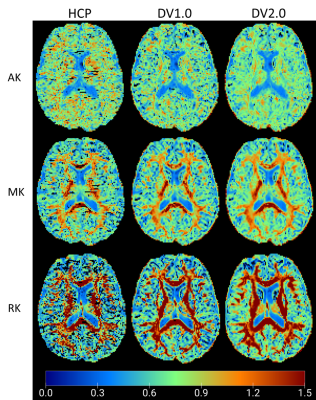
Figure 3 - Boxplots showing the distributions of: Top) histogram metrics extracted from the skeletonised DKI parameter maps (MK, AK, RK), in fully sampled (full) and respective subsets ; and Bottom) corresponding relative difference (in percentage) from the ground truth (full). Significant pairwise differences are indicated with ***p≤0.001; **p≤0.01;*0.01<p≤0.05.
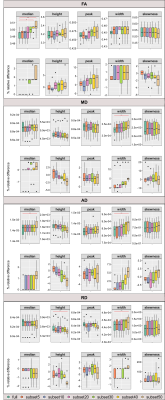
Figure 2 - Boxplots showing the distributions of: Top) histogram metrics extracted from the skeletonised DTI parameter maps (FA,MD,AD,RD), in fully sampled (full) and respective subsets ; and Bottom) corresponding relative difference (in percentage) from the ground truth (full). Significant pairwise differences are indicated with ***p≤0.001; **p≤0.01;*0.01<p≤0.05. MD, AD and RD are expressed in ×10−3 mm2/s.
-
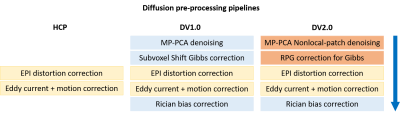
Evaluation of noise/signal leaking in PCA-based DWI denoising methods
Hu Cheng1
1Indiana University, Bloomington, IN, United States
We propose a novel but simple method to evaluate noise/signal leaking in PCA-based denoising for diffusion MRI. The results show that MP-PCA has little signal leaking than LPCA but more noise leaking.
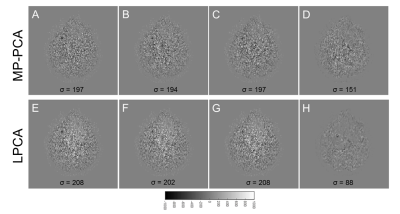
Fig. 3. (A, E) Extracted noise from full dataset; (B, F) Extracted noise from D1; (C, G) Extracted noise from D2; (D, H) Difference image between denoised image from D1 and denoised image from D2. Top panel is the results from MP-PCA and bottom panel is the results from LPCA.
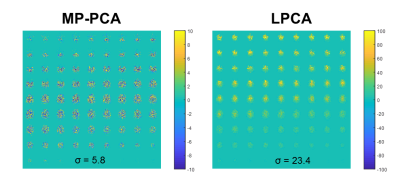
Fig. 4. Extracted noise for the extra mean volume appended to the DWI dataset by both MP-PCA and LPCA denoising.
-
On the generalizability of diffusion MRI signal representations across acquisition parameters: chronicles of the MEMENTO challenge.
Alberto De Luca1,2, Andrada Ianus3,4, Alexander Leemans2, Marco Palombo5, Hui G Zhang5, Daniel C Alexander5, Markus Nilsson6, Geert-Jan Biessels1, Mauro Zucchelli7, Matteo Frigo7, Enes Albay7,8, Sara Sedlar7, Abib Alimi7, Samuel Deslauriers-Gauthier7, Rachid Deriche7, Rutger Fick9, Maryam Afzali10, Tomasz Pieciak11,12, Fabian Bogusz11, Santiago Aja-Fernandez12, Evren Özarslan13,14, Derek K Jones10, Haoze Chen15, Mingwu Jin16, Zhijie Zhang15, Fengxiang Wang15, Vishwesh Nath17, Prasanna Parvathaneni18, Jan Morez19, Jan Sijbers19, Ben Jeurissen19, Shreyas Fadnavis20, Stefan Endres21, Ariel Rokem22, Eleftherios Garyfallidis20, Irina Sanchez23, Vesna Prchkovska23, Paulo Rodrigues23, Bennett A Landman24, and Kurt G Schilling24
1Department of Neurology, University Medical Center Utrecht, Utrecht, Netherlands, 2PROVIDI Lab, Image Sciences Institute, University Medical Center Utrecht, Utrecht, Netherlands, 3Champalimaud Research, Champalimaud Centre for the Unknown, Lisbon, Portugal, 4Centre for Medical Imaging Computing, University College London, London, United Kingdom, 5Centre for Medical Image Computing, University College London, London, United Kingdom, 6Clinical Science, Department of Radiology, Lund University, Lund, Sweden, 7Inria Sophia Antipolis – Méditerranée, Université Côte d'Azur, Sophia Antipolis, France, 8Istanbul Technical University, Instanbul, Turkey, 9Therapanacea, Paris, France, 10Cardiff University Brain Research, Imaging Centre (CUBRIC), School of Psychology, Cardiff University, Cardiff, United Kingdom, 11AGH University of Science and Technology, Krakow, Poland, 12LPI, ETSI Telecomunicacion, Universidad de Valladolid, Valladolid, Spain, 13Department of Biomedical Engineering, Linköping University, Linköping, Sweden, 14Center for Medical Image Science and Visualization, Linköping University, Linköping, Sweden, 15School of Instruments and Electronics, North University of China, Taiyuan, China, 16Department of Physics, University of Texas at Arlington, Arlington, TX, United States, 17NVIDIA Corporation, Bethesda, MD, United States, 18National Institute of Neurological Disorders and Stroke, National Institute of Health, Bethesda, MD, United States, 19Imec-Vision Lab, Department of Physics, University of Antwerp, Antwerp, Belgium, 20Intelligent Systems Engineering, Indiana University Bloomington, Bloomington, IN, United States, 21Leibniz Institute for Materials Engineering - IWT, University of Bremen, Bremen, Germany, 22Department of Psychology and the eScience Institute, University of Washington, Seattle, WA, United States, 23QMENTA Inc, Barcelona, Spain, 24Institute of Imaging Science, Vanderbilt University, Nashville, TN, United States
Existing diffusion MRI models can generally well predict single diffusion encoded data given a training subset, except for low and very strong weightings, whereas the accurate prediction of double (oscillating) diffusion encoding data is challenging.
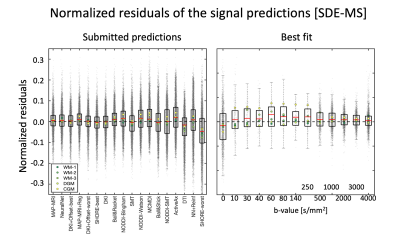
Figure 2: Left) Boxplots of the normalized residuals (gray dots) of each prediction of SDE-MS data, when pooling together all 5 signals. Right) The normalized residuals of the best prediction (MAP-MRI) over individual diffusion weightings. The red asterisks on the left panel indicate predictions significantly different from the best prediction, whereas those on the right indicate that residuals at a specific diffusion weighting show a significantly non-zero mean.

Table 1: The valid signal predictions submitted to the MEMENTO challenge. For each method, we report the acronym and the main reference, the “category”, special notes on the fit procedure, and the data it has been applied to. The following predictions were subdivided in the following categories: tensor-based (TENS), multi-compartment model (MCM), parametric representation (PAR), deep learning-based (DL).
-
Measurement of radiofrequency absorption and thermal diffusion coefficients of brain tissue
David H Gultekin1, Peter H Siegel2,3, John T Vaughan1, and John C Gore4
1Zuckerman Mind Brain Behavior Institute, Columbia University, New York, NY, United States, 2Jet Propulsion Laboratory, National Aeronautics and Space Administration, Pasadena, CA, United States, 3Department of Electrical Engineering, California Institute of Technology, Pasadena, CA, United States, 4Vanderbilt University Institute of Imaging Science, Nashville, TN, United States
It is important to quantify the radio frequency absorption and thermal diffusion in the tissues through the measurements of the absorption and thermal diffusion coefficients specific to the tissue properties.
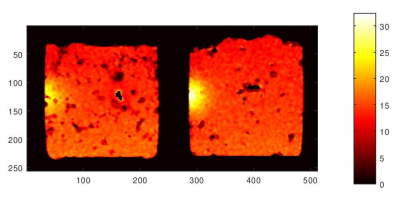
MRI temperature maps of ex vivo brain tissue exposed to a 1.9 GHz half wavelength (λ/2) dipole antenna placed on the left side of the container. The hot spots correspond to RF exposures of 12 minutes time and 2W power. These two images are from two different ex vivo brain tissues and experiments.
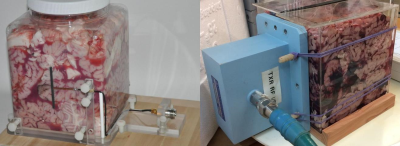
A 1.9 GHz half wavelength (λ/2) dipole antenna (left) and a 1.9 GHz rectangular waveguide (WR-430) RF source (right) placed against the ex vivo bovine brain tissue in the cubical plastic containers.