-
Time-averaged wall shear stress: a potential indicator for carotid intra-plaque hemorrhage
Rui Shen1, Huiyu Qiao1, Zihan Ning1, Dongye Li2, Dandan Yang1, and Xihai Zhao1
1Center for Biomedical Imaging Research, Tsinghua University, Beijing, China, 2Department of Radiology, Sun Yat-Sen Memorial Hospital, Sun Yat-Sen University, Guangzhou, China
In this study, TAWSS was found to be associated
with carotid IPH. In discriminating carotid IPH, the strength of combination
between TAWSS and plaque burden was higher than each measurement alone, which suggests that TAWSS is a potential indicator for carotid vulnerable
plaque features of IPH.
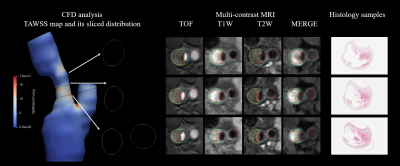
Figure 1. The demonstration of CFD analysis
parameters, to multi-contrast MRI images and histological images.
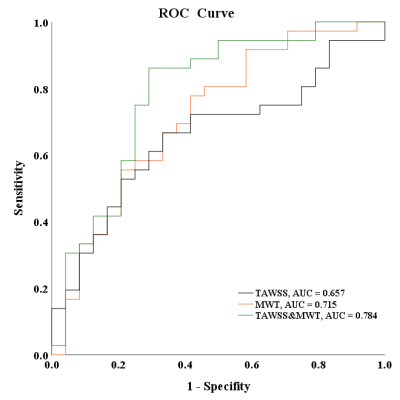
Figure 2. ROC curves of TAWSS combined with max
wall thickness (MWT) and normal wall index (NWI) in discriminating IPH.
(The black
line represents the ROC curves for predicting IPH with TAWSS. The orange and
green lines represent the ROC curves for predicting IPH with TAWSS of combined
MWT and of combined NWI.)
-
Multidimensional Diffusion MRI in the Ex Vivo Mouse Heart
Irvin Teh1, Samo Lasič2,3, Henrik Lundell3, Beata Wereszczyńska1, Matthew Budde4, Erica Dall'Armellina1, Nadira Yuldasheva1, Filip Szczepankiewicz5,6,7, and Jürgen E. Schneider1
1Leeds Institute of Cardiovascular and Metabolic Medicine, University of Leeds, Leeds, United Kingdom, 2Random Walk Imaging, Lund, Sweden, 3Danish Research Centre for Magnetic Resonance, Centre for Functional and Diagnostic Imaging and Research, Copenhagen University Hospital Hvidovre, Copenhagen, Denmark, 4Department of Neurosurgery, Neurobiology, and Anatomy, Medical College of Wisconsin, Milwaukee, WI, United States, 5Clinical Sciences, Lund University, Lund, Sweden, 6Harvard Medical School, Boston, MA, United States, 7Brigham and Women's Hospital, Boston, MA, United States
Multidimensional diffusion MRI has the
potential to improve specificity in cardiac diffusion MRI beyond that
achievable with DTI. We present initial data in ex vivo mouse hearts at 7T,
that demonstrate the feasibility and potential of the technique.
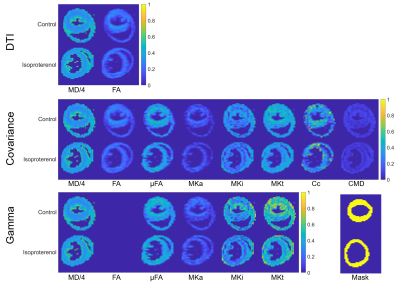
Figure 3. Parameter maps
in control and isoproterenol hearts generated by fitting the (top-bottom) DTI,
covariance and gamma models scaled to [0 1]. DTI and covariance methods yield
mean diffusivity (MD in µm2/ms) and fractional anisotropy (FA).
Additional maps of microscopic fractional anisotropy (µFA), mean anisotropic
kurtosis (MKa), mean isotropic kurtosis (MKi), mean total kurtosis (MKt), microscopic
orientation coherence (Cc) and normalised size variance (CMD) are shown, along
with ROI masks (bottom right).
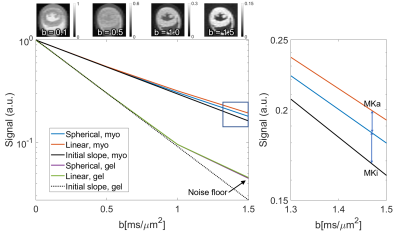
Figure
2. (Left) Normalised signal attenuation curves for spherical and linear tensor
encoding in myocardium (myo) of the control heart and gel. Non-monoexponential
behaviour of gel at high b was governed by noise. (Right) Zoomed section
showing signal kurtosis attributable to isotropic and anisotropic components
(MKi; MKa). (Top) Example LTE images averaged across diffusion directions.
-
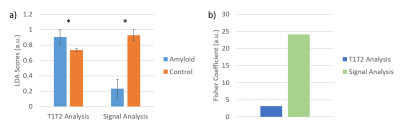
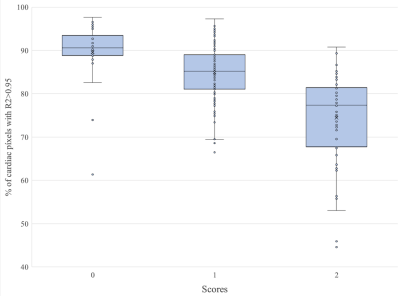
Conventional balanced SSFP magnetic resonance images reveal patterns of clinically suspected myocarditis using texture analysis
Evin Ina Papalini1, Christian Polte2, and Kerstin Magdalena Lagerstrand1
1Institute of Clinical Sciences, Sahlgrenska Academy, University of Gothenburg, Gothenburg, Sweden, Gothenburg, Sweden, 2Institute of Medicine, Sahlgrenska Academy, University of Gothenburg, Gothenburg, Sweden, Gothenburg, Sweden
The
non-contrast-based MRI technique balanced-SSFP displays quantitative texture features
in patients with clinically suspected myocarditis.
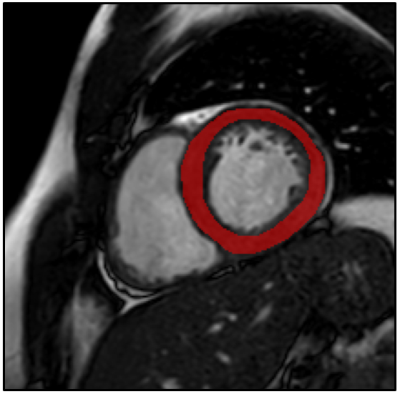
Figure
1. Example of a typical free-hand region
of interest drawn on a short axis bSSFP image, encompassing the left
ventricular myocardium.
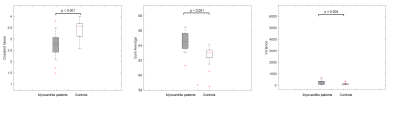
Figure 2. Box-Whisker
plots illustrating the differences for the significant texture features between
patients with myocarditis and controls on bSSFP images. The median is
represented by the centerline of the boxplot with upper and lower limits of
25th and 75th percentiles, respectively. The Whiskers extending from the boxes
indicates the most extreme values within 25th and 75th percentiles
±1.5*interquartile range; data points beyond the whiskers are displayed as +.
Texture features are dimensionless. bSSFP = balanced
steady-state-free-precession.
-
Imaging of cardiac skeleton without contrast agents
Yi Li1, Jiri Mares1, and Timo Liimatainen1
1Research Unit of Medical Imaging, Physics and Technology, University of Oulu, Oulu, Finland
We applied RAFFn to study contrast between cardiac skeleton and myocardium. We found the relationship
between relaxation times and RAFFn pulse duration. The optimal pulse duration
to gain maximum contrast was close to 2.5 ms. RAFF2 and T2 maps demonstrated higher
contrast compared to others.
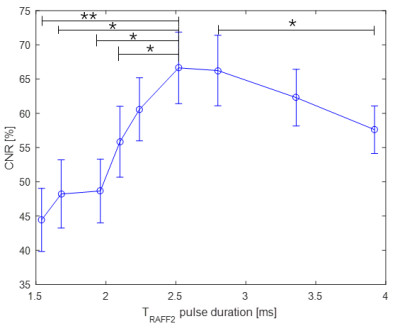
Figure 3. Relationship between CNR and TRAFF2 pulse duration. Mean and SEM of CNR, CNR, contrast to noise ratio. CNR
is calculated as follow CNR=[T(fibrous skeleton)-T(myocardium)]/σo(myocardium)×100%; σo, standard deviation of the noise; SEM, standard error of the mean.*p<0.05, **p<0.01, Paired two-tail Student’s t-test.
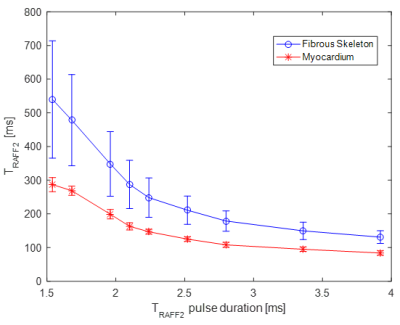
Figure 2. Relationship between relaxation times in fibrous skeleton and
myocardium areas and TRAFF2 pulse duration.
-
Microstructure-Based Simulation of Myocardial Diffusion Using Extended Volume Confocal Microscopy
Alexander James Wilson1, Kevin M Moulin2, Gregory B Sands3, and Daniel B Ennis2
1Radiology, Stanford University, Palo Alto, CA, United States, 2Radiology, Stanford University, Stanford, CA, United States, 3Auckland Bioengineering Institute, University of Auckland, Auckland, New Zealand
A physics-based diffusion tensor MRI simulation of a confocal tissue volume yielded a transmural
helix angle well matched to structure tensor analysis. Direct comparisons of confocal
tissue volumes with cardiac DTI are feasible and can provide insight to
experimental design.
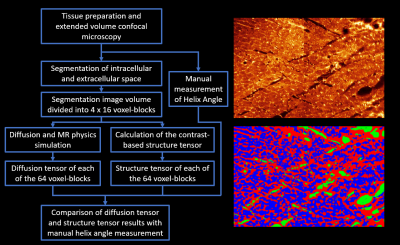
Figure
1: Overview of study design. (Left) Flow chart of the main study steps
from imaging, through segmentation and analysis to comparison of results. (Top Right) Histology image produced from the
extended volume confocal microscopy, presented using a ‘Glow’ look up
table. (Bottom right) The same image after
segmentation of the following compartments: intracellular (blue), extracellular
(red) and blood vessel/cleavage space (green).
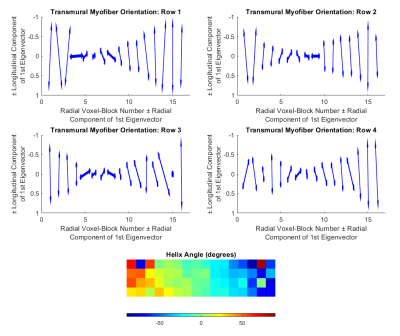
Figure 3: Results of the diffusion tensor
simulation. Vector representations of the primary
eigenvector of the diffusion tensor analysis from the four rows of voxel-blocks
(top row and middle row). Color maps of
the helix angle (bottom). The vector
plots show a transition from longitudinal myofibers at the epicardium, through
circumferential fibers at the mid-wall, to longitudinal fibers at the
endocardium.
-
Quantitative Susceptibility Mapping for Mitral Annulus Calcification Detection via Validation of Computed Tomography/Echocardiography
Jiahao Li1,2, Hannah Mitlak3, Lakshmi Nambiar3, Romina Tafreshi3, Jiwon Kim3, Yi Wang1,2, Jonathan W. Weinsaft3, and Pascal Spincemaille2
1Biomedical Engineering, Cornell University, Ithaca, NY, United States, 2Radiology, Weill Cornell Medicine, New York, NY, United States, 3Medicine, Weill Cornell Medicine, New York, NY, United States
Cardiac QSM is able to detect mitral annulus
calcification as confirmed by CT and echocardiography.
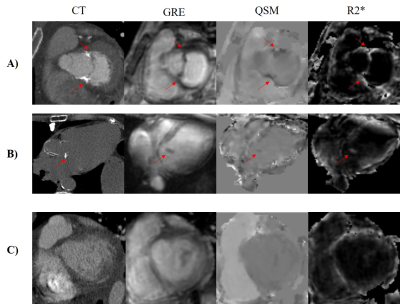
Figure 1. Gradient echo
(GRE), QSM and R2* in representative cases of A) moderate MAC, B) mild MAC, and
C) non-calcification. The corresponding computed tomography of each case is
shown in the first column as the reference for presence and severity of
calcification. The red arrows indicate the location of mitral annular
calcification.
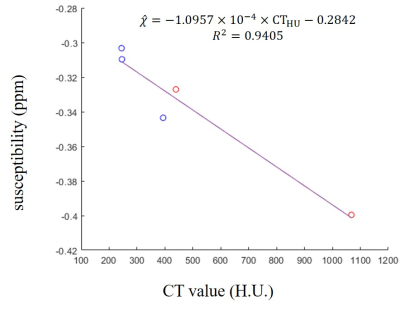
Figure 3. Correlation
between CT value and susceptibility in calcification regions from MAC patients.
Susceptibility detected by thresholding aligned well with CT reference as
linear relationship. H.U., Hounsfield unit; ppm, parts per million. Red points:
moderate calcification; blue points: mild calcification.
-
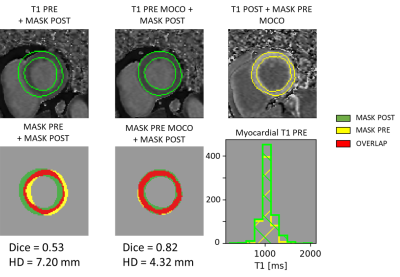
Microstructural CMR imaging in a longitudinal pig model of acute to chronic myocardial infarction
Christian T Stoeck1, Constantin von Deuster1, Maximilian Fuetterer1, Malgorzata Polacin1,2, Conny F Waschkies1, Robbert JH van Gorkum1, Mareike Kron3, Thea Fleischmann3, Nikola Cesarovic3,4, Miriam Weisskopf3, and Sebastian Kozerke1
1Institute for Biomedical Engineering, University and ETH Zurich, Zurich, Switzerland, 2Institute of Diagnostic and Interventional Radiology, University Hospital Zurich, Zurich, Switzerland, 3Division of Surgical Research, University Hospital Zurich, Zurich, Switzerland, 4Institute of Translational Cardiovascular Technologies, ETH Zurich, Zurich, Switzerland
Cardiac diffusion tensor imaging
shows great potential as non-contrast imaging method for assessing the dynamics
of myocardial infarction, when compared to native relaxometry.
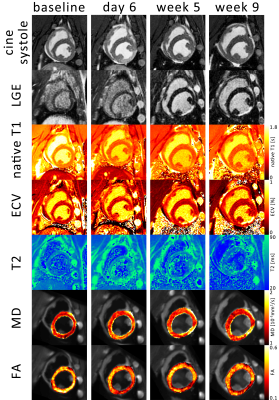
Figure 1: 1 Example images over
the time course of the experiment. The systolic timeframe shows hypocontraction
in the inferior lateral wall coinciding with late gadolinium enhancement (LGE),
native T1, extra cellular volume fraction (ECV), T2 mapping, mean diffusivity
(MD) and fractional anisotropy (FA).
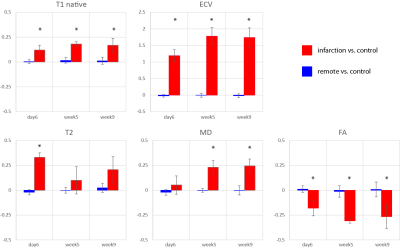
Figure 3 relative change in
native T1, extra cellular volume (ECV), T2, mean diffusivity (MD) and
fractional anisotropy (FA) in the infarcted area compared to the remote area.
Error bars indicate one standard deviation across cases. The asterisk indicates
statistically significanct (p<0.05)
difference compared to baseline contrast.
-
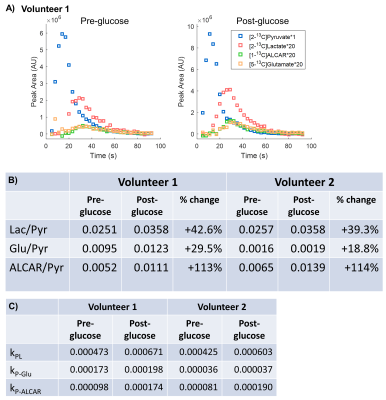
Metabolic changes in coronary artery disease assessed using 1H NMR Metabolomics
Pawan Kumar1, Uma Sharma1, Rajeev Narang2, and Sujeet Mewar1
1Nuclear Magnetic Resonance and MRI Facility, All India Institute of Medical Sciences, New Delhi, India, 2Cardiology, All India Institute of Medical Sciences, New Delhi, India
Significant differences in the concentration
of metabolites like lactate, pyruvate, choline, acetate and alanine in the
blood plasma of CAD patients compared to healthy controls indicating metabolic
abnormalities related to the development of CAD.
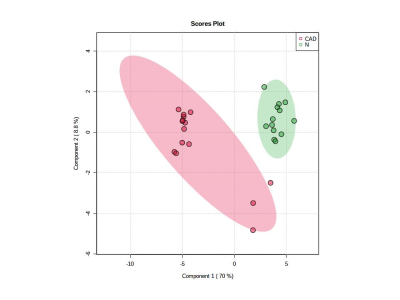
Figure 2: PLS-DA plot showing separation of patients with CAD (Red) from controls (Green).
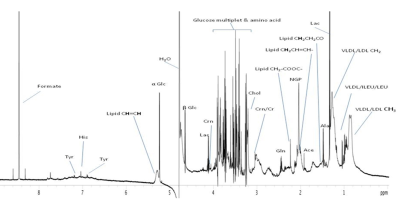
Figure 1: 1D 1H NMR spectrum of blood plasma of a patient with CAD acquired at 700 MHz.
-
Increased SNR and improved reproducibility for cardiac 31P MRS at 7T using compartmentalized spectroscopy
Andrew Tyler1,2, Justin Y C Lau1, Jane Ellis1, Jack J Miller1,2,3, Paul A. Bottomley4, Christopher T Rodgers1,5, Damian J Tyler1,2, and Ladislav Valkovic1,6
1Oxford Centre for Clinical Cardiac Magnetic Resonance Research, University of Oxford, Oxford, United Kingdom, 2Department of Physiology, Anatomy & Genetics, University of Oxford, Oxford, United Kingdom, 3Department of Physics, University of Oxford, Oxford, United Kingdom, 4The Division of MR Research, Johns Hopkins Medicine, Baltimore, MD, United States, 5Wolfson Brain Imaging Centre, University of Cambidge, Cambridge, United Kingdom, 6Department of Imaging Methods, Institute of Measurement Science, Slovak Academy of Sciences, Bratislava, Slovakia
31P compartmentalized
spectroscopy techniques at 7T can achieve a significantly higher SNR
than a CSI acquisition, for
the same acquisition time, while improving inter-scan
reproducibility and providing similar cardiac
PCr/ATP ratio.
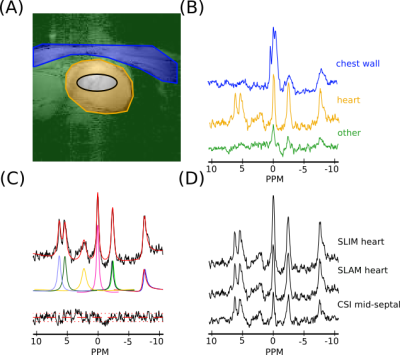
Figure 2: (A)
A sample segmentation map of one slice of the heart, showing (blue)
chest wall, (orange) heart and (green) other compartments, and (black) the midseptal voxel (64% threshold of voxel PSF) used in the short AW CSI reconstruction. (B) Sample spectra for
each compartment in (A) reconstructed using the SLAM
algorithm and AW acquisition. (C) Fit, using the OXSA toolbox of the
heart compartment spectra in (B). (D) SLIM and SLAM reconstruction of
heart compartment in (A) with AW data and the mid-septal voxel of the
short AW CSI reconstruction. Spectra in B and D are normalized by
noise.
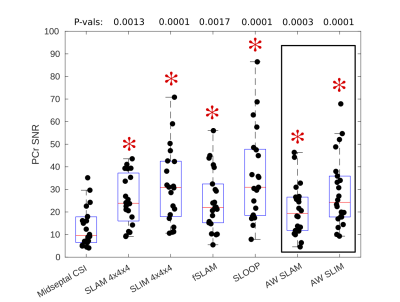
Figure 4: Box-plot showing PCr SNR values for each acquisition, median and IQR
indicated by box. * indicates significant difference to midseptal
CSI reconstruction (Wilcoxon
signed-rank paired, α=0.05/6, P-values above box-plot). SLAM/SLIM reconstructions which use the same data
acquisition as the midseptal
reconstruction are highlighted.
-
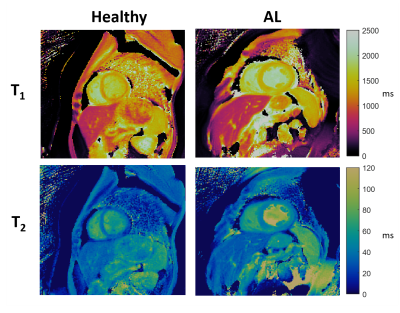
Evaluating the Myocardial Diffusion Status in Cardiac Amyloidosis: A Novel Intravoxel Incoherent Motion Diffusion-weighted MR Imaging Study
Mengdi Jiang1, Xianghua Huang2, Guifen Yang3, Weiqiang Dou4, and Yong Shen5
1Department of Medical Imaging, Jinling Hospital, Medical School of Nanjing University, NanJing, China, 2National Clinical Research Center of Kidney Disease, Jinling Hospital, Medical School of Nanjing University, NanJing, China, 3Department of Nuclear Medical, Jinling Hospital, Medical School of Nanjing University, NanJing, China, 4GE Healthcare,MR Research China, BeiJing, China, 5GE Healthcare,MR Enhanced Application China, BeiJing, China
IVIM parameters ADCslow and ADCfast were
found to be significantly altered by cardiac amyloidosis, allowing to
identify amyloidosis specific patterns.
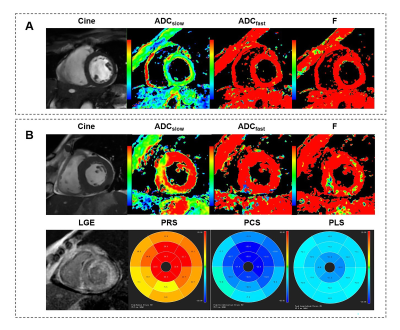
Figure 4 Typical
example of IVIM-derived parameters, strain and LGE for (A) a healthy control
and (B) a LGE(+) patient with cardiac amyloidosis. Other abbreviations
as in Figure 2&3.
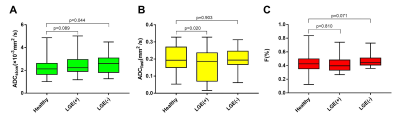
Figure
2 Box plot indicating the distribution of the ADCslow, ADCfast,
and F values among the healthy controls and LGE(+) or LGE(-) patients. LGE= late gadolinium enhancement.
-
3D wave Cardiac Magnetic Resonance for myocardial scar tissue characterization
Quentin Lebret1,2, Pierre Bour1,2, Valéry Ozenne1,2, Nestór Pallares-Lupon1,2, Richard Walton1,2, and Bruno Quesson1,2
1IHU Liryc, Electrophysiology and Heart Modeling Institute, fondation Bordeaux Université, Pessac, France, 2Univ. Bordeaux, INSERM, Centre de recherche CardioThoracique de Bordeaux, U1045, Bordeaux, France
Using a combination of wave acquisitions and Poisson undersampling, we retrospectively subsampled images of a sheep heart by an acceleration factor of 4, and successfully reconstructed said images, opening the path to a fast high-resolution 3D LGE acquisition.
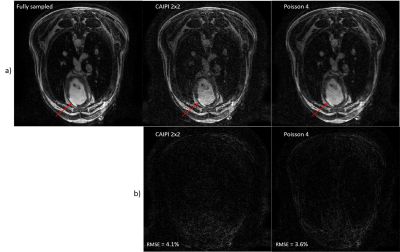
(a.) Fully sampled reconstruction compared to a
2x2 CAIPI scheme and a VD Poisson 4-fold retrospectively accelerated. The red
arrow indicates the infarct.
(b.) Relative error between the fully sampled
and the accelerated data.
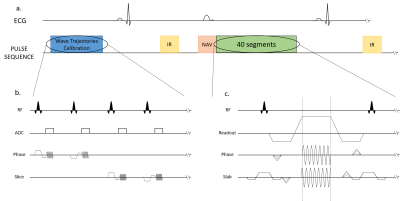
Sequence diagrams. Zoom in on the
Trajectory Calibration Sequence (b.) and on the Wave sequence (c.).
a.) The
sequence is triggered in diastole and respiratory gating was performed using an
echo navigator played before data acquisition.
b.) The
trajectories calibration module takes place during the first 25 seconds (4
averages are performed).
c.) The
wave encoding gradients are applied during the readout, in both phase and slice
directions. The slice encoding wave gradient starts ¼ of a cycle before the
phase wave gradient.
-
Quantification of strain analysis in coronary chronic total occlusion: A cardiovascular magnetic resonance imaging follow-up study
Lijun Zhang1, Jinfan Tian2, Xueyao Yang2, Jing An 3, Yi He4, and Xiantao Song2
1Department of Radiology, Beijing AnZhen Hospital, Capital Medical University, Beijing, China, 2Department of Cardiology, Beijing AnZhen Hospital, Capital Medical University, Beijing, China, 33Siemens Shenzhen Magnetic Resonance Ltd, Beijing, China, 4Department of Radiology, Beijing Friendship Hospital, Capital Medical University, Beijing, China
The main findings of the present study are as follows: (1) global and segmental strains improved
over time, and GCS showed a significant treatment effect of successful CTO-PCI; (2) GCS and GLS determined by CMR-FT were
strongly correlated with LVEF.
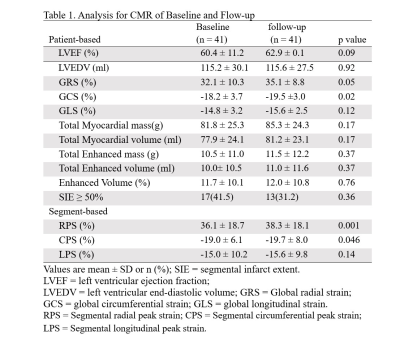
Table 1. Analysis for CMR of Baseline and Flow-up
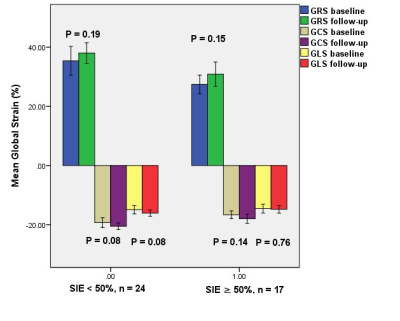
Figure 2. Comparison of left
ventricular global
strain parameters
between baseline and follow-up based on per-patient subgroup analysis.
In the subgroup per-patient analysis, the global peak systolic radial
strain (GRS), global circumferential strain (GCS), and global longitudinal
strain (GLS) of the viable (SIE < 50%) and nonviable (SIE ≥ 50%) groups were
not significantly improved after successful CTO-PCI in 1-year follow-up.
-
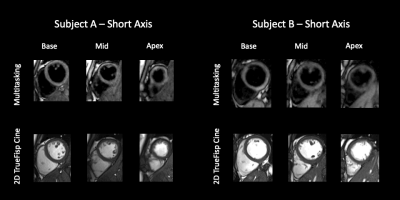
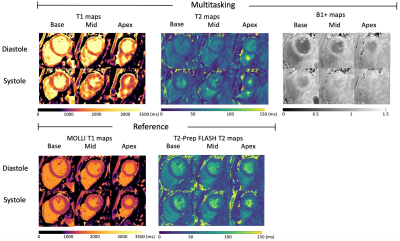
3D Whole Heart Grey-blood PSIR Slow Infusion Imaging for High-resolution Isotropic LGE Imaging
Alina Psenicny1, Reza Hajhosseiny1, Giorgia Milotta2, Karl P Kunze3, Radhouene Neji1,3, Amedeo Chiribiri1, Pier Giorgio Masci1, Claudia Prieto1, and René M Botnar1
1School of Biomedical Engineering and Imaging Sciences, King's College London, London, United Kingdom, 2Wellcome Centre for Human Neuroimaging, UCL Queen Square Institute of Neurology, University College London, London, United Kingdom, 3MR Research Collaborations, Siemens Healthcare Limited, Frimley, United Kingdom
A free-breathing non-rigid motion
corrected high-resolution 3D whole heart grey-blood PSIR slow infusion imaging
protocol with water/fat Dixon encoding at 1.5 mm3
isotropic resolution was proposed for improved scar visualization.
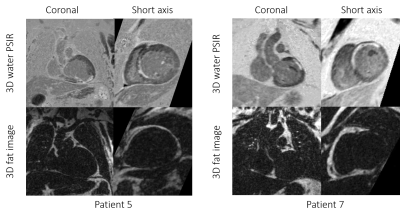
3D
grey-blood PSIR image and fat volume in coronal and short axis views for two
representative cases with scar. Excellent scar to myocardium SNR can be observed
in both cases.
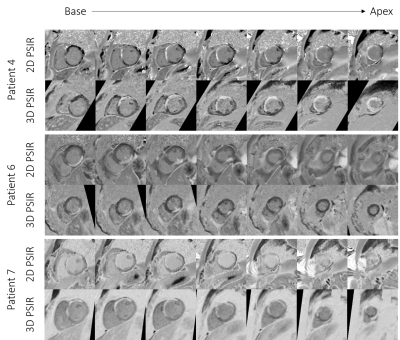
Comparison
between the 2D and 3D grey-blood PSIR images for 3
patients. Corresponding slice positions of the 2D short-axis images were
reformatted for the 3D grey-blood PSIR images. Image quality is comparable
across the slices for all the cases with a good depiction of scar observed
across the whole 3D volume compared to the 2D acquisition.
-
An Off-Resonance Insensitive Orthogonal CSPAMM Sequence (ORI-O-CSPAMM)
Hernán Mella1,2,3, Hui Wang4,5, and Sergio Uribe2,3,6
1Department of Electrical Engineering, Pontificia Universidad Católica de Chile, Santiago, Chile, 2Biomedical Imaging Center, Pontificia Universidad Católica de Chile, Santiago, Chile, 3Millennium Nucleus for Cardiovascular Magnetic Resonance, ANID - Millennium Science Initiative Program, Santiago, Chile, 4Philips, Cincinnati, OH, United States, 5Department of Radiology, Cincinnati Children’s Hospital Medical Center, Cincinnati, OH, United States, 6Department of Radiology, Pontificia Universidad Católica de Chile, Santiago, Chile
ORI-O-CSPAMM effectively removed off-resonance effects and only two images where necessary to reconstruct CSPAMM and MICSR images
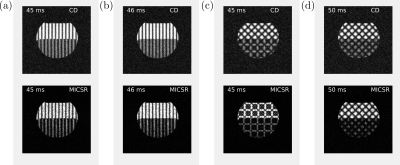
Figure 2:
Water and fat phantom images
obtained using complex-difference (CD) and MICSR for a trigger-delay-time of 45 ms (the delays are different between the images due to differences in the duration of the tagging prepulse). The images were acquired using (a) CSPAMM, (b) ORI-CSPAMM,
(c) O-CSPAMM, and (d) ORI-O-CSPAMM sequences. Images acquired without ORI
prepulse showed a shift in the tagging pattern at the water-fat
interface, while in ORI versions ((b) and (d)) the shift was corrected.
-
Assessment of myocardial involvement characteristics by cardiac MR imaging in patients with polymyositis and dermatomyositis
Changjing Feng1, Wangyan Liu1, Xiaoxuan Sun1, Qiang Wang1, Xiaomei Zhu1, Xiaoyue Zhou2, Yi Xu1, and Yinsu Zhu1
1The First Affiliated Hospital of Nanjing Medical University, Nanjing, China, 2Siemens Healthineers Ltd., Shanghai, China
CMR
tissue characterization imaging could early detect myocardial involvement in the
PM and DM patients.
The features of myocardial
involvement are different between PM and
DM patients. Myocardial
involvement in patients with PM is more serious when compared to patients with
DM.
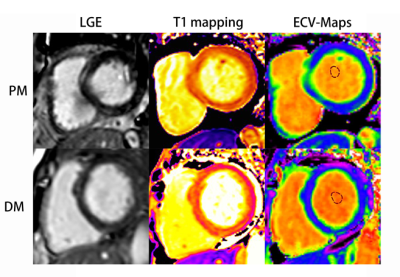
Course of late gadolinium enhancement (LGE), Native myocardial T1 and ECV
map images in PM and DM patients, respectively. LGE detected mid-wall
enhancement in the interventricular septum and inferior in PM and subepicardial
enhancement in the interventricular septum and inferior in DM. LGE volume of 16%
in both the PM and DM patients. Mean global native T1 and ECV values were 1281
ms and 32%, 1283 ms and 30% in PM and DM patients, respectively.
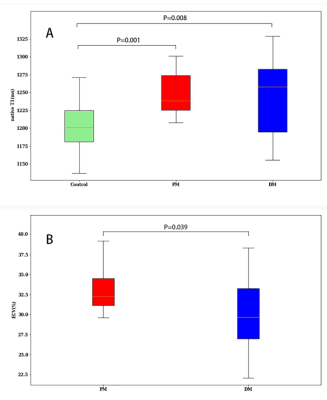
Global
native T1 (A) in control (green), Polymyositis (PM) (red), and Dermatomyositis (DM)
(blue) and global ECV (B) in Polymyositis (PM) (red), and Dermatomyositis (DM) (blue)
showed by box plots.
-
Assessment of different b values in motion-controlled myocardium spin echo diffusion tensor imaging in vivo
Yuli Huang1, Xinyang Wu2, Lifei Ma2, Haipeng Dong3, and Qian Jiang2
1Philips Healthcare (Suzhou) Co., Ltd, Suzhou, China, 2Philips (China) Investment Co., Ltd., Shanghai, China, 3Ruijin Hospital, Shanghai Jiaotong University School of Medicine, Shanghai, China
Diffusion tensor imaging using SE-EPI was performed in 9 subjects. Significant difference was found in SNR, CNR, MD, and FA between varying b values while not between myocardium segments. Intermediate b values are recommended to achieve a balance of image quality and diffusion sensitivity.
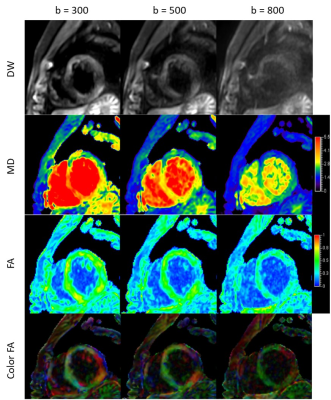
Figure 1. Diffusion weighted images, MD maps, FA maps, and direction-encoded color FA maps at b values of 300, 500, 800 s/mm2 of one volunteer.
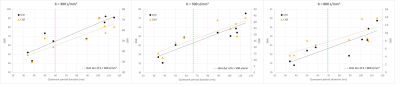
Figure 3. SNR, CNR of images acquired with different myocardium quiescent duration of all subjects.
-
Early Cardiac Involvement Detected by CMR Feature Tracking in Idiopathic Inflammatory Myopathy with Preserved Ejection Fraction
Wangyan Liu1, Yinsu Zhu1, and Yi Xu1
1the first affiliated hospital of Nanjing medical university, Nanjing, China
(1) The damaged LV strain in IIM patients mainly involved global and regional LV longitudinal PS; (2) LA reservoir function and conduit function were impaired in IIM patients.
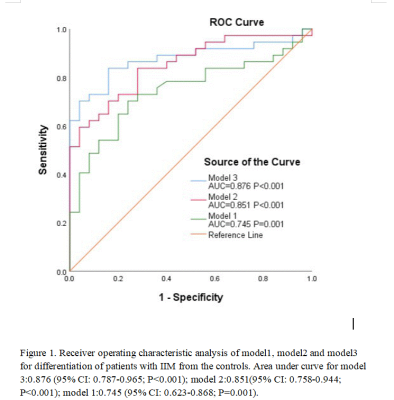
Figure 1. Receiver operating characteristic analysis of model1, model2 and model3 for differentiation of patients with IIM from the controls. Area under curve for model 3:0.876 (95% CI: 0.787-0.965; P<0.001); model 2:0.851(95% CI: 0.758-0.944; P<0.001); model 1:0.745 (95% CI: 0.623-0.868; P=0.001).
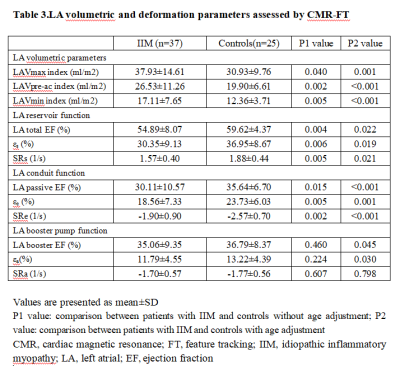
Table 3.LA volumetric and deformation parameters assessed by CMR-FT
-
A Framework to extract and visualize the myofiber helix angle locally and globally from the cardiac diffusion tensor images
Mehrzad Tartibi1, Randall Lee2, Christopher Nguyen3, Jaume Coll-Font3,4, Youngho Seo2, and Qizhi Fang2
1DelBeat Inc., Berkeley, CA, United States, 2University of California San Francisco, San Francisco, CA, United States, 3Massachusetts General Hospital, Boston, MA, United States, 4Harvard Medical School, Boston, MA, United States
Developed a method to remove the trabeculae and the ventricle papillary muscles from the segmentation of the DTI images. This tool allows for accurate measurement of the myofiber helix angle. The swine helix angle is linearly varies from the ventricle endocardium to the epicardium.
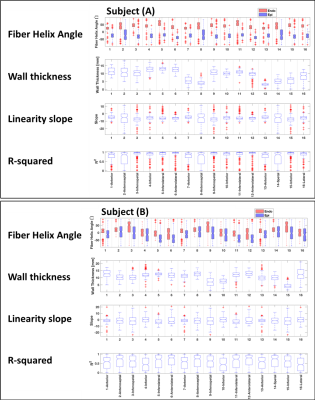
The statistical analysis of the myofiber angle for (A) the swine subject (A) and (B) the swine subject (B).
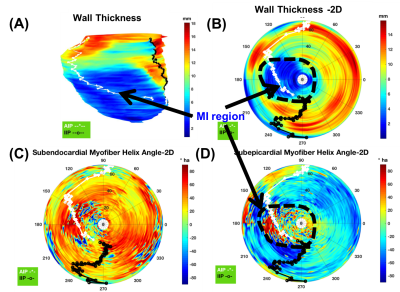
wall thickness and helix angle distribution are shown on a 2D flattened polar plot of swine subject (A). (A) Swine Subject (A) 3D endocardial surface with wall-thickness contour, (B) 2D-flattened wall thickness contour, (C) 2D-flattened helix angle at the subendocardial surface, and (D) 2D-flattened helix angle at the subepicardial surface. White and black curves represent the marking of right ventricle anterior and interior insertion points, respectively.
-
Optimization of B0 Simulation Strategy in the Human Heart based on CT Images at limited Field of View
Yun Shang1, Sebastian Theilenberg1, Laura M. Schreiber2,3, and Christoph Juchem1,4
1Department of Biomedical Engineering, Columbia University, New York, NY, United States, 2Chair of Cellular and Molecular Imaging, Comprehensive Heart Failure Center, University Hospital Wuerzburg, Wuerzburg, Germany, 3Department of Cardiovascular Imaging, Comprehensive Heart Failure Center, University Hospital Wuerzburg, Wuerzburg, Germany, 4Department of Radiology, Columbia University Medical Center, New York, NY, United States
B0 simulation error adopting FFT-based method converged starting from a zero-padding factor of 2-3. Higher spatial resolution led to more accurate fields distribution. Anatomical extension of CT-derived FOV from a body with similar BMI allows to elevate B0 field accuracy with lowest error.
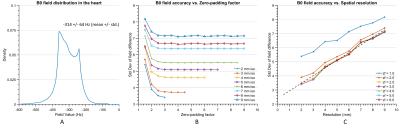
Figure
2. Comparison of simulated B0 fields in the heart between the FFT-based
method and dipole method. A) Exemplary field distribution in the heart was
calculated using dipole method based on the susceptibility distribution of Ella’s
entire body at 3 mm isotropic. The
standard deviation of the field difference was shown B) from fine to coarse resolution
and C) a range of zero-padding factors. Zero-padding
factors higher than 2.5 do not substantially improve the STD value, i.e., B0
accuracy, while a higher resolution can significantly lower this value (dash line: linear fit at zf = 2.5).
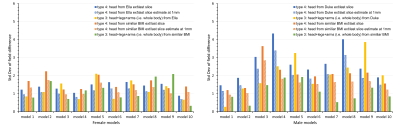
Figure 5. The standard deviation of field
difference between the extended CT-derived FOV and the entire body for ten female models (left) and ten male models (right). The anatomical extension type 3 adopting the body
with a similar BMI exhibited the lowest B0 simulation error compared
to other types, especially in male models. It is the optimized strategy when sufficient computation power is
available while simplified anatomical extension type 4 are reasonable compromises to
achieve high-resolution B0 simulation with less discretization
error under limited computation resources.
-
A Comparison of Metal Artifacts in Cardiovascular MRI at 0.55T and 1.5T
W. Patricia Bandettini1, Christine Mancini2, Sujata M. Shanbhag2, Jennifer Lynn Henry2, Margaret M. Lowery2, Marcus Y. Chen2, and Adrienne E. Campbell-Washburn2
1NIH/NHLBI, Bethesda, MD, United States, 2NATIONAL INSTITUTES OF HEALTH/NHLBI, BETHESDA, MD, United States
This preliminary evaluation of in vivo metallic device artifacts
suggests that lower field strength (0.55T) CMR may lend some advantage in
decreasing the susceptibility artifact associated with common cardiovascular implanted
devices compared to conventional 1.5T field strength imaging.
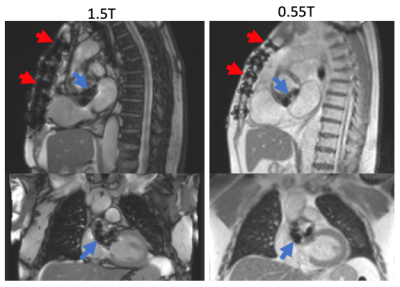
Figure 1. Sternal wire and bioprosthetic aortic valve
artifact appear more prominent at 1.5T (left) compared to 0.55T field strength
(right).
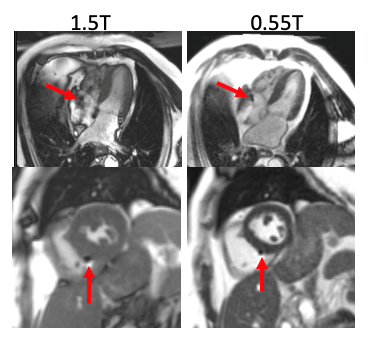
Figure 5. Example pacemaker leads for two patients (4-chamber
on top, short-axis ventricle on bottom) imaged at 1.5T and 0.55T. The artifact
caused by the lead implants was reduced at 0.55T. In addition, the de-phased
blood artifact visible in the 4-chamber view at 1.5T is diminished at 0.55T.