Diffusion Acquisition & Post-Processing
Diffusion/Perfusion Monday, 17 May 2021
Digital Poster
1312 - 1331

Oral Session - Diffusion Acquisition & Post-Processing
Diffusion/Perfusion
Monday, 17 May 2021 14:00 - 16:00
  • Resolving to super resolution multi-dimensional diffusion imaging (Super-MUDI)
    Vishwesh Nath1, Marco Pizzolato2,3, Marco Palombo4, Noemi Gyori4, Kurt G Schilling5, Colin Hansen6, Qi Yang6, Praitayini Kanakaraj6, Bennett A Landman6, Soumick Chatterjee7, Alessandro Sciarra7, Max Duennwald7, Steffen Oeltze-Jafra7, Andreas Nuernberger7, Oliver Speck7, Tomasz Pieciak 8, Marcin Baranek8, Kamil Bartocha8, Dominika Ciupek8, Fabian Bogusz8, Azam Hamidinekoo9, Maryam Afzali 10, Harry Lin4, Danny C Alexander4, Haoyu Lan11, Farshid Sepehrband11, Zifei Liang12, Tung-Yeh Wu13, Ching-Wei Su13, Qian-Hua Wu13, Zi-You Liu13, Yi-Ping Chao13, Enes Albay14, Gozde Unal14, Dmytro Pylypenko13, Xinyu Ye13, Fan Zhang15, and Jana Hutter16
    1NVIDIA Corporation, Bethesda, MD, United States, 2Department of Applied Mathematics and Computer Science, Technical University of Denmark, Kongens Lyngby, Denmark, 3École polytechnique fédérale de Lausanne (EPFL), Lausanne, Switzerland, 4CMIC, University College London, London, United Kingdom, 5Institute of Imaging Science, Vanterbilt University, Nashville, TN, United States, 6Department of Computer Science, Vanterbilt University, Nashville, TN, United States, 7Otto von Guericke University, Magdeburg, Germany, 8AGH University of Science and Technology, Krakow, Poland, 9Institute of Cancer Research, London, United Kingdom, 10CUBRIC, Cardiff University, Cardiff, United Kingdom, 11University of Southern California, Los Angeles, CA, United States, 12NYU Langone, New York, NY, United States, 13Center for Biomedical Imaging Research, Department of Biomedical Engineering, Tsinghua University, Beijing, China, 14Istanbul Technical University, Istanbul, Turkey, 15Harvard Medical School, Boston, MA, United States, 16Centre for Medical Engineering, King's College London, London, United Kingdom
    Results for a superresolution challenge addressing the long acquisition times in diffusion-relaxometry MRI are presented. Multiple methods were proposed, based on both deep-learning and classical mathematical transformations with the top 5 resulting interestingly in comparable errors.
    Figure 3: Quantitative error for selected submissions (we show only the submission with the lowest errors). First row: MSE for isotropic upsampling task of the whole brain, white matter and gray matter. It can be observed that the competing top 5 submissions indicate quite similar errors. Second row: Mean squared error for anisotropic task of the whole brain, white matter and gray matter.
    Figure 4: Error heat maps for the single TE of 80ms across b-values of 1000, 2000 and 3000 s/mm^2 per row. The columns depict different submissions from the best performing five ones. Submission 12 is cubic spline interpolation and the other 4 are deep learning based approaches
  • High-Fidelity Diffusion Tensor Imaging of the Thoracic Spinal Cord Using Point-Spread-Function Encoded EPI (PSF-EPI)
    Sisi Li1, Yishi Wang2, Zhangxuan Hu3, Zhe Zhang4, Bing Wu3, and Hua Guo1
    1Center for Biomedical Imaging Research, Beijing, China, 2Philips Healthcare, Beijing, China, 3GE Healthcare, MR Research China, Beijing, China, 4China National Clinical Research Center for Neurological Diseases, Beijing Tiantan Hospital, Capital Medical University, Beijing, China
    We demonstrated the feasibility of high-fidelity DTI for the thoracic spinal cord using PSF-EPI sequence. The 8-shot PSF-EPI images show reasonable SNR and higher anatomical consistency than other MS-EPI and rFOV methods. The results also show acceptable reproducibility of PSF-EPI.
    Figure.2 Comparison between DTI of the thoracic spinal cord using (upper row) full FOV PSF-EPI (8 shots), (lower row) rFOV ZOOM-EPI (1/2.6 FOV, single shot), and full FOV SS-EPI (RPE=4). Detailed imaging parameters see Table 1, scan 3-5. Color-encoded FA map (cFA), non-DWI image (b0) and mean-DWI (mDWI) image are shown. For better comparison, the major structural boundaries extracted from the T2W reference were overlaid on the cFA using PSF-EPI. Additionally, the diffusivity maps using PSF-EPI are also demonstrated.
    Figure.4 Comparison of EPI-based methods for distortion correction in thoracic DTI. From left to right: T2W TSE, 4-shot MUSE with full FOV (Table 1, scan 6), 4-shot MUSE+FOCUS with 1/2 FOV (scan 7), 8-shot PSF-EPI (scan 8), SS-EPI with full FOV and RPE=2 (scan 9), SS-EPI+FOCUS with 1/2 FOV (scan 10). Upper: T2W TSE reference and non-DWI images. Lower: mDWI images.
  • Nonparametric 6D D-R1-R2 distribution imaging of the human brain: Initial results on healthy volunteers
    Jan Martin1, Alexis Reymbaut2, Michael Uder3, Frederik Bernd Laun3, and Daniel Topgaard1
    1Lund University, Lund, Sweden, 2Random Walk Imaging AB, Lund, Sweden, 3Institute of Radiology, University Hospital Erlangen, Friedrich-Alexander-Universität Erlangen-Nürnberg (FAU), Erlangen, Germany
    We here implement D-R1-R2 distribution imaging using a 20-min acquisition protocol with tensor-valued diffusion encoding and varying TR and TE. Monte Carlo data inversion yields nonparametric distributions, statistical descriptors, and orientation-resolved properties of white matter.
    Statistical descriptors derived from the 6D $$$\bf D$$$-$$$R_1$$$-$$$R_2$$$ distributions shown for a representative axial slice. Displayed are the median values of 100 per-bootstrap means $$$\mathrm{E}$$$, variances $$$\mathrm{V}$$$, and covariances $$$\mathrm{C}$$$. Bin-resolved fractions and means obtained by binning the parameter space to isolate WM ("thin"), GM ("thick"), and CSF ("big"). $$$\bf D$$$ is characterized in terms of the isotropic diffusivity $$$D_{iso} = (D_{||} + 2 D_\bot)/3$$$ and normalized anisotropy $$$D_\Delta = (D_{||} - D_\bot)/D_{iso}$$$.
    Experimental data in three representative voxels. (A) $$$S_0$$$ map with labeled voxels: WM in the corpus callosum (red), cortical GM (green), and CSF in the frontal ventricle (blue). (B) Normalized signal $$$S$$$ versus acquisition index $$$n_{acq}$$$ (measured: black, fitted: colors correspond to the selected voxels). (C) Selected 2D projections of the 6D $$$\bf{D}$$$-$$$R_1$$$-$$$R_2$$$ nonparametric distributions obtained by the Monte Carlo inversion.
  • Diffusion-Prepared Fast Spin Echo for Artifact-free Spinal Cord Imaging
    Seung-Yi Lee1, Briana Meyer1, Shekar Kurpad2, and Matthew Budde2
    1Biophysics, Medical College of Wisconsin, Milwaukee, WI, United States, 2Neurosurgery, Medical College of Wisconsin, Milwaukee, WI, United States
    We show feasibility of high-quality sagittal plane diffusion imaging when combined with a higher order motion compensation diffusion preparation, both respiratory, cardiac gating and 2-dimensional filtered diffusion weighted imaging scheme.
    Figure 5 Mismatch of perfusion and diffusion after acute spinal cord injury. Maps of filtered axial diffusivity (fADC||) and spinal cord blood flow (SCBF) are shown for three acutely injured animals with the labeling plane (red) indicated. Areas of decreased fADC|| (green) or SCBF (red) were manually outlined and along with maps of lesion overlap mean lesion values reflect the extent of each contrast or overlap. Across three animals, the perfusion abnormality was clearly and consistently smaller than the diffusion abnormality.
    Figure 2 Image quality of sagittal DWprep-RARE in the spinal cord. Prominent artifacts exist in the EPI image (A) without diffusion weighting (b0) that are not apparent in the RARE (B), noting these are from different animals. With b(perpendicular) =2000 s/mm2, subtle artifacts were evident in both respiratory (C) and dual (D) gating conditions with both m1 (E) and m2 (F) compensation eliminating the artifacts. Data shown for n=4 animals obtained from ROIs within the spinal cord as shown (B).
  • Universal Sampling Denoising (USD) for noise mapping and noise removal of non-Cartesian MRI
    Hong-Hsi Lee1, Els Fieremans1, Jiangyang Zhang1, and Dmitry S Novikov1
    1New York University School of Medicine, New York, NY, United States
    We propose a universal denoising pipeline for non Cartesian MRI. After sampling non Cartesian data in a Cartesian grid, we unwrap the noise correlation in Cartesian k space, identify and remove the noise using well established denoising method. The applicability is demonstrated in brain data.
    Fig. 3. Demonstrate of noise removal pipeline (USD) on dMRI data in an ex vivo mouse brain (4b=0 images + 60 DWIs). The noise level in DWIs of b = [1, 2] ms/µm2 was reduced dramatically after denoising, and the image residual maps have no anatomical structures. Further, the noise maps before and after re-normalization ($$$\hat{\sigma}$$$ and σ) are both smooth, and the number P of signal components in PCA domain is low. Finally, the histogram of image residual r is normally distributed and below the reference line of slop -1/2 in semi-log scale, indicating that USD only removes the noise.
    Fig. 1. The pipeline of Universal Sampling Denoising (USD) for non-Cartesian k-space data, as detailed in Theory section. Here we take the radial trajectory as an example. The key idea in USD is to de-correlate the noise statistics in gridded/Cartesian k-space before applying any denoising algorithm in the image space. The noise covariance matrix in Cartesian k-space is determined by coefficients of density compensation and convolution with interpolation kernel. After denoising using MP-PCA algorithm, re-normalization of the denoised image recovers the original image contrast.
  • Patch2Self denoising reveals a new theoretical understanding of Diffusion MRI
    Shreyas Fadnavis1, Joshua Batson2, and Eleftherios Garyfallidis3
    1Intelligent Systems Engineering, Indiana University Bloomington, Bloomington, IN, United States, 2Chan Zuckerberg Biohub, San Francisco, CA, United States, 3Indiana University Bloomington, Bloomington, IN, United States
    Patch2Self is the first self-supervised denoiser that uses the fact that noise across different gradient directions in Diffusion MRI is statistically independent. It is a completely automated (no hyperparameters) method that suppresses only noise from various sources.
    Explains the flow of Patch2Self Framework. Also depicts the self-supervised loss used in the J-invariant training.
    Regressor Comparisons
  • High-resolution visualization of isotropically restricted diffusion in brain by strong spherical dMRI and super-resolution reconstruction
    Geraline Vis1, Markus Nilsson1, and Filip Szczepankiewicz1
    1Diagnostic Radiology, Clinical Sciences Lund, Lund University, Lund, Sweden
    Combining spherical tensor encoding, ultrahigh b-values, and super-resolution reconstruction enables high-resolution dot fraction imaging in human brain with improved contrast compared to conventional imaging, where the dot fraction is believed to resemble densely packed cells.
    Figure 4 Diffusion weighted imaging with spherical encoding at b = 4 ms/μm2 in coronal view. A vastly higher contrast is observed between the cerebellar cortex and white matter using super-resolution reconstruction (right, contrast ratio 1.82) compared to direct high-resolution sampling (left, contrast ratio 1.06).
    Figure 5 Signal retention using diffusion-weighted imaging with spherical encoding at b = 4 ms/μm2 (upper left) and estimation of $$$f_{dot}$$$ (upper right) show agreement with cell-stained histology (lower right plot shows human brain histology from the BigBrain atlas [15]). As expected, regions of high signal correspond to the cerebellar cortex where granule cells are densely packed, whereas the white matter is suppressed by the spherical diffusion encoding (lower left for morphological reference).
  • SNR efficiency and effectiveness of 7T high-b diffusion imaging with MESMERISED and PGSE
    Alard Roebroeck1, Benedikt A Poser1, and Francisco J Fritz2
    1Department of Cognitive Neuroscience, Faculty of Psychology & Neuroscience, Maastricht University, Maastricht, Netherlands, 2Department of Systems Neurosciences, University Medical Center Hamburg-Eppendorf, Hamburg, Germany, Hamburg, Germany
    MESMERISED’s SAR and gradient duty cycle efficiency allows it to outperform PGSE for 7T high-b diffusion MRI and provide highly efficient and effective microstructure modeling, while also decreasing Gibbs ringing and allowing efficient quantitative multi-contrast MRI
    B1+ inhomogeneity and Gibbs ringing (A) Flip angle map (in degrees; top) and deviation from the nominal 90 degrees (bottom) (B) tSNR for MESMERISED with ESxMB=3x3 (top) for both STE and SE b0 volumes and PGSE with MB=2 (bottom). (C) Average b0 image MESMERISED STE volumes (top) and PGSE (bottom). Magnification of red box and line-plot at the red line (D) The Fraction of Sticks (FS) map for MESMERISED (ESxMB=3x3) STE volumes (top) and PGSE (bottom). Magnification of blue box and line-plot at the blue line.
    Full coronal, sagittal and axial views of (A) absolute flip angle (B) deviation from the nominal 90 degrees, and for for PGSE (MB=2) volumes: (C) average b0 with line-plot at the red line, (D) b0 tSNR (E) FS map with line-plot at the blue line, (F) FS map uncertainty with line-plot at the blue line.
  • Incoherent k-q Under-sampled Multi-shot EPI for Accelerated Multi-shell Diffusion MRI with Model-based Deep Learning Reconstruction
    Merry Mani1, Vincent Magnotta2, and Mathews Jacob2
    1Radiology, University of Iowa, Iowa City, IA, United States, 2University of Iowa, Iowa City, IA, United States
    We propose a new acceleration & reconstruction method for highly accelerated high resolution multi-shell dMRI. The model-based reconstruction that includes a q-space manifold prior, recovers all q-space data simultaneously, from 8-fold under-sampled data, with minimal artifacts.
    The incoherent k-q under-sampling illustrated. Here, the full k-space sampling involves using all the 4 shots (denoted using 4 colors) for every q-space point. In (a), an acceleration of R=4 is achieved by using under-sampled multi-shot trajectory. Specifically, only 1 shot (illustrated using bold lines) is used to sample a given q-space point. Different q-space points are sampled using differnt shots (denoted by the different colors). In (b), an acceleration of R=8 is achieved by skipping half of the points in q-space.
    The orientation distribution (row 1) and the neurite density (row 2) computed using the NODDI model for the fully sampled case and the accelerated cases. The average value in the difference map computed with respect to R=1 is less than .06 and .04 and for ODI and NDI respectively for R=4,8.
  • Combined spin echo and gradient echo slice-to-volume reconstruction in fetal diffusion MRI
    Daan Christiaens1,2, Maximilian Pietsch1, Lucilio Cordero-Grande1, Anthony N Price1,3, Jana Hutter1,3, Emer Hughes1, Serena J Counsell1, Joseph V Hajnal1,3, and J-Donald Tournier1,3
    1Centre for the Developing Brain, School of Biomedical Engineering and Imaging Sciences, King's College London, London, United Kingdom, 2Department of Electrical Engineering (ESAT-PSI), KU Leuven, Leuven, Belgium, 3Biomedical Engineering Department, School of Biomedical Engineering and Imaging Sciences, King's College London, London, United Kingdom
    We extended slice-to-volume reconstruction to multi-echo diffusion MRI and applied it in fetal brain imaging. We then explored the combined diffusion-T2* signal characteristics across gestational age.
    Figure 2: Example of slice-to-volume reconstruction (SVR) in a fetus (28 wPMA) with severe head motion. The images show the mean of each shell before and after SVR, in the spin echo and gradient echo contrast. Grayscale values are min-max normalised per row.
    Figure 4: Age trends in the mean tissue response function (RF) in the parenchyma. Tissue RFs for each subject were averaged across bi-weekly age intervals. The spin echo RF shows increasing signal anisotropy and stronger attenuation at young gestational age, as expected. On the other hand, the gradient echo shows stronger T2*-weighting at later gestational ages, most prominently in the b=0 signal.
Back to Top
Digital Poster Session - Diffusion Acquisition
Diffusion/Perfusion
Monday, 17 May 2021 15:00 - 16:00
  • Whole-brain Diffusion Tensor Imaging Using Single-Shot Spiral Sampling
    Guangqi Li1, Xin Shao1, Xinyu Ye1, Xiaodong Ma2, and Hua Guo1
    1Center for Biomedical Imaging Research, Department of Biomedical Engineering, School of Medicine, Tsinghua University, Beijing, China, 2Center for Magnetic Resonance Research, Radiology, Medical School, University of Minnesota, Minneapolis, MN, United States
    This study demonstrates that single-shot spiral sampling can be adopted to acquire whole-brain diffusion tensor imaging with shorter TE and higher SNR. In addition, the in vivo results show that single-shot spiral DWI provides accurate DTI metrics, and has high anatomical accuracy.
    Figure 4: Axial, coronal and sagittal planes of whole-brain diffusion weighted images with 1.3mm isotropic resolution using single-shot spiral sampling. (a) b0 (T2W) images. (b) single diffusion weighted images (DWI1). (c) mean DWI and (d) colored FA maps.
    Figure 3: Colored FA maps of 10 representative slices covering the whole brain. The results indicate that single-shot spiral diffusion imaging can provide accurate DTI metrics.
  • Dynamic parallel transmission for diffusion MRI at 7T
    Belinda Ding1, Iulius Dragonu2, Patrick Liebig3, Robin M Heidemann3, and Christopher T Rodgers1
    1Wolfson Brain Imaging Centre, University of Cambrige, Cambridge, United Kingdom, 2Siemens Healthcare Limited, Firmley, United Kingdom, 3Siemens Healthineers, Erlangen, Germany
    This abstract showed that dynamic pTx pulses greatly reduces signal dropouts in whole brain diffusion MRI at 7T when compared against traditional circularly polarised pulses. This leads improvements in diffusion tract definitions, especially in lower brain regions.
    Figure 2: Direct comparison of the b=0 s/mm2 images between CP and pTx acquisition in three orientations. The right most column shows the percentage signal change between the pTx and CP acquisition. The signal change was calculated as 200% × [signal(pTx) – signal(CP)] / [signal(pTx) + signal(CP)] .
    Figure 4: (a) Colour FA maps acquired with CP pulses (left) and pTx spokes pulses (right). The maps show FA (in the range of [0.25 1]) with colours representing the orientation of the first eigenvector (red: left-right; green: anterior-posterior; blue: inferior-superior). (b) Zoomed region of interest as denoted by the red box in (a). Diffusion fibres are more clearly seen in the pTx acquisition especially in the brainstem.
  • Noise reduction in diffusion tensor imaging of the brachial plexus using single-shot DW-EPI with Compressed SENSE
    Takayuki Sada1, Hajime Yokota2, Takafumi Yoda1, Ryuna Kurosawa1, Koji Matsumoto1, Takashi Namiki3, Masami Yoneyama3, Yoshitada Masuda1, and Takashi Uno2
    1Department of Radiology, Chiba University Hospital, Chiba, Japan, 2Diagnostic Radiology and Radiation Oncology, Graduate School of Medicine, Chiba University, Chiba, Japan, 3Philips Japan, Tokyo, Japan
    We compared EPICS, SENSE, and SENSE×2 (same conditions as SENSE with increased NEX) in the brachial plexus region, and DTI using EPICS was a robust imaging method with better reproducibility of ADC FA values than SENSE and SENSE×2.

    Figure 5. (Upper column) An example of noise-like artifacts in SENSE. The nerve root region is noisy, which may contribute to the reduced coefficients of variation in this region. (Lower column) There is a lot of noise in the area outside the nerve root. In the region of noise, ADC value is low and FA value is high. When the ROI is placed outside the nerve, the values are greatly shifted. It is important to draw ROIs on noise-free images.

    Figure 3.(Upper column) Fractional anisotropy (FA) and coefficient of variance (CVFA) of EPICS, SENSE, and SENSE×2. FA was significantly different among the three protocols, and CVFA was significantly smaller in EPICS and SENSE than in SENSE×2. (Lower column) Focusing on the nerve roots, FA in EPICS was significantly smaller and CVFA was smaller than SENSE.

  • Inversion-recovery prepared 3D oscillating gradient sequence (IR-OGprep-GRASE) improves time-dependency measurements in the human brain
    Haotian Li1, Yi-Cheng Hsu2, Tao Zu1, Zhiyong Zhao1, Ruibin Liu1, Yi Sun2, Yi Zhang1, and Dan Wu1
    1Key Laboratory for Biomedical Engineering of Ministry of Education, Department of Biomedical Engineering, College of Biomedical Engineering & Instrument Science, Zhejiang University, Hangzhou, China, 2MR Collaboration, Siemens Healthcare China, Shanghai, China
    An inversion-recovery prepared oscillating gradient diffusion sequence with 3D GRASE acquisition and GRAPPA acceleration was developed. The IR module corrected the CSF effect on diffusion-time dependency measurements in the human brain.
    Figure 4: Mean ADC values from the 3D IR-OGprep-GRASE sequence measured in several GM and WM regions at different frequencies (60Hz, 40Hz, 20Hz, and 0Hz). (A) ADCs in the hippocampal head were lower than that in the hippocampal body or tail, and its td–dependent change was faster (from PG to OG-20Hz) than the other two parts. (B) The td–dependency of cortical GM was distinct compared to other GM and WM regions, with a slower td–dependent change from PG to OG-20Hz.The error bar represents the standard deviation.
    Figure 3: Diffusion-time (td) dependent ADC measured using the 3D IR-OGprep-GRASE and OGprep-GRASE sequences at different frequencies (60Hz, 40Hz, 20Hz, 0Hz). For the 3D IR-OGprep-GRASE sequence, all ROIs showed td-dependent changes of ADC. In comparison, for the 3D OGprep-GRASE sequence without IR module, the td-dependent effect was not observable for regions close to the ventricle and sulci, including the hippocampus, cortical gray matter, and splenium of corpus callosum. (*p < .05 and **p < .01 by post-hoc t-test)
  • ACcelerated Echo-train shifted EPTI (ACE-EPTI) for fast distortion-blurring-free high-resolution diffusion imaging with minimal echo time
    Zijing Dong1,2, Fuyixue Wang1,3, Lawrence L. Wald1,3, and Kawin Setsompop4,5
    1Athinoula A. Martinos Center for Biomedical Imaging, Massachusetts General Hospital, Charlestown, MA, United States, 2Department of Electrical Engineering and Computer Science, MIT, Cambridge, MA, United States, 3Harvard-MIT Health Sciences and Technology, MIT, Cambridge, MA, United States, 4Department of Radiology, Stanford University, Stanford, CA, United States, 5Department of Electrical Engineering, Stanford University, Stanford, CA, United States
    A powerful technique, ACE-EPTI, is presented for dMRI and diffusion-relaxometry with high SNR-efficiency, high image quality without distortion/blurring, self-navigated phase correction, capability for time-resolved multi-contrast imaging, and fast acquisition with only 3-shot.
    Figure 1. Illustration of the echo-train shifted acquisition, 3-shot spatiotemporal encoding and subspace reconstruction of ACE-EPTI.
    Figure 4. Reconstructed images and SNR maps of ss-EPI and 3-shot ACE-EPTI from the phantom and in-vivo experiments. For ACE-EPTI, the echo-combined image is shown and is used for the SNR analysis. The images acquired by ss-EPI show obvious distortion in the front part of phantom and brain (yellow arrows), while ACE-EPTI eliminates all these distortion artifacts. ACE-EPTI also shows a 30-40% increase in SNR when compared to a time-matched ss-EPI with 3 average in both phantom and in-vivo experiments.
  • Creating parallel-transmission-style MRI with deep learning (deepPTx): a feasibility study using high-resolution whole-brain diffusion at 7T
    Xiaodong Ma1, Kamil Uğurbil1, and Xiaoping Wu1
    1Center for Magnetic Resonance Research, Radiology, Medical School, University of Minnesota, Minneapolis, MN, United States
    We propose a novel deep-learning framework, dubbed deepPTx, which aims to train a deep neural network to directly predict pTx-style images from images obtained with single transmission (sTx). Its feasibility  is demonstrated using 7 Tesla high-resolution, whole-brain diffusion MRI. 
    Fig.5 Testing of the final model on a new subject randomly chosen from the 7T HCP database. Shown are mean diffusion-weighted images with b1000 (averaged across all directions) and color-coded FA maps in sagittal, coronal and axial views. The final model with tuned hyperparameters was trained on our entire dataset of 5 subjects. Note that the final model (ResNet) substantially enhanced the image quality by restoring signal dropout observed in the lower brain regions (as marked by yellow arrowheads), producing color-coded FA maps with reduced noise levels in those challenging regions.
    Fig.3 Example b0 and b1000 diffusion images (of one diffusion direction) for single transmission (sTx) vs deep-learned pTx (ResNet) in reference to acquired pTx images. Shown is a representative axial slice in lower brain from one subject, in which case the model with tuned hyperparameters was trained on data of the other 4 subjects. Note that the use of ResNet substantially improved the image quality, effectively recovering the signal dropout observed in the lower temporal lobe (as marked by the yellow arrowheads) and producing images that were comparable to those obtained with pTx.
  • Distortion-Free Diffusion-Relaxometry Imaging with Self-navigated Cartesian-based Echo-Planar Time Resolved Acquisition (cEPTI)
    Erpeng Dai1, Philip K Lee1,2, Zijing Dong3,4, Fanrui Fu1, Kawin Setsompop1,2, and Jennifer A McNab1
    1Department of Radiology, Stanford University, Stanford, CA, United States, 2Department of Electrical Engineering, Stanford University, Stanford, CA, United States, 3Athinoula A. Martinos Center for Biomedical Imaging, Massachusetts General Hospital, Charlestown, MA, United States, 4Department of Electrical Engineering and Computer Science, MIT, Cambridge, MA, United States
    A self-navigated Cartesian-based EPTI acquisition (cEPTI) and the corresponding reconstruction algorithm have been developed. High-quality distortion-free diffusion and multi-contrast images can be acquired with the proposed cEPTI.
    Figure 5: (a)-(c) The b0 images, MD and FA maps of the same slice as in Fig. 4 from 6 out of 48 echo times.
    Figure 3: A comparison of b0 and diffusion images acquired with conventional 4-shot EPI and cEPTI, with a T2 FLAIR image as a distortion-free reference.
  • Distortionfree multishot 3D diffusion weighted turbo spin echo imaging using cartesian spiral acquisition and data rejection
    Tim Schakel1, Tom Bruijnen1,2, and Marielle Philippens1
    1Department of Radiotherapy, University Medical Center Utrecht, Utrecht, Netherlands, 2Computational Imaging Group for MRI diagnostics and therapy, Centre for Image Science, Utrecht, Netherlands
    This work demonstrates the feasibility of a multishot 3D diffusion weighted TSE sequence with a redundant cartesian spiral sampling pattern and data rejection to improve robustness against phase inconsistencies between different shots.
    Figure 5: In-vivo results, acquired at 2 mm3 isotropic resolution, different transverse slices; a) b=0 s/mm2, b) b=500 s/mm2 (iso), c) b=1000 s/mm2 (iso), d) ADC map (10-3 mm2/s).
    Figure 3: Low resolution reconstructions for a 19-shot acquisition for a single direction of b=500 s/mm2. Top left: magnitude images, top right: phase images, bottom: nRMSE and weights for each shot. Shot 9 was determined to be the reference shot. Shot 6 (red square) showed most corruption in both magnitude and phase, resulting in a high error.
  • Highly Segmented Multishot Diffusion Imaging With Spiral Readouts
    Yoojin Lee1, Franz Patzig1, and Klaas P. Pruessmann1
    1Institute for Biomedical Engineering, ETH Zurich and University of Zurich, Zürich, Switzerland
    This work studies the feasibility of highly segmented diffusion imaging with spiral acquisition and MUSE reconstruction. To stabilize reconstruction, we explore the utility of joint optimization of phase biases and image content.
    Figure 2. Multi-shot DWI with 16-fold segmentation reconstructed using the proposed joint estimation approach. The shot-to-shot phase variations ($$$\phi_{vp}$$$) were initialized with the low-pass filtered phase images of individual shots (bottom left). The object (O) was initialized with the MUSE-reconstructed image (top left). The diffusion contrast similar to the DWI with lower segmentations (top row of Fig. 1) was recovered in the final image (right column).
    Figure 1. DWIs (b=1000s/mm2) with varying number of shots (ns) reconstructed using the MUSE method. Overall, the MUSE approach provided high-quality images. However, less diffusion contrast was observed for higher segmentations (blue vs. red arrows).
  • Simple improvement of Multi-Dimensional diffusion MRI(MD-dMRI) image quality by double-sampled EPI
    Nicolas Geades1, Oscar Jalnefjord2,3, Guillaume Gilbert4, and Maria Ljungberg2,3
    1MR Clinical Science, Philips, Gothenburg, Sweden, 2Department of Medical Physics and Biomedical Engineering, Sahlgrenska University Hospital, Gothenburg, Sweden, 3Department of Radiation Physics, University of Gothenburg, Gothenburg, Sweden, 4MR Clinical Science, Philips, Markham, ON, Canada
    By replacing scan time used for acquiring images purely used for averaging (when applicable), with EPI acquisitions at opposing readout directions, ghost artifacts can be eliminated. The implementation provides ghost-free images with a minimal (7%) increase in scan time.
    MD-dMRI maps with and without EBS. Mean Diffusivity (MD), Mean Isotropic Kurtosis (MKI), Mean Anisotropic Kurtosis (MKA)
    Artifact vs. b-value. Images are shown with EBS on (top row) and visible ghosting artifacts, EBS off (middle row) with no visible artifacts, as well as a difference image (bottom row)
  • Navigator-Free Submillimeter Diffusion MRI using Multishot-encoded Simultaneous Multi-slice (MUSIUM) Imaging
    Wei-Tang chapel Chang1, Khoi Minh Huynh2, Pew-Thian Yap1, and Weili Lin2
    1Radiology, UNC at Chapel Hill, Chapel Hill, NC, United States, 2BRIC, UNC at Chapel Hill, Chapel Hill, NC, United States
    MUSIUM sequences enhance SNR with low RF power and peak amplitude and are motion robust and free from slab boundary artifacts. The efficacy of MUSIUM imaging is demonstrated at 0.86 mm isotropic resolution, revealing detailed structures in cortical areas.
    Figure 3: The reconstruction results of the 0.86-mm isotropic MUSIUM data. (a) The diffusion images at b=500, 1000 and 2000. (b) The FA map in three orthogonal planes. The data acquisition time is ~12.5 minutes.
    Figure 1: The RF excitation and k-space sampling trajectories of the MUSIUM sequences. (a) The RF excitation of a MUSIUM sequence. nsms × nshot slices are excited simultaneously. (b) The sampling trajectories of MUSIUM sequence.
  • Motion-Insensitive Brain Diffusion MRI using Intra-Sequence Motion Updates: Interaction between TE and Tracking Frame Rate
    Artan Kaso1 and Thomas Ernst1
    1Diagnostic Radiology and Nuclear Medicine, University of Maryland School of Medicine, Baltimore, MD, United States
    Signal dropouts caused by uncorrected head movement during DWI acquisitions were recovered to a great extent by prospective motion correction using a fast optical tracking system. The residual signal shifts were larger than expected due to the asynchronous application of motion updates.
    Figure 3: k-space shifts versus rotational velocities at TE=68ms. (a,b) the same as in Fig.2. (a) Without PMC, the signal of ~75% of the repetitions (158/216) is outside the sampling window; blue a=14.5, b=2.5, r2=0.93. (b) less than 4% (4/216) of repetitions show signal loss. Almost all acquisitions show 2 motion updates; blue a=-0.5, b=3.5, r2=0.1. (c) A linear dependency of the residual echo-shift from the k-space center upon rotational acceleration is now visible; blue a=0.5, b=-0.3, r2=0.4.
    Figure 2: k-space shifts versus rotational velocities at TE=80ms. (a) Without PMC, the signal of less than 50% of repetitions (93/216) is in the sampling window. This occurs for rotational velocities $$$|\omega_{r}|<6^{\,\circ}/\mathrm{s}$$$, in agreement with the simulations (grayed band). From theory: $$$\Delta k_{x}^{max}=a\omega_{r}+b$$$; blue a=17.5, b=3.4, r2=0.97. (b) With PMC on, less than 4% (2/216) of repetitions are lost. Two main subpopulations are present, depending upon whether 2 (blue) or 3 (red) motion updates have been applied; blue a=1.8, b=6.3, r2=0.3.
  • Multi-shot diffusion MRI of the human brain with motion-compensated oscillating gradients
    Eric Seth Michael1, Franciszek Hennel1, and Klaas Paul Pruessmann1
    1Institute for Biomedical Engineering, ETH Zurich and University of Zurich, Zurich, Switzerland
    The use of motion-compensated oscillating diffusion gradients permitted high-resolution, interleaved acquisitions of the in-vivo human brain.  This implementation produced images void of visible artifacts without the use of additional computational techniques.
    Figure 4. Time series of DW three-shot images across dynamics for all gradient shapes (left), and the complex average across dynamics (right). All images capture the same slice of one subject. The diffusion-sensitizing gradient was aligned with the z-direction. Significant artifacts confound each dynamic and the subsequent average for PGSE acquisitions; no such issue occurs for either OGSE acquisition, for which fine anatomical detail can be seen.
    Figure 2. Phase differences with respect to the first dynamic (different columns) across subsequent single-shot dynamics for each diffusion sensitization scheme (different rows). Phase is observed to have more pronounced fluctuations (i.e., of greater magnitude) among PGSE dynamics than among dynamics of either OGSE acquisition. Between both forms of OGSE, phase variations are similar.
  • Highly Accelerated Multi-shot EPI based Diffusion MRI Using SMS and Joint k-q Under-sampling Enabled Using Deep Learned Manifold Priors
    Merry Mani1, Vincent Magnotta1, and Mathews Jacob1
    1University of Iowa, Iowa City, IA, United States
    We propose a new acceleration & reconstruction method for highly accelerated multi-shot dMRI. The work combines multi-band excitation with joint k-q undersampling. New iterative reconstruction with deep learned q-space manifold priors enables the recovery from 12-fold accelerated data.
    Figure 3: Proposed joint recovery: (a) shows the images from the proposed sampling scheme with SMS & joint k-q acceleration. The goal is to recover all DWIs jointly & simultaneously unfold the slices from the MB excitation. (b) During the iterative recovery, the 1st term in Eq [1] performs unaliasing arising from the multi-band excitation & k-space under-sampling. The q-space prior performs voxel-wise projection of the diffusion signals to the learned manifold (illustrated in (c)). The TV prior imposes DWI smoothness. The joint recovery maximally exploits the redundancy in the data.
    Figure 4: Proposed joint reconstruction from two samples DWIs. (a)-(c) shows the reconstruction from the fully sampled data from all 4 shots, which were accelerated using multi-band imaging only at MB=3. (b) shows the individual SMS MUSSELS reconstruction and (c) shows the joint reconstruction using the proposed method. (d)-(e) corresponds to the acquisition with additional 4-fold acceleration from joint k-q under-sampling. (e) shows two sample DWIs from the joint recovery of all the 20 DWIs from all the 3 slices simultaneously.
  • Optimising spiral diffusion tensor cardiovascular magnetic resonance for high resolution ex-vivo STEAM imaging on a clinical scanner
    Malte Roehl1,2, Peter D Gatehouse1,2, Pedro F Ferreira1,2, Sonya V Babu-Narayan1,2, David N Firmin1,2, Dudley J Pennell1,2, Sonia Nielles-Vallespin1,2, and Andrew D Scott1,2
    1National Heart and Lung Institute, Imperial College London, London, United Kingdom, 2Cardiovascular Magnetic Resonance Unit, Royal Brompton Hospital, London, United Kingdom
    Ex-vivo diffusion tensor cardiovascular magnetic resonance provides insights into cardiac microstructure and validation of in-vivo methods. To overcome limitations of current EPI methods we present an interleaved spiral approach, yielding good image quality at high resolution.
    Figure 5:Comparison of HA, E2A, MD and FA for a single midventricular slice in a porcine ex vivo heart using a spiral readout and an EPI readout. Both using the same STEAM approach, multiple averages (both using complex averaging) and the same total acquisition time of 2hours.
    Figure 4:A) DT-CMR maps reconstructed from data acquired with similar total acquisition duration, but increasing numbers of spiral interleaves/decreasing numbers of interleaves. Total acquisition time was 2h for rows 1-4. B) Plot of mean transmural HA-R2 of the data shown in A. C) Plot of Transverse Angle standard deviation of the data shown in A.
  • The Influence of Navigator Acquisition on 3D Multi-slab DWI Reconstruction: A Comparison between 2D, 3D Acquired and Synthesized Navigator
    Simin Liu1, Erpeng Dai2, and Hua Guo1
    1Center for Biomedical Imaging Research, Department of Biomedical Engineering, School of Medicine, Tsinghua University, Beijing, China, 2Department of Radiology, Stanford University, Stanford, CA, United States
    Using the k-space-based reconstruction, the synthesized 3D navigator has similar performance with the acquired 3D navigator for multi-slab and outperforms the 2D navigator for both multi-slab and SMSlab.
    Figure 4. The 1 mm isotropic mean DWI images (a), MD (b) and FA maps (c) of SMSlab DTI with 20 diffusion directions, from three orthogonal views. The images are reconstructed by k-space-based reconstruction with a synthesized 3D navigator.
    Figure 3. The reconstructed images from two volunteers, by k-space-based reconstruction with (a) the acquired (for SMSlab) or extracted (for multi-slab) 2D navigator, (b) the synthesized 3D navigator and (c) the acquired 3D navigator (only for multi-slab).
  • Four-shot Navigator-free Spiral Acquisition Strategy for High-resolution Diffusion Imaging
    Guangqi Li1, Xinyu Ye1, Xin Shao1, Xiaodong Ma2, and Hua Guo1
    1Center for Biomedical Imaging Research, Department of Biomedical Engineering, School of Medicine, Tsinghua University, Beijing, China, 2Center for Magnetic Resonance Research, Radiology, Medical School, University of Minnesota, Minneapolis, MN, United States
    This study demonstrates that POCS-ICE algorithm has a powerful capability to correct phase errors and reconstruct DWI images simultaneously for navigator-free acquisitions. Based on our proposed acquisition strategy, high-resolution DWI can be acquired using a 4-shot spiral acquisition.
    Figure 2: T2-weighted images (b=0) and diffusion-weighted images (b=1000 s/mm2) acquired by different spiral acquisition schemes. Single-shot EPI DWI were also shown as a reference. Based on the proposed acquisition strategy, for 4-shot spiral acquisition, the readout duration was reduced from 41.0 ms to approximately 30.0 ms. The blurring effects were significantly reduced, and the image quality was improved.
    Figure 3: Colored FA maps of six slices. The results show that 4-shot spiral variants can provide fine DTI metrics, which indicates that POCS-ICE algorithm can successfully correct motion-induced phase errors for these 4-shot spiral variants.
  • Super-resolution and distortion-corrected diffusion-weighted imaging using 2D super-resolution generative adversarial network
    Pu-Yeh Wu1, Weiqiang Dou1, Hongyuan Ding2, Jiulou Zhang3, Yong Shen1, Guangnan Quan1, Zhangxuan Hu1, and Bing Wu1
    1GE Healthcare, Beijing, China, 2Radiology Department, The First Affiliated Hospital of Nanjing Medical University, Nanjing, China, 3Artificial Intelligence Imaging Laboratory, School of Medical Imaging, Nanjing Medical University, Nanjing, China
    We proposed a deep learning-based method for super-resolution DWI reconstruction using SRGAN and multi-shot DWI as target. Our preliminary results demonstrated that the proposed method could provide perceptually convincing super-resolution and distortion-corrected DWI images.
    Figure 3. Representative T2WI, DWI, MUSE, and SRGAN reconstructed images.
    Figure 4. Detailed comparison among DWI, MUSE, SRResNet, and SRGAN reconstructed images.
  • Evaluation of Saturation Effects in Simultaneous Multi-Contrast (SMC) Imaging
    Nora-Josefin Breutigam1, Daniel Christopher Hoinkiss1, Mareike Alicja Buck 1,2, Klaus Eickel1,2, Matthias Günther1,2, and David Porter3
    1Imaging Physics, Fraunhofer MEVIS, Bremen, Germany, 2Faculty 01 (Physics/Electrical Engineering), University Bremen, Bremen, Germany, 3Imaging Centre of Excellence (ICE), University of Glasgow, Glasgow, Scotland
    Simultaneous multi-contrast imaging (SMC) can be used to combine acquisition of diffusion-weighted and T2*-weighted images into a single scan. Saturation effects can reduce SNR and alter contrast. In this study, these effects are investigated in simulations, in phantoms, and in vivo.
    Figure 5: Data from a high-resolution, trace-weighted acquisition with and without SMC. Three out of 20 slices are displayed. The potential protocol for clinical use shows minimized SNR loss and contrast changes in the DW images. The SNR loss in the T2*W case is higher, but this is more than offset by four-fold averaging (from b-value of zero and three diffusion-gradient directions with b = 1000 s/mm2). Contrast change in T2*W case is mainly due to high CSF signal saturation.
    Figure 2: Measured and simulated saturation for both contrast types in the phantom as a function of the T2*W excitation flip angle with and without the use of split-slice GRAPPA during image reconstruction. The trend of the three curves is almost identical. The simulation overestimates saturation. Additionally, standard deviations of experimental data are higher than the simulation would have suggested. Reasons could be the uncorrected frequency drift and normal differences between two separated acquisition as can be seen in the table below.
  • Distortion-free high-resolution diffusion weighted imaging of mouse brain using diffusion-prepared 3D VF-RARE
    Qiang Liu1,2, Yuanbo Yang1,2, Xinyuan Zhang1,2, Yingjie Mei1,2,3, Qiqi Lu1,2, Guoxi Xie4, and Yanqiu Feng1,2
    1School of Biomedical Engineering, Southern Medical University, Guangzhou, China, 2Guangdong Provincial Key Laboratory of Medical Image Processing, Southern Medical University, Guangzhou, China, 3Philips Healthcare, Guangzhou, China, 4Department of Biomedical Engineering, School of Basic Sciences, Guangzhou Medical University, Guangzhou, China
    The present work investigated the implement of Diffusion-Prepared 3D RARE sequence using a variable flip-angle strategy to acquire distortion free diffusion weighted images on a small animal pre-clinical 7 T scanner. 
    Figure 2 Comparisons of both non-diffusion and diffusion weighted images of mouse brain acquired using Diffusion-prepared 3D VF-RARE and single-shot EPI. a: T2-RARE was acquired as anatomy reference. b, c : b=0 s/mm2 images of sequence DP VF-RARE and SS-EPI. d, e : b=500 s/mm2 images of sequence DP VF-RARE and SS-EPI.
    Figure 3 Comparison of in vivo FA maps (a, b) and color-encoded FA maps (c,d) of an adult mouse brain acquired using DP 3D VF-RARE and SS-EPI. The areas of cortex and hippocampus were used in the following MD’s and FA’s calculation.
Back to Top
Digital Poster Session - Diffusion Acquisition & Post-Processing
Diffusion/Perfusion
Monday, 17 May 2021 15:00 - 16:00
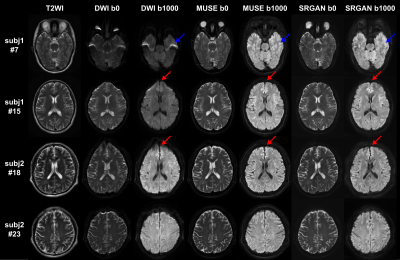
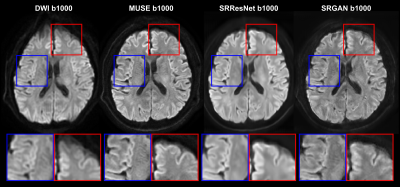
  • Improved Super-Resolution reconstruction for DWI using multi-contrast information
    Xinyu Ye1, Pylypenko Dmytro1, Yuan Lian1, Yajing Zhang2, and Hua Guo1
    1Center for Biomedical Imaging Research, Department of Biomedical Engineering, School of Medicine, Tsinghua University, Beijing, China, 2MR Clinical Science, Philips Healthcare, Suzhou, China
    We propose an improved deep-learning based 3D super resolution network to increase resolution for DWI images. With the help of anatomical images and a novel FA loss function, the proposed method improves the reconstruction accuracy.
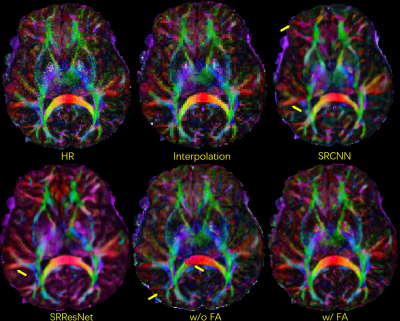
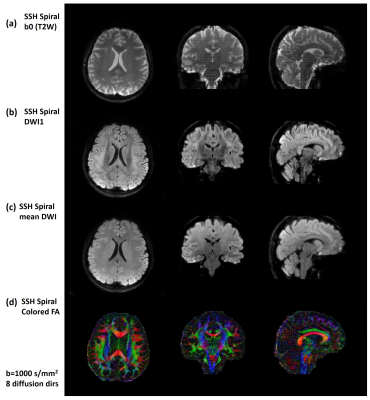
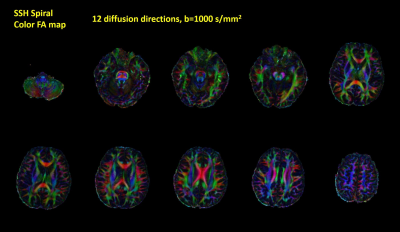
    Fig. 5. Colored FA maps of different methods. The proposed method can recover fine fiber structures. With the introduction of FA loss function, the contrast contamination among diffusion directions can be reduced.

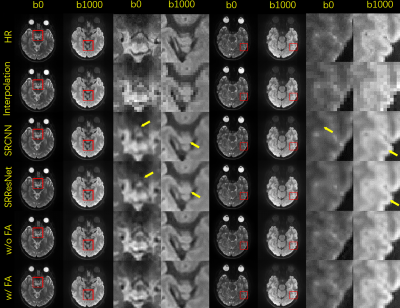
    Fig. 3. Selected comparison results and zoomed-in images of in-vivo DWI data. b0 and mean DWI results from 2 representative slices are shown. In the zoomed-in images, the arrows point to the structures that SRCNN and SRResNet fail to recover.

  • A Model-driven Deep Learning Method Based on Sparse Coding to Accelerate IVIM Imaging in Fetal Brain
    Tianshu Zheng1, Cong Sun2, Guangbin Wang2, Weihao Zheng1, Wen Shi1, Yi Sun3, Yi Zhang1, Chuyang Ye4, and Dan Wu1
    1Key Laboratory for Biomedical Engineering of Ministry of Education, Department of Biomedical Engineering, College of Biomedical Engineering & Instrument Science, Zhejiang University, Hangzhou, Zhejiang, China,, Zhengjiang University, Hangzhou, China, 2Department of Radiology, Shandong Medical Imaging Research Institute, Cheeloo College of Medicine, Shandong University, 324, Jingwu Road, Jinan, Shandong, 250021, People's Republic of China, Shandong University, Jinan, China, 3Department of Radiology 2MR Collaboration, Siemens Healthcare China, Shanghai, China, Siemens Healthcare China, Shanghai, China, 4chool of Information and Electronics, Beijing Institute of Technology, Beijing Institute of Technology, Beijing, China
    We proposed a Model-driven deep learning neural network based on sparse coding which reliably predicted the IVIM parameters in the fetal brain with only a subset of the diffusion data while retaining good interpretability, and therefore, could potentially accelerate IVIM acquisition.
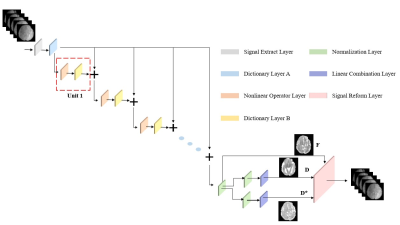
    Figure1. Briefly, in the signal extract layer, signals were extracted from each voxel as the input for dictionary A. Each unit in the red dashed box was comprised of a nonlinear operator layer and a dictionary layer B. We chose ReLU as the Nonlinear layer. This process was repeated 10 times. Then the output was transferred to the Normalization. [f, D, D*] can be obtained using the linear combination layer (Eq [4-6]). Lastly, the output parameters are fed into the signal reform layer according to IVIM model to reconstruct the signals which are compared with the input as part of the loss function.
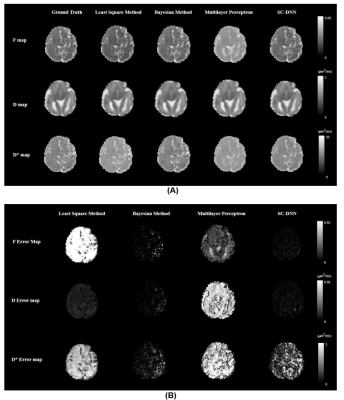
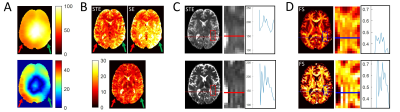
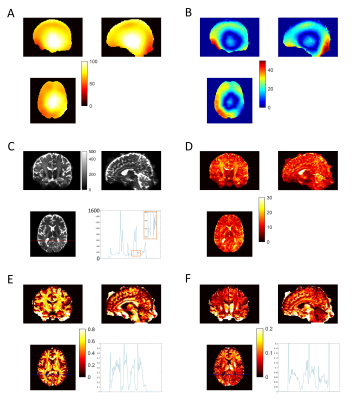
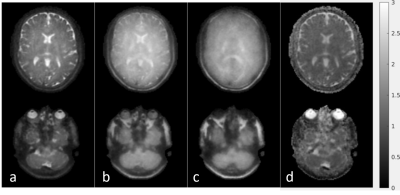
    Figure2. (A) Estimated f, D, and D* parameter maps using the least square or Baysian fitting of the bi-exponential model, multilayer perceptron, and the proposed SC-DNN. The ground truth was obtained by adding noise after recovering from the previous parameters according to the IVIM model. (B) Residual error maps between the fitted parameters and the ground truth via different methods.
  • Jointly Denoise Diffusion-weighted Images Using a Weighted Nuclear Norm Minimization Approach
    Yujiao Zhao1,2, Linfang Xiao1,2, Zhe Zhang3, Yilong Liu1,2, Hua Guo4, and Ed X. Wu1,2
    1Laboratory of Biomedical Imaging and Signal Processing, The University of Hong Kong, Hong Kong, China, 2Department of Electrical and Electronic Engineering, The University of Hong Kong, Hong Kong, China, 3China National Clinical Research Center for Neurological Diseases, Beijing Tiantan Hospital, Capital Medical University, Beijing, China, 4Center for Biomedical Imaging Research, Department of Biomedical Engineering, School of Medicine, Tsinghua University, Beijing, China
    A joint denoising method for diffusion-weighted images using low-rank matrix approximation is proposed. It exploits structural similarities of DW images, leading to significant noise reduction in all DW images and revealing more microstructural details in quantitative diffusion maps.
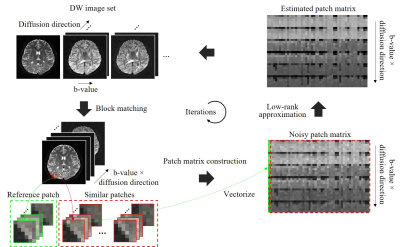
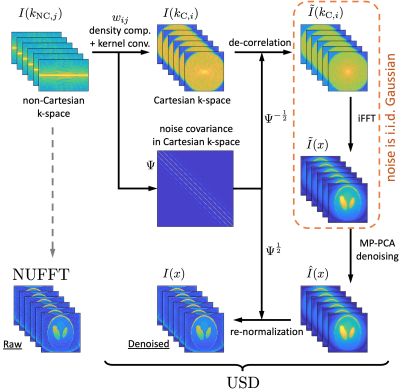
    Fig. 1. Diagram of the proposed joint denoising method. Within each iteration: (1) extracting reference patches using a sliding window and searching for similar patches through block matching; (2) for each reference patch, stretching its similar patches to vectors and stacking them into a matrix to form a low-rank patch matrix; (3) for each patch matrix, estimating a noise-free patch matrix through a weighted nuclear norm minimization (WNNM) model; (4) converting estimated patch matrices back to images.
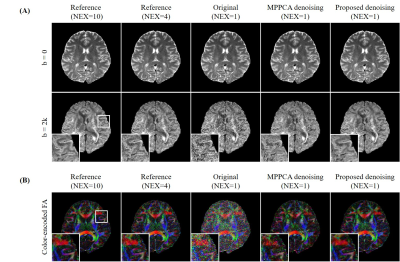
    Fig. 3. Denoising results with in vivo DW brain images (A) and resulting diffusion metric maps computed from denoised DW images (B). The image set contains one b0 image and 6 DW images with b =2000 s/mm2. Only DW image along one direction is shown. The image set of NEX=1 was used for denoising, while the image set of NEX=4/10 was used as high SNR reference. At very low SNR, the proposed method was still robust and more effective than MPPCA in reducing noise while recovering structural details when compared to reference. It achieved image quality and FA map comparable to those using 4 averages.
  • SuperDTI: Superfast Deep-learned Diffusion Tensor Imaging
    Hongyu Li1, Zifei Liang2, Chaoyi Zhang1, Ruiying Liu1, Jing Li3, Weihong Zhang3, Dong Liang4, Bowen Shen5, Peizhou Huang6, Sunil Kumar Gaire1, Xiaoliang Zhang6, Yulin Ge2, Jiangyang Zhang2, and Leslie Ying1,6
    1Electrical Engineering, University at Buffalo, State University of New York, Buffalo, NY, United States, 2Center for Biomedical Imaging, Radiology, New York University School of Medicine, New York, NY, United States, 3Radiology, Peking Union Medical College Hospital, Peking Union Medical College and Chinese Academy of Medical Sciences, Beijing, China, 4Paul C. Lauterbur Research Center for Biomedical Imaging, Medical AI research center, SIAT, CAS, Shenzhen, China, 5Computer Science, Virginia Tech, Blacksburg, VA, United States, 6Biomedical Engineering, University at Buffalo, State University of New York, Buffalo, NY, United States
    This paper demonstrates the feasibility of superfast DTI and fiber tractography using deep learning with as few as six corrupted DWIs (up to 30-fold). Such a significant reduction in scan time will allow the inclusion of DTI into clinical routine for many potential applications.
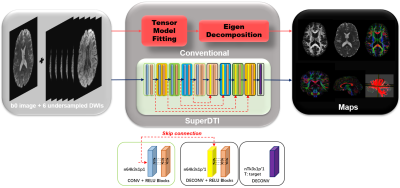
    FIGURE 1. Schematic comparison of the conventional DTI model fitting and deep learning methods SuperDTI for generating various diffusion quantification maps.
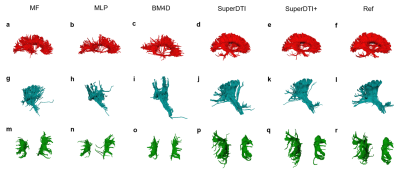
    FIGURE 4. Comparison of fiber tractography generated from 6 DWIs using different methods. Corpus callosum, internal capsule/corticospinal tract, and superior longitudinal fasciculus generated by MF (a), MLP (b), BM4D (c), proposed SuperDTI (d), proposed SuperDTI+ (e) with additional k-space reduction (l), respectively, and the corresponding difference map (g-k) with 6 DWIs. The model-fitted tractography from 90 DWIs (d, k, r) is also shown as a reference.
  • Deep learning for synthesizing high-b-value DWI of the prostate: A tentative study based on generative adversarial networks
    lei hu1, jungong Zhao1,2, Caixia fu3, and Thomas Benkert4
    1Department of Diagnostic and Interventional Radiology, Shanghai Jiao Tong University Affiliated Sixt, 上海, China, 2Department of Diagnostic and Interventional Radiology, Shanghai Jiao Tong University Affiliated Sixt, shanghai, China, 3MR Application Development, Siemens Shenzhen magnetic Resonance Ltd, shanghai, China, 4MR Application Predevelopment, Siemens Healthcare, Erlangen, Gernmany, Erlangen, Germany
    A deep learning framework based on GAN is a promising method to synthesize realistic high-b-value DWI sets with good image quality and accuracy in PCa detection.  
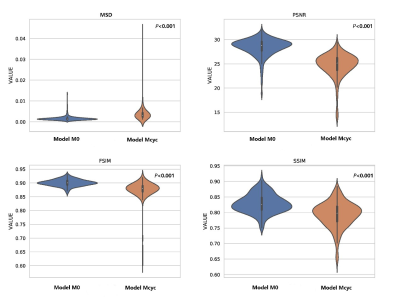
    Fig.1 Violin plots of distributions of the quantitative metrics between M0 and Mcyc.
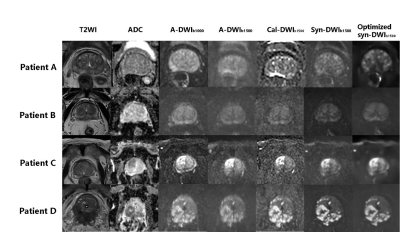
    Fig.2 T2WI, ADC, a-DWIb1000, a-DWIb1500, cal-DWIb1500, non-optimized syn-DWIb1500 vs. optimized syn-DWIb1500 of four different patients. Patient A: A 76-year-old man with chronic prostatitis. Patient B: A 63-year-old man with prostatic hyperplasia. Patient C: An 87-year-old man with prostatic cancer in the right transition zone. (Gleason score, 4+3). Patient D: A 69-year-old man with prostatic cancer in the peripheral zone invading the rectum (Gleason score 4+5).
  • IVIM Imaging of Lung Cancer: A Comparison Between Gradient-and Spin-Echo, Turbo Spin-Echo and Echo-Planar Imaging Techniques
    Tianyu Zhang1, Yishi Wang2, Chengxiu Yuan1, Xiaoyu Wang1, Jia Zhao1, and Huaqiang Sheng1
    1The First Affiliated Hospital of Shandong First Medical University, Jinan, China, 2Philips Healthcare, Beijing, China
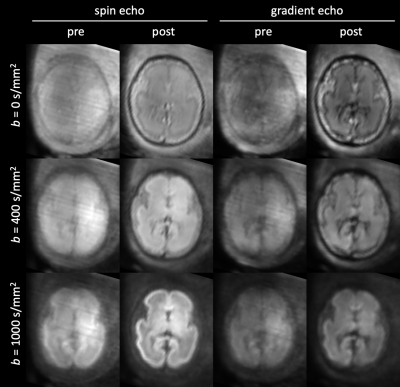
    Single-shot gradient- and spin-echo (SS-GRASE) technology is a useful technique for IVIM imaging of lung cancer
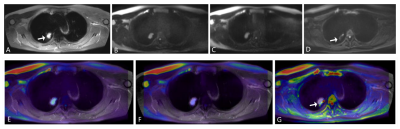
    FIGURE 1. A nodular lesion (arrow) in the right upper lobe. A, T2WI-SPIR. B, GRASE-IVIM (b = 800 s/mm2 ). C, TSE-IVIM (b = 800 s/mm2 ). D, EPI-IVIM (b = 800 s/mm2 ).E,T2WI fused with GRASE-IVIM. F, T2WI fused with TSE-IVIM.G, T2WI fused with EPI-IVIM. The distortion and displacement of the lesion are shown on EPI-IVIM (arrow). On TSE and GRASE-IVIM ,the lesion, along with its air bronchus, can be clearly shown. Fused images showed that GRASE and TSE-IVIM is perfectly matched with T2WI-SPIR.
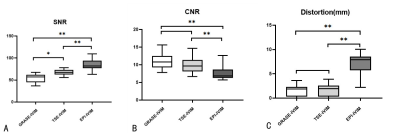
    FIGURE 2. Comparison of SNR,CNR and Distortion between GRASE-IVIM,TSE-IVIM and EPI-IVIM.
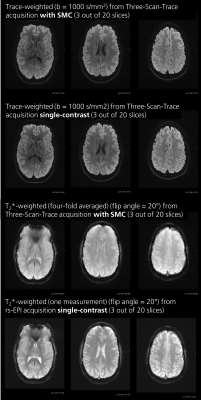
  • Flip-angle optimization for the diffusion-weighted SPLICE sequence for applications in brain imaging
    Sofie Rahbek1, Tim Schakel2, Faisal Mahmood3,4, Kristoffer H. Madsen5,6, Marielle E.P. Philippens2, and Lars G. Hanson1,5
    1Department of Health Technology, Technical University of Denmark, Kgs. Lyngby, Denmark, 2Department of Radiotherapy, University Medical Center Utrecht, Utrecht, Netherlands, 3Laboratory of Radiation Physics, Odense University Hospital, Odense, Denmark, 4Department of Clinical Research, University of Southern Denmark, Odense, Denmark, 5Danish Research Centre for Magnetic Resonance, Centre for Functional and Diagnostic Imaging and Research, Copenhagen University Hospital Hvidovre, Hvidovre, Denmark, 6Department of Applied Mathematics and Computer Science, Technical University of Denmark, Kgs. Lyngby, Denmark
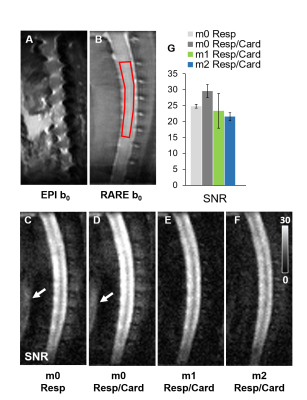
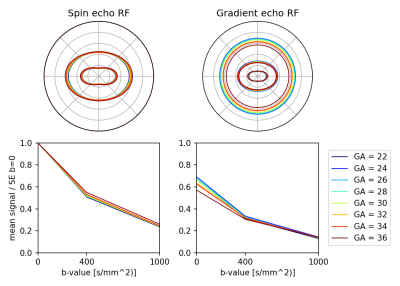
    The diffusion-weighted SPLICE sequence was improved using the proposed framework for optimization of individual refocusing flip-angles in the echo-train. This provides optimal SNR for a given spatial point spread function representing a desired resolution and acceptable Gibbs ringing. 
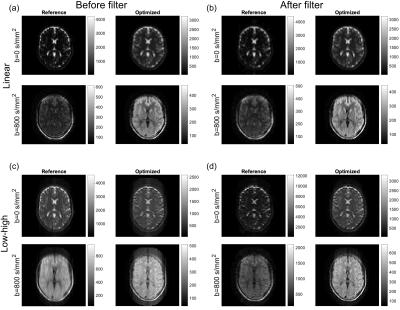
    Brain images for the reference scheme (constant FA of 120°) and optimized FA scheme, respectively. (a-b): Data sampled with linear phase-encoding order before and after applying calculated filters. (c-d): Data sampled with center-out phase-encoding order before and after applying calculated filters.

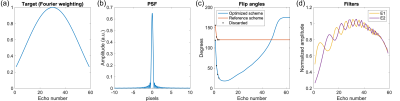
    The Hanning target function (a) and corresponding PSF (b) having a low FWHM and limited ripples. The optimized FAs (c) together with the reference scheme of 120° flips. The first four echoes are marked as “transients” and discarded for improved robustness. The resulting filters for both echo families, E1 and E2, normalized with the coefficient used for the center of k-space.

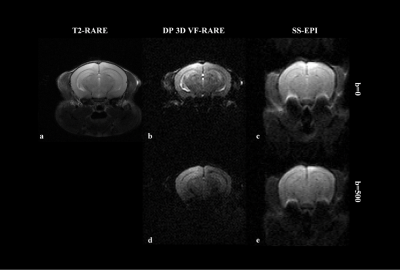
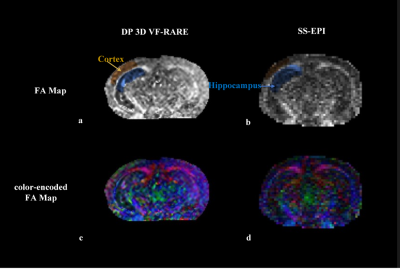
  • Validating the Accuracy of Multi-Spectral Metal Artifact Suppressed Diffusion-Weighted Imaging
    John Neri1, Matthew F Koff1, Kevin M Koch2, and Ek Tan1
    1Radiology and Imaging, Hospital for Special Surgery, New York, NY, United States, 2Medical College of Wisconsin, Wauwatosa, WI, United States
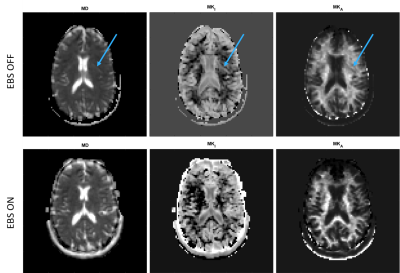
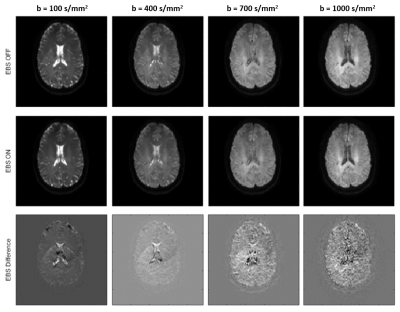
    MAVRIC diffusion weighted imaging can image tissue microstructure in peri-prosthetic regions with strong magnetic susceptibility effects. This work compares the accuracy of DWI-MAVRIC relative to conventional echo planar-imaging-based DWI.
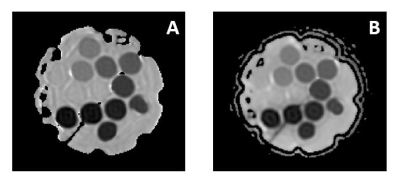
    Figure 1: (A) Coronal DWI-EPI (NEX = 1) and (B) Coronal DWI-MAVRIC (bins=3) images of 13 PVP vials contained in phantom. (A)DWI-EPI contains low EPI distortion while (B) DWI-MAVRIC contains no EPI distortion.
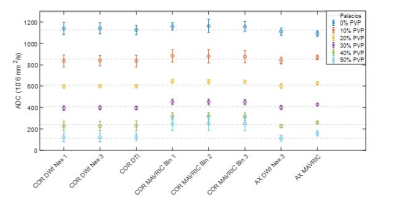
    Figure 2: ADC mean values for eight acquired scans (six coronal, two axial) at all six polymer concentrations. The dashed lines show the references values from Palacios et al.(10) for all six concentrations.
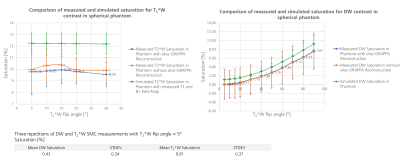
  • Quantitative Accuracy of Diffusion-Weighted Imaging Techniques as a Function of Susceptibility Artifact Resilience
    Volkan Emre Arpinar1,2, Alexander D Cohen1, Sampada Bhave3, and Kevin M Koch1,2
    1Radiology, Medical College of Wisconsin, Milwaukee, WI, United States, 2Center for Imaging Research, Medical College of Wisconsin, Milwaukee, WI, United States, 3Canon Medical Research USA, Cleveland, OH, United States
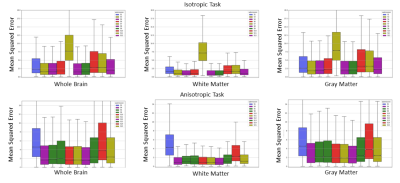
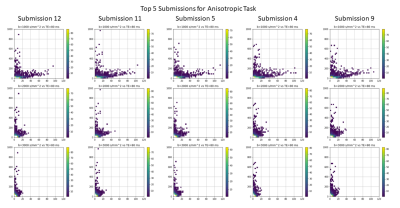
    There are several different acquisition approaches to mitigate susceptibility artifacts in DWI.  The quantification performance of a selection of these approaches were evaluated in phantom and volunteer experiments. 
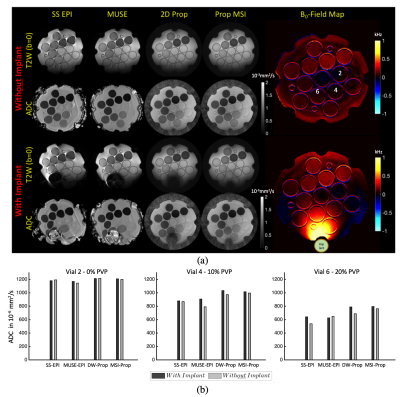
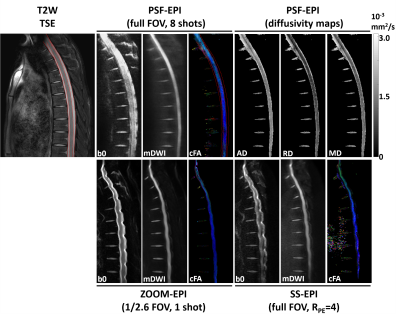
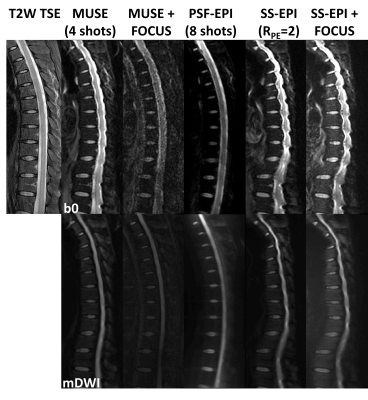
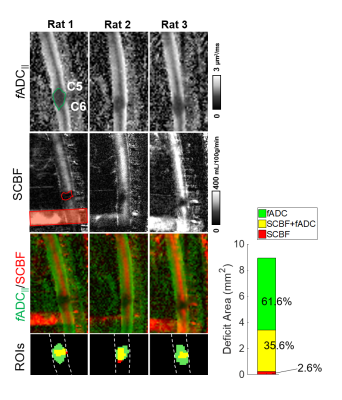
    Fig.3. (a) Representative T2W(b=0) images and associated ADC maps: ADC's are shown for each of the four evaluated methods. Significant distortion seen in the SS-EPI, both with and without the presence of the metal high susceptibility source. Without the metal, image distortions were relatively mitigated with MUSE EPI. Qualitatively, DW-Prop and MSI-Prop were less susceptible to susceptibility artifacts. Vial 6 was largely non-viable in the SS-EPI and MUSE-EPI, but showed perfect geometry in DW & MSI-Prop. Vial 6 were compromised in DW-Prop, but were fully recovered in MSI-Prop.
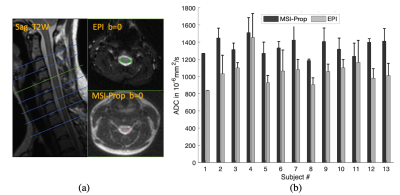
    Fig.4. (a) Representative EPI and MSI-Prop T2W (b=0) images and spinal cord ROIs. Significant distortions can be seen for the EPI. MSI-Prop provided more anatomically accurate imaging of the cord. (b) ADC values computed with MSI-Prop were roughly 20% larger on average than the FOCUS EPI images. The computed bias was 293·10-6mm2/s among 13 subjects’ mean cord ADC values.
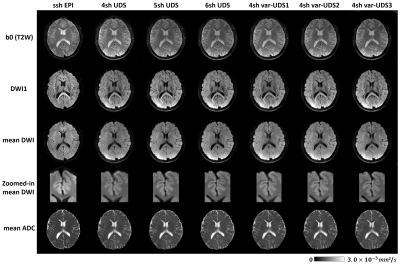
  • Simultaneous Reconstruction of High-resolution Multi b-value DWI with Single-shot Acquisition
    Fanwen Wang1, Hui Zhang1, Fei Dai1, Weibo Chen2, Chengyan Wang3, and He Wang1,3
    1Institute of Science and Technology for Brain-Inspired Intelligence, Fudan University, Shanghai, China, 2Philips Healthcare, Shanghai, China, 3Human Phenome Institute, Fudan University, Shanghai, China
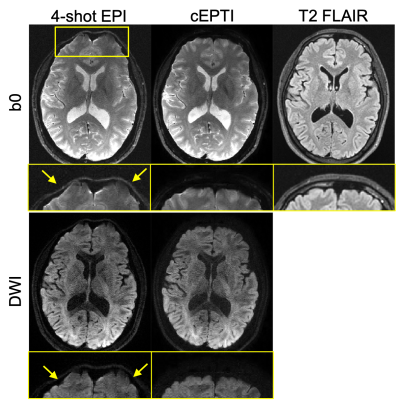
    This study proposed a novel method to reconstruct four-shot high-resolution DWIs from one-shot data for multiple b-values simultaneously, enabling the physiological feature transformation through different b-value.
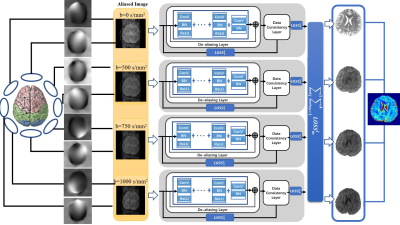
    Figure 1: The proposed model for multi-coil high-resolution DWI reconstruction. The network combines losses from four channels to back propagate. Each channel consists of a de-aliasing layer and a data consistency layer to recover from aliasing artifacts.
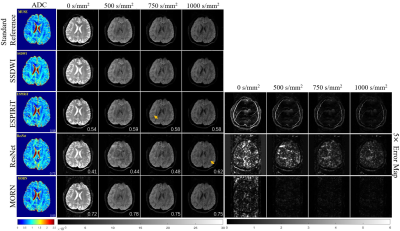
    Figure 2: Comparison of reconstructed images for multiple b-values in healthy volunteers. The calculated ADC maps are shown leftmost. The b-values are listed on each column. SSIMs are listed at the bottom-right of each image. The rightmost four columns represent the corresponding error maps. The error was x5 amplified for better visualization. The aliasing artifacts are shown by arrows.
  • Robust method for Whole Body DWIBS applied both Image based B0 Shimming and Blip-up Blip-down Distortion Correction
    Hiroshi Hamano1, Masami Yoneyama1, Yasutomo Katsumata2, Kazuhiro Katahira3, and Kenji Iinuma1
    1Philips Japan, Tokyo, Japan, 2Philips Healthcare, Tokyo, Japan, 3Department of Radiology, Kumamoto Chuo Hospital, Kumamoto, Japan
    DWIBS sometimes suffers from sever image distortion due to the presence of air within and/or at edge of the FOV. We demonstrated that whole body DWIBS applied both image based B0 shimming and blip-up blip-down distortion correction to provide higher robustness.
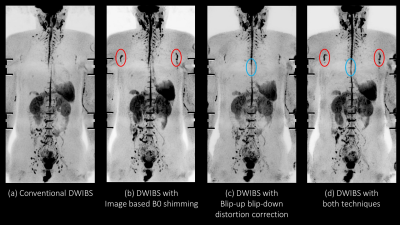
    Figure 2. The MIP of direct coronal whole body DWIBS at 3.0T were shown. Image based B0 shimming provided improving depiction of axillary lymph nodes (red circle). Blip-up blip down distortion correction also decrease distortion effect due to the presence of air (blue circle).
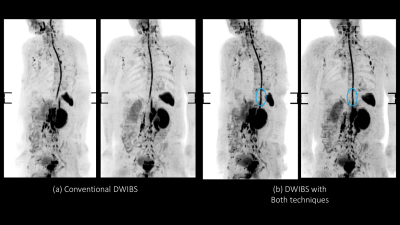
    Figure 4. The MIP of transverse DWIBS at 1.5T were shown. Similar findings to 3.0T were obtained at 1.5T.
  • Is Perfect Filtering Enough Leading to Perfect Phase Correction?
    Feihong Liu1,2, Junwei Yang2,3, Zhiming Cui2,4, Xiaowei He1,5, Jun Feng1,5, and Dinggang Shen2,6,7
    1School of Information Science and Technology, Northwest University, Xi'an, China, 2School of Biomedical Engineering, ShanghaiTech University, Shanghai, China, 3Department of Computer Science and Technology, University of Cambridge, Cambridge, United Kingdom, 4Department of Computer Science, The University of Hong Kong, Hong Kong, China, 5State-Province Joint Engineering and Research Center of Advanced Networking and Intelligent Information Services, Xi'an, China, 6Shanghai United Imaging Intelligence Co., Ltd., Shanghai, China, 7Department of Artificial Intelligence, Korea University, Seoul, Korea, Republic of
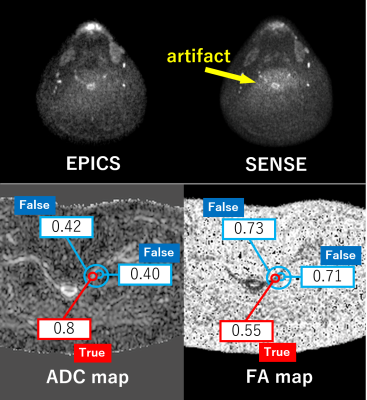
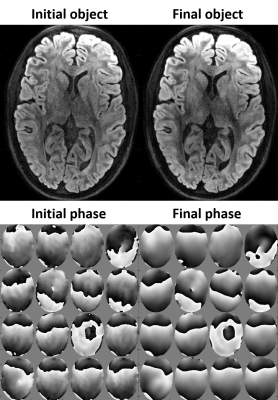
    We calibrated the phase correction procedures with the goal of unbiased white matter microstructure estimation.
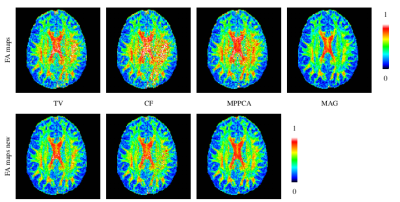
    `FA maps new' denotes the phase correction results obtained by the renewed procedures. Artifacts are significantly eliminated for all three methods, while the FA values in corpus callosum is increased properly.
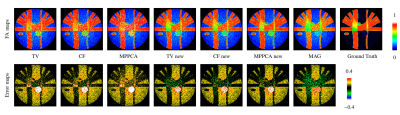
    `TV new', `CF new', and `MPPCA new' denote the phase correction results obtained by the renewed procedures. The renewed procedures yield more accurate FA values, especially for MPPCA. Black color of white matter means high accuracy achieved. MAG denotes the magnitude images.
  • Optimal Diffusion Sampling Scheme for High Performance Gradients
    Nastaren Abad1, Luca Marinelli1, Radhika Madhavan1, James Kevin DeMarco2, Robert Y Shih2,3, Vincent B Ho2,3, Gail Kohls2, and Tom K.F Foo1
    1General Electric Global Research, Niskayuna, NY, United States, 2Walter Reed National Military Medical Center, Bethesda, MD, United States, 3Uniformed Services University of the Health Sciences, Bethesda, MD, United States
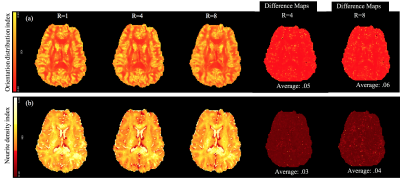
    To establish a benchmark for future studies this study utilized a data driven approach for optimizing diffusion sampling for high-performance gradients, focusing on b-value and noise performance on uncertainty in tensor estimates & fiber orientation to resolve sub-voxel information.
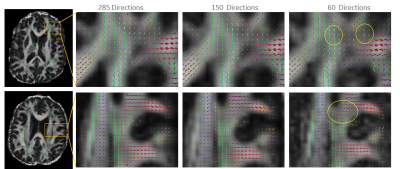
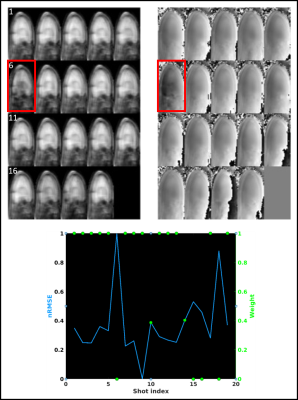
    Figure 5. fODFs over two slices highlight exemplary insets as # directions is uniformly decreased. Interestingly, at half the sample size of the superset, the principal component is retained. Even with the sample size scaled to a 1/4th of the original dataset, the principal component is retained, though, a slight uptick in noise is evident in the fiber crossing and interfacial regions. (“noisy” lobes: yellow circles).
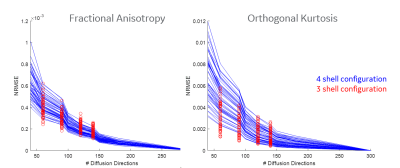
    Figure 4. Normalized root mean square error (NRMSE) over 76 WM bundles for FA and Orthogonal Kurtosis highlighting bias developed as # directions sampled is decreased. As is evident, the NRMSE for both FA and kurtosis grows more slowly, indicating stability compared to the standard, however, past 90 directions, the sqrt(N) scaling factor breaks down for both measures albeit the bias is not at the same scale. Interestingly, with uniform sampling over a 3-shell configuration, the bias in metrics can be reduced. Note the y-axis scale for FA and Kurtosis is not the same
  • Highly-Accelerated Multi-shot Diffusion Imaging with High Angular Resolution Enabled by k-d SVD
    Shihui Chen1 and Hing-Chiu Chang1
    1Department of Diagnostic Radiology, The University of Hong Kong, Hong Kong, Hong Kong
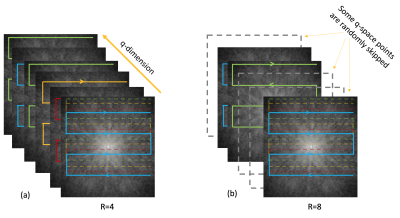
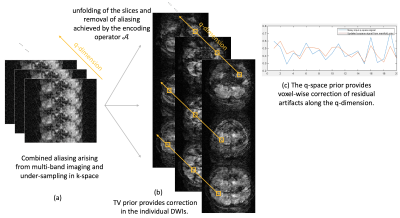
    The reconstruction scheme based on k-d SVD for high angular resolution diffusion imaging (HARDI) can provide images with improved quality at a high in-plane acceleration factor without the limitation by the number of coils. 
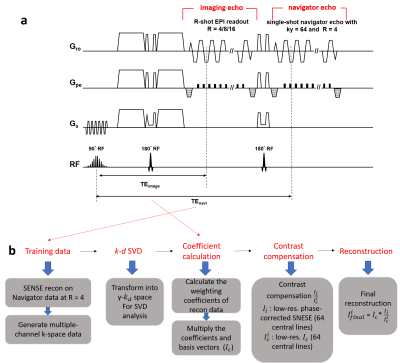
    Figure 1 (a) The proposed design of interleaved DW-EPI with navigator echo. The acceleration factor R of imaging can be 4, 8, or 16, while R for the navigator echo is fixed at 4. (b) The reconstruction pipeline based on proposed k-d SVD with contrast compensation at final step.
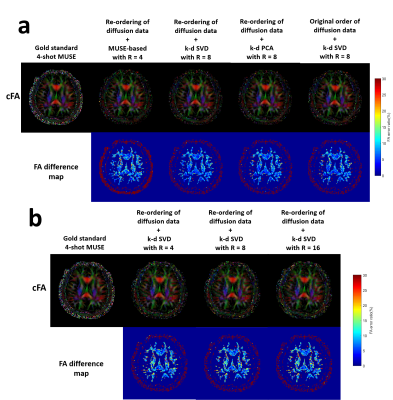
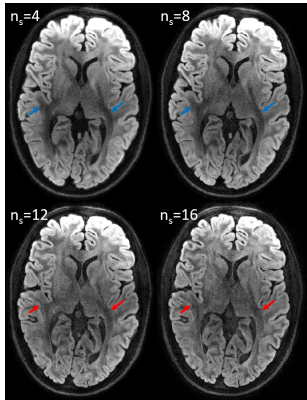
    Figure 5 (a)The comparison of colour FA map derived from gold standard images and the images reconstructed with the different strategies in Simulation 1. (b) The comparison of colour FA map derived from gold standard images and our proposed k-d SVD method at different acceleration factors (R = 4/8/16).
  • Improved multi-shot EPI ghost correction for high gradient strength diffusion MRI using Structured Low-Rank Modeling k-space reconstruction
    Gabriel Ramos-Llordén1, Rodrigo A. Lobos2, Tae Hyung Kim1, Qiyuan Tian1, Slimane Tounetki1, Thomas Witzel3, Boris Keil4, Anatasia Yendiki1, Berkin Bilgic1,5, Justin P. Haldar2, and Susie Huang1,5
    1Athinoula A. Martinos Center for Biomedical Imaging, Department of Radiology, Masachusetts General Hospital, Harvard Medical School, Charlestown, MA, United States, 2Ming Hsieh Department of Electrical and Computer Engineering, University of Southern California, Los Angeles, CA, United States, 3Q Bio Inc, San Carlos, CA, United States, 4Institute of Medical Physics and Radiation Protection, Mittelhessen University of Applied Sciences, Giessen, Germany, 5Harvard-MIT Division of Health Sciences and Technology, Massachusetts Institute of Technology, Cambridge, MA, United States
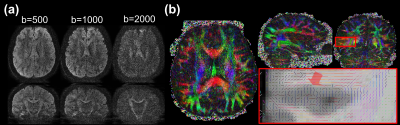
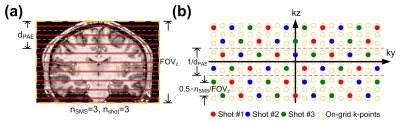
     Structured Low Rank matrix k-space reconstruction can significantly reduce ghosting artifacts in 3D multi-shot EPI diffusion MRI with high diffusion-encoding gradients, which otherwise persist with conventional reconstruction techniques.
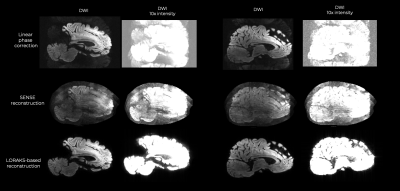
    Two representative sagittal slices reconstructed with linear phase correction, SENSE, and LORAKS-based reconstruction. Note the marked ghosting reduction obtained with LORAKS-based k-space reconstruction.
  • Quantitative Evaluation of Multiband Diffusion MRI Data
    Arun Venkataraman1, Benjamin Risk2, Deqian Qiu3,4, Jianhui Zhong1,5, Feng (Vankee) Lin6,7, and Zhengwu Zhang8
    1Physics and Astronomy, University of Rochester, Rochester, NY, United States, 2Biostatistics and Bioinformatics, Emory University, Atlanta, GA, United States, 3Radiology and Imaging Sciences, Emory University School of Medicine, Atlanta, GA, United States, 4Biomedical Engineering, Emory University, Atlanta, GA, United States, 5Imaging Sciences, University of Rochester Medical Center, Rochester, NY, United States, 6Brain and Cognitive Sciences, University of Rochester, Rochester, NY, United States, 7Neuroscience, University of Rochester Medical Center, Rochester, NY, United States, 8Biostatistics and Computational Biology, University of Rochester Medical Center, Rochester, NY, United States
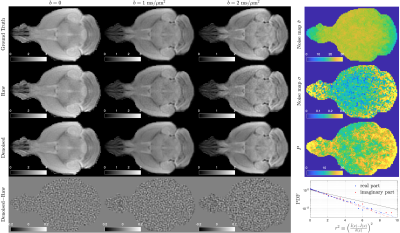
    In this study, we quantified the effects of simultaneous multislice and phase acceleration on dMRI data quality, and how patient factors such as motion influenced data quality. Faster sequences showed less patient motion, but had a drop in signal-to-noise ratio and contrast-to-noise ratio.
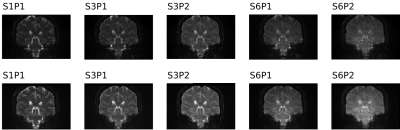
    Figure 2 Representative section from Figure 1 normalized to highest intensity of each acquisition. The noise amplification in the midbrain and brain stem is easily visualized here (right-most sections in each row).
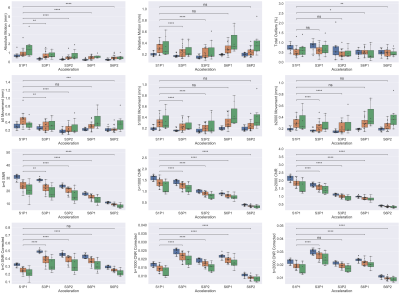
    Figure 3 Boxplots representing quality control metrics (described on y-axis labels) over different acceleration schemes (x-axis). Blue bars indicate young subjects, orange indicates healthy, old subjects, and green indicates MCI subjects. p-values calculated using a Generalized Estimating Equation (GEE) with Gaussian assumption and exchangeable correlation accounting for repeated subject scans. p-values reported after false discovery rate (FDR) correction; significance: *p<0.05, **p<0.01, ***p<0.001, ****p<0.0001.
  • Deep Learning Based Super-resolution of Diffusion MRI Data
    Zifei Liang1 and Jiangyang Zhang1
    1Center for Biomedical Imaging, Dept. of Radiology, New York University School of Medicine, NEW YORK, NY, United States
    We applied the hybrid-contrast images training to achieve the diffusion weighted images super-resolution. However, verified that distinct resolution or contrast sacrifice some efficacy of the super-resolution algorithm. 
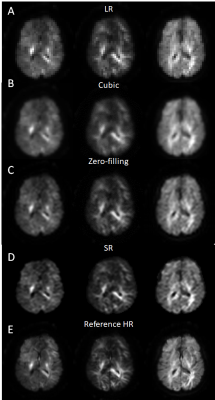
    Figure 4. Super-resolution of human brain diffusion weighted images. From top to the bottom row: A. initial Low resolution data; B. cubic interpolation; C. Zero-filling interpolation; D. ResNet output by zero-filling as pre-step interpolation; E. High resolution Reference).
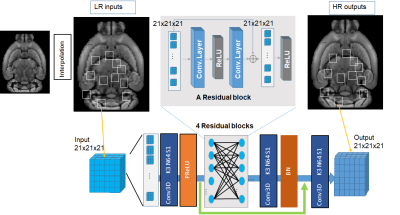
    Figure 1. The architecture of ResNet architecture (input patch size could be three dimensional 21x21x21 (or m×n×k) or two dimensional m×n, and convolution kernel should be corresponded as three dimensional and two dimensional).
  • A General Framework for Automated and Accurate b-Matrix Calculation for dMRI Pulse Sequences
    Lisha Yuan1, Qing Li2, Guojing Wei3, Hongjian He1, and Jianhui Zhong4
    1Department of Biomedical Engineering, Center for Brain Imaging Science and Technology, Zhejiang University, Hangzhou, China, 2MR Collaborations, Siemens Healthcare Ltd., Shanghai, China, 3SHS DI MR R&D SZN LP, Siemens Shenzhen Magnetic Resonance Ltd., Shenzhen, China, 4Department of Imaging Sciences, University of Rochester, Rochester, NY, United States
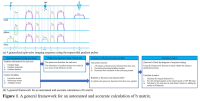
    A general framework was proposed to calculate b-matrix automatedly and accurately. Taking the effects of all gradient pulses into account, it provides accurate b-matrix and is of great significance when the imaging gradients have a non-negligible diffusion-related signal attenuation.
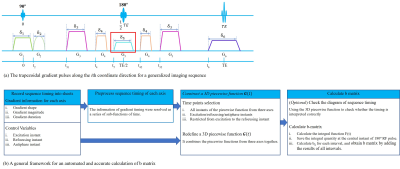
    Figure 1. (a) A generalized imaging sequence along one coordinate direction, and (b) a general framework for an automated and accurate calculation of b matrix.
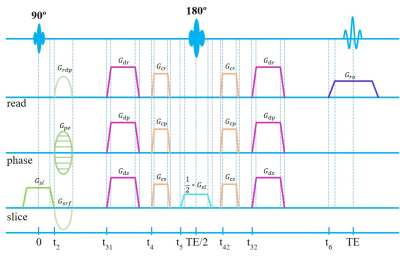
    Figure 2. 2D SE imaging sequence
  • Automatic Phase Image Texture Analysis for Motion Detection in Diffusion MRI (APITA-MDD) with Adaptive Thresholding
    Xiao Liang1, Pan Su2, Steve Roys1, Rao P Gullapalli1, Jerry L Prince3, and Jiachen Zhuo1
    1Department of Diagnostic Radiology and Nuclear Medicine, University of Maryland School of Medicine, Baltimore, MD, United States, 2Siemens Medical Solutions USA Inc, Malvern, PA, United States, 3Department of Electrical and Computer Engineering, Johns Hopkins University, Baltimore, MD, United States
    We developed a more robust phase image-based motion detection method (APITA-MDD) that automatically generates ROI for motion detection and detects motion based on a robust metric . The APITA-MDD correctly identified motion at edge slices and motion caused by head rotation and leg crossing.
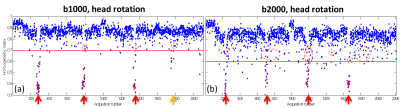
    Figure 3. Scattered plots of HHI values for all slices for an example b1000 (a) and b2000 (b) cases. Motion detected by PITA-MDD are all dots fall below the HHI threshold, defined as 0.7 for b1000 and 0.6 for b2000 dMRI (red lines). Motion detected by APITA-MDD are denoted in red. Notice slices missed by PITA-MDD but detected with adaptive thresholding in APITA-MDD (circle). Arrows indicate time when motion instruction was given.
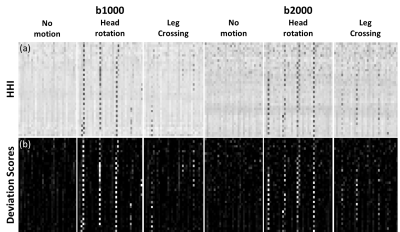
    Figure 4. Heat maps of HHI (a) and the deviation score M (b) for representative b1000 and b2000 acquisitions with no motion, head rotation, and leg crossing motions. In each map, the horizontal axis represents volume index, and vertical axis represent slices index. Range for HHI is [0,1]. Range for deviation score is from 0 to maximum value 25.
  • Diffusion-Weighted Imaging with Integrated Slice-Specific Dynamic-Shimming  for Rectal Cancer Detection and Characterization
    Jianxing Qiu1, Jing Liu1, Chenwen Liu2, Jinxia Zhu2, and Thomas Benkert3
    1Peking University First Hospital, Beijing, China, 2MR Collaboration, Siemens Healthcare Ltd China, Beijing, China, 3MR Application Development, Siemens Healthcare GmbH, Erlangen, Germany
    DWI with iShim improves image quality of rectal cancer and help pathological differentiation.

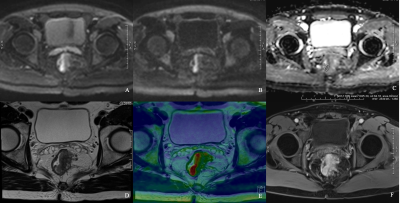
    Figure 4 iShim DWI for patient with primary rectal cancer of Grade 1

    DW images of b800 (A), b1600 (B), ADC map (C), T2WI (D), infusion images of both T2WI and DWI (E) and dynamic T1WI (F) showed the same location of lesion. Average ADC value measured was 1025.39 mm2/s (C).

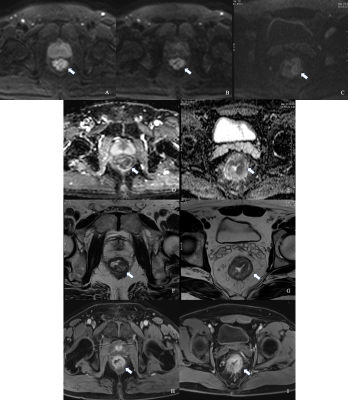
    Figure 2 Comparison between iShim- and SS-EPI-DWI in patients after CRT.

    Images on the left side were on the same location in patients with iShim-DWI. Images on the right side were on the same location in patients with SS-EPI-DWI. iShim-DWI of b800 (A) and b1600 (B) showed higher SNR and CNR with lower signal noise compared with SS-EPI-DWI of b1000 (C). ADC map (E) of iShim-DWI showed better image quality compared with ADC map (F) of SS-EPI-DWI. T2W images (F and G) and dynamic T1W images (H and I) showed the same location of lesion (arrows) for iShim- and SS-EPI- cohort, respectively.