-
Multimodal MR imaging reveals distinct sensitivity of hippocampal subfields to normal aging and asymptomatic Alzheimer's disease pathology
Junjie Wu1, Syed S. Shahid2,3, Qixiang Lin2, Antoine Hone-Blanchet2, Jeremy L. Smith1, Benjamin B. Risk4, Aditya S. Bisht2, David W. Loring2, Felicia C. Goldstein2, Allan I. Levey2, Bruce A. Crosson2,5, James J. Lah2, and Deqiang Qiu1,6
1Department of Radiology and Imaging Sciences, Emory University School of Medicine, Atlanta, GA, United States, 2Department of Neurology, Emory University School of Medicine, Atlanta, GA, United States, 3Department of Radiology and Imaging Sciences, Indiana University School of Medicine, Indianapolis, IN, United States, 4Department of Biostatistics and Bioinformatics, Emory University Rollins School of Public Health, Atlanta, GA, United States, 5Center for Visual and Neurocognitive Rehabilitation, Atlanta VA Medical Center, Decatur, GA, United States, 6Joint Department of Biomedical Engineering, Emory University and Georgia Institute of Technology, Atlanta, GA, United States
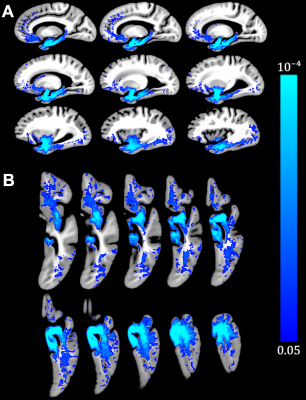
Normal aging affects functional connectivity and microstructure in all hippocampal subfields while the subiculum and CA1-3 exhibit the greatest sensitivity to pathological aging. The imaging measures correlate with neuropsychological performance and tau.
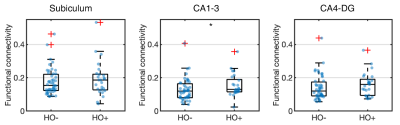
Fig 4. Group differences of functional connectivity in the subiculum, CA1-3 and CA4-DG networks between healthy older adults with negative CSF biomarker status (HO-) and positive CSF biomarker status (HO+). Significant at *P < 0.05.
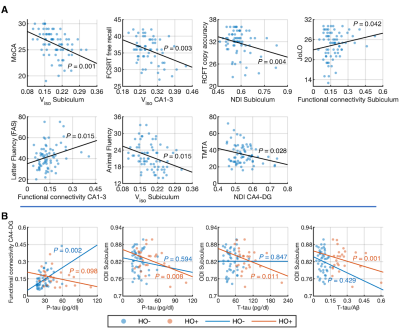
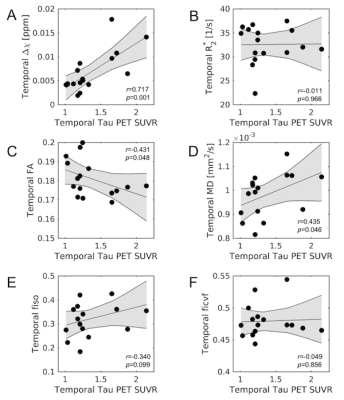
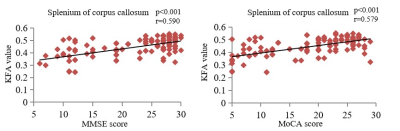
Fig 5. Correlations of imaging measures with neuropsychological performance (A) and CSF biomarker measurements (B). The fitting lines are also shown to indicate trends.
-
Analysis of brain structural connectivity networks and white matter integrity in patients with mild cognitive impairment
Maurizio Bergamino1, Ryan R Walsh2, and Ashley M Stokes1
1Neuroimaging Research, Barrow Neurological Institute, Phoenix, AZ, United States, 2Muhammad Ali Parkinson Center at Barrow Neurological Institute, Phoenix, AZ, United States
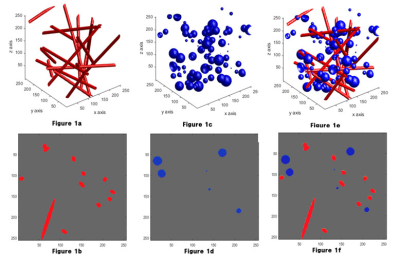
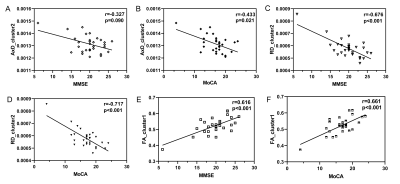
Using a novel and robust analysis of multi-shell diffusion data, we demonstrated significant alterations in structural connectivity and white matter integrity in MCI subjects. We anticipate these methods may be useful neuroimaging biomarkers in MCI.
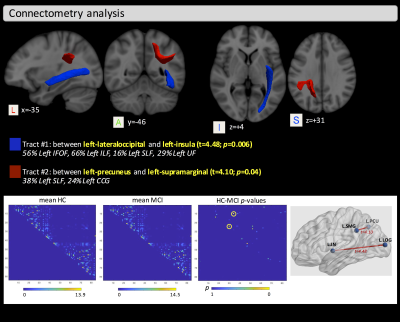
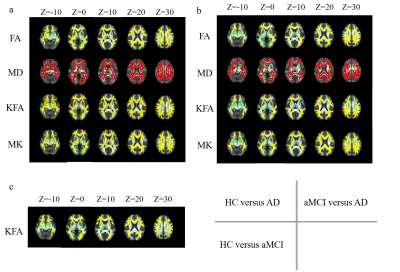
Connectometry analysis detected differences in structural connectivity between HC and MCI in two distinct tracts: one between the left-lateraloccipital and the left-insula, which includes part of the left IFOF and the left ILF, and one between the left-precuneus and the left-supramarginal, which includes part of the left superior-longitudinal fasciculus. The yellow circles in the HC-MCI p-values connectometry matrix show the significant edges with p<0.05.
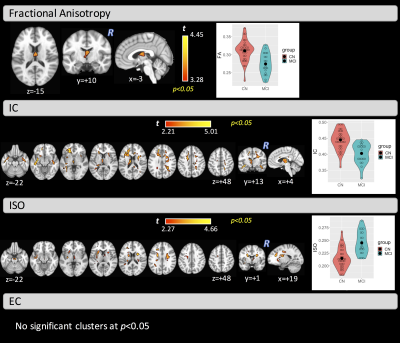
Voxel-based analysis of FA, IC, ISO, and EC maps. Lower values of FA in the MCI group, compared with HCs, were found in the fornix. Lower IC and higher ISO values were found in MCI in several white matter regions and tracts. No significant differences between groups, at p<0.05, were found for the EC metric.
-
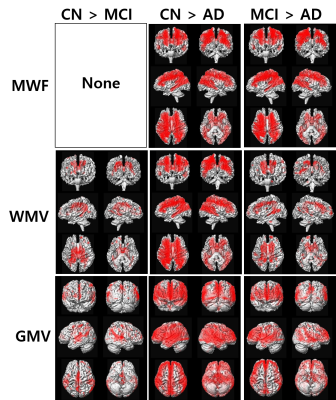
Correlation of gray matter thickness, gray matter volume, white matter lesion and clinical scoring in normal healthy elderly in Thailand
Tharathorn Kaeowirun1, Chanon Ngamsombat1, Doonyaporn Wongsawaeng 1, Siriwan Piyapittayanan1, Yudthaphon Vichianin2, Weerasak Muangpaisan3, Panida Charnchaowanish1, and Orasa Chawalparit1
1Department of Radiology, Faculty of Medicine, Siriraj Hospital, Mahidol University, Bangkok, Thailand, 2Department of Radiological Technology, Faculty of Medical Technology, Mahidol University, Bangkok, Thailand, 3Department of Preventive and Social Medicine, Faculty of Medicine, Siriraj Hospital, Mahidol University, Bangkok, Thailand
Significant
differences of MoCA score, white matter lesion volume, cortical gray thickness
and normalized gray matter volume in each elderly age group were found. The MoCA score change related with cortical gray thickness and normalized gray matter
volume.
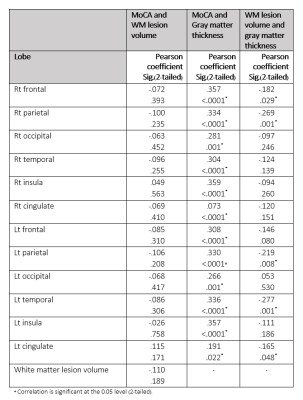
Table 3
Pearson correlation between MoCA with white matter lesion volume, MoCA with
gray matter thickness and white matter lesion volume with gray matter thickness
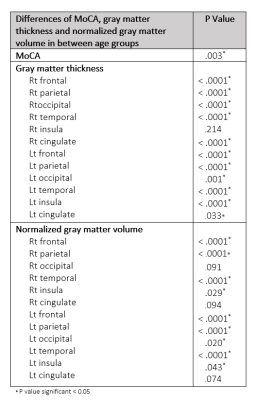
Table 2 Difference
of MoCA, gray matter thickness and normalized gray matter volume in each age
group by one-way ANOVA.
-
Volumetric analysis of brain MRI to distinguish healthy controls from AD and MCI patients according to ATN classification
Ilaria Ricchi1,2,3, Ricardo Corredor-Jerez1,2,3, Thierry Phénix4, Mélanie Leroy5, Reto Meuli2, Jonas Richiardi2, Bénédicte Maréchal1,2,3, and Jean-François Demonet4
1Advanced Clinical Imaging Technology, Siemens Healthcare AG, Lausanne, Switzerland, 2Dept. of Radiology, Lausanne University Hospital and University of Lausanne, Lausanne, Switzerland, 3LTS5, École Polytechnique Fédérale de Lausanne (EPFL), Lausanne, Switzerland, 4Leenaards Memory Centre CHUV Lausanne University, Lausanne, Switzerland, 5Lille Neuroscience & Cognition, Lille University, Inserm University Hospital CHU, Lille, France
Automated volumetry classifies AD and MCI patients from clinically normal (CN) subjects similarly to ATN classification, approximating in particular p-Tau biomarker, which represents alone a key feature for the classification.
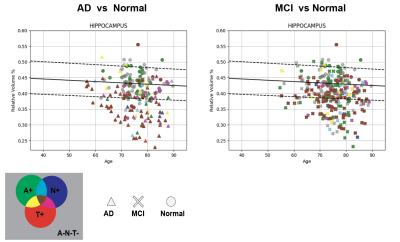
Figure 1. Relative volume distribution of hippocampal volume with respect to age. The lines indicate the 10th, 90th (dashed) and 50th (solid) percentiles for healthy controls [2]. The shapes of the scatter plot represent the clinical diagnosis (AD,MCI, normal) and the color represent the ATN classification.
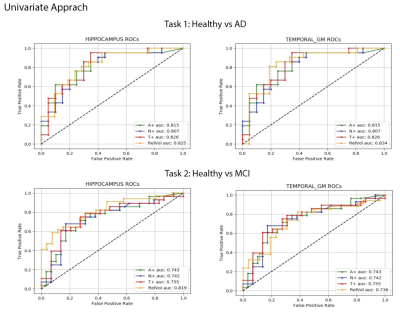
Figure 2. ROC curves of the univariate approach using hippocampus and temporal GM relative volumes (in orange) with respect to Aβ42 (green), pTau (red), and Tau (blue). The logistic regression best hyperparameters were: L2 regularization with a coefficient C=0.001, without weighting the classes.
-
Increased Body Mass Index Associated with Reduced Connectivity in Functional Brain Networks in those At-Risk of Dementia
Marilena M DeMayo1,2, Jinglei Lv1,2, Shantel Duffy3,4,5, Sharon Naismith3,4,5,6, and Fernando Calamante1,2,7
1School of Biomedical Engineering, The University of Sydney, Camperdown, Australia, 2Brain and Mind Centre, The University of Sydney, Camperdown, Australia, 3Cogsleep, Australian National Health and Medical Research Council Centre of Research Excellence, Camperdown, Australia, 4Charles Perkins Centre, The University of Sydney, Camperdown, Australia, 5Healthy Brain Ageing Program, Brain and Mind Centre, The University of Sydney, Camperdown, Australia, 6School of Psychology, Faculty of Science, The University of Sydney, Camperdown, Australia, 7Sydney Imaging, The University of Sydney, Camperdown, Australia
In an aging cohort considered at-risk for developing dementia, increased body mass index (BMI) was associated with reduced activity in 3 functional brain sub-networks identified using Network-Based Statistics on whole brain connectivity.
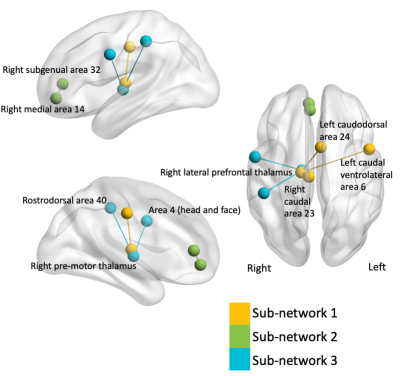
Figure 2. The three specific sub-networks identified by NBS. These sub-networks showed reduced connectivity with increased BMI. Figures were created using BrainNet Viewer9
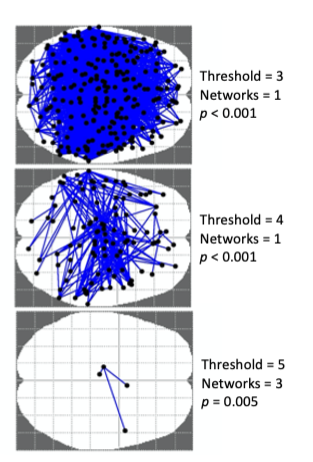
Figure 1. Illustration of networks identified by different thresholds in NBS. Ultimately a threshold of 5 was chosen to be sufficiently specific.
-
Automatic tract segmentation in the older brain
Susana Muñoz Maniega1, Jonathan D Clayden2, Maria Valdés Hernandez1, Mark E Bastin1, Ian J Deary3, and Joanna M Wardlaw1
1Centre for Clinical Brain Sciences, University of Edinburgh, Edinburgh, United Kingdom, 2UCL GOS Institute of Child Health, University College London, London, United Kingdom, 3Department of Psychology, University of Edinburgh, Edinburgh, United Kingdom
Automated methods produced reasonable tract segmentations in healthy older brains. However, both visual assessments and the estimated overlaps between segmented bundles suggest there is a key trade-off between tract coverage and the specificity of associated diffusion parameters.
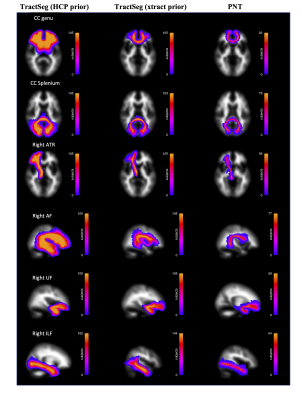
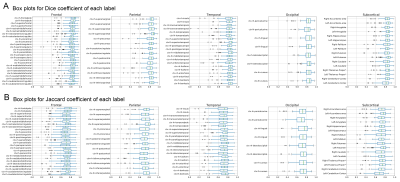
Figure 1. Group maps of white matter tracts segmented with three methods. Colour scales show the voxel-wise frequency for each tract (total N=105).
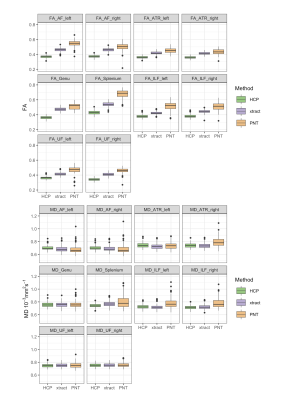
Figure 2. Boxplots of FA and MD obtained in each segmented tract using each method.
-
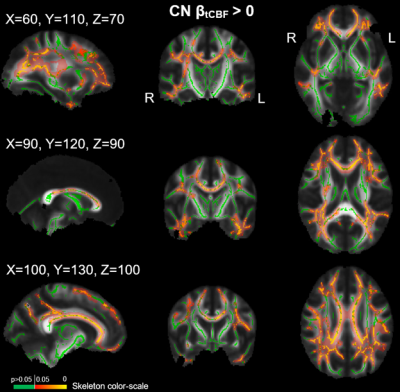
Application of SVS-PRESS, MEGA-PRESS, and pCASL to Evaluate Treatment Effect of Kami Guibi-tang in Patients with Mild Cognitive Impairment
Geon-Ho Jahng1, Seung-Yeon Cho2, Jung-Mi Park2, Soonchan Park1, Chang-Woo Ryu1, and Richard Edden3
1Radiology, Kyung Hee University Hospital at Gangdong, Seoul, Korea, Republic of, 2Stroke and Neurological Disorders Center, Kyung Hee University Hospital at Gangdong, Seoul, Korea, Republic of, 3Radiology, The Johns Hopkins University School of Medicine, Baltimore, MD, United States
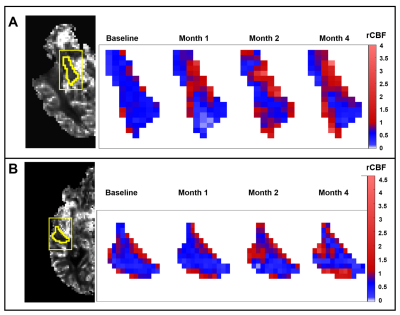
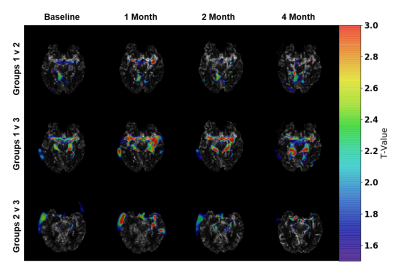
The CBF measure was the
sensitive marker to evaluate the treatment effect of KGT on MCI participants. We found that the treatment
affected the temporal lobe, including the hippocampus and the fusiform gyrus
which are associated with memory.
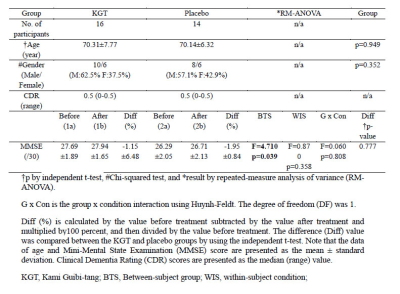
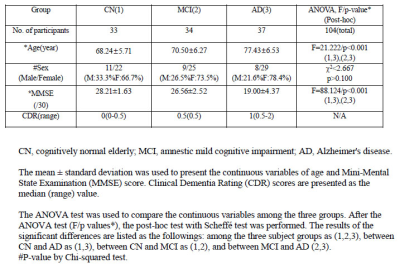
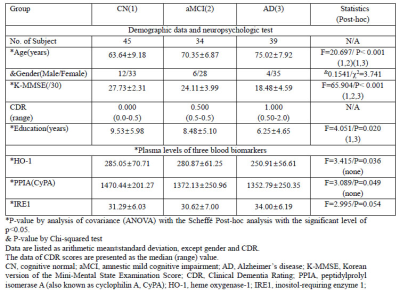
Table 1. Summary of the statistical results of the
demographic data and results of the neuropsychological tests obtained in the
participants
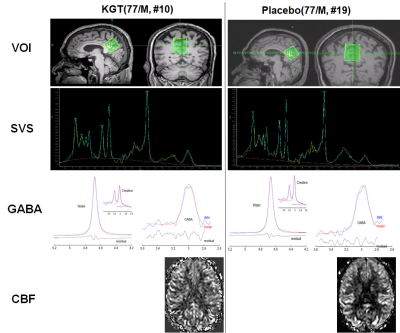
Figure 1. Representative magnetic resonance images
and metabolite spectra.
-
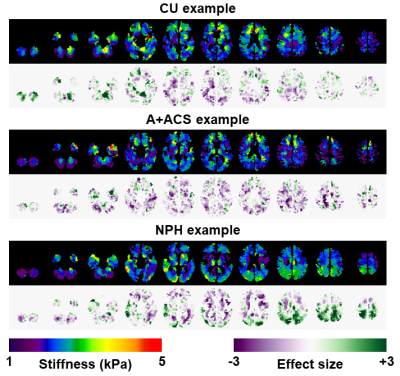
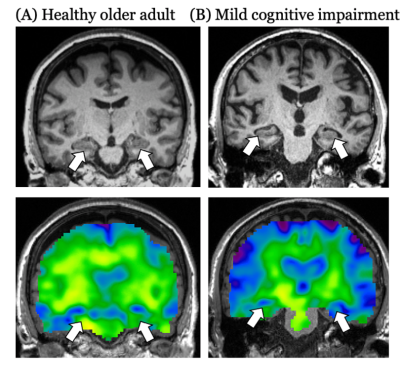
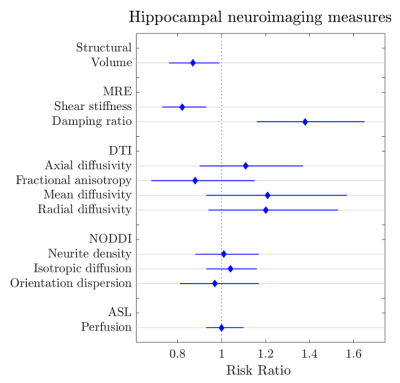
Impact of Dementia with Lewy Bodies on Brain Biomechanical Properties
KowsalyaDevi Pavuluri1, John Huston III1, Richard L. Ehman1, Armando Manduca1,2, Clifford R. Jack Jr1, Rodolfo Savica3, Bradley F Boeve4, Kejal Kantarci1, David S Knopman3, Ronald C. Petersen3, and Matthew C. Murphy1
1Department of Radiology, Mayo Clinic, Rochester, MN, United States, 2Department of Physiology and Biomedical Engineering, Mayo Clinic College of Medicine, Rochester, MN, United States, 3Department of Neurology, Mayo Clinic, Rochester, MN, United States, 4Division of Pulmonary and Critical Care Medicine, Mayo Center for Sleep Medicine, Mayo Clinic, Rochester, MN, United States
To investigate the impact of Dementia with Lewy bodies (DLB) on brain
viscoelasticity and assess the feasibility of mechanical properties as
potential biomarkers of DLB.
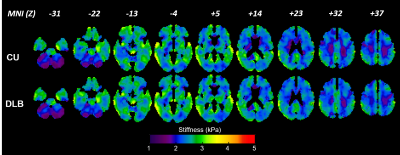
Figure 2. Neural network inversion calculated mean stiffness maps for two groups
controlling for age and sex. Each column indicates an image from different
slice locations, MNI coordinates are arranged from inferior to superior
positions.
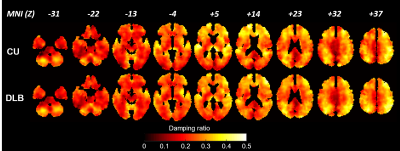
Figure 3. Neural network inversion calculated mean damping ratio maps for two
groups after correction for age and sex. Each column indicates an image from
different slice locations MNI coordinates are arranged from inferior to
superior positions.
-
Investigation of brain regional relaxation characteristics in healthy subjects during normal aging using synthetic MRI
Di Wang1, Lu Yu2, Pu-Yeh Wu3, Chunmei Li2, and Min Chen2
1Beijing Hospital, National Center of Gerontology; Institute of Geriatric Medicine, Chinese Academy of Medical Sciences, P.R. China, Bejing, China, 2Beijing Hospital, National Center of Gerontology; Institute of Geriatric Medicine, Chinese Academy of Medical Sciences, P.R. China, Beijing, China, 3GE Healthcare, Beijing, China, Beijing, China
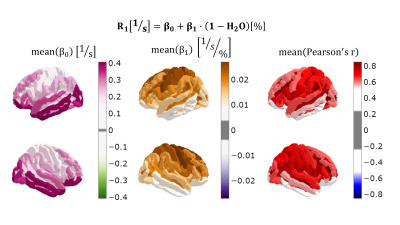
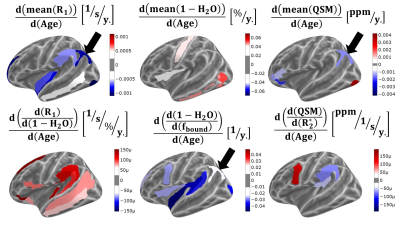
We adopted Synthetic MRI to investigate the age-related relaxation characteristics changes in healthy subjects by brain region-based analysis. We found significant differences of relaxation characteristics between bilateral hemispheres,T1, T2 and PD showed a quadratic trend with age.
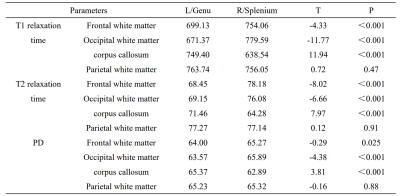
Table 1. Comparison of left and right hemispheres(genu and splenium of corpus callosum) among the relaxation times
-
Altered resting-state network connectivity in patients with presbycusis
fei gao1, fuxin ren1, weibo chen2, and muwei li3
1Shandong Medical Imaging Research Institute, Shandong University, jinan, China, 2Philips Healthcare, shanghai, China, 3Vanderbilt University Institute of Imaging Science, Nashville, TN, United States
The internetwork connectivity between auditory network and cognition-related network decreased, while the internetwork connectivity of cognition-related network increased in PC patients. Moreover, these functional abnormalities were correlated with cognitive impairment in PC.
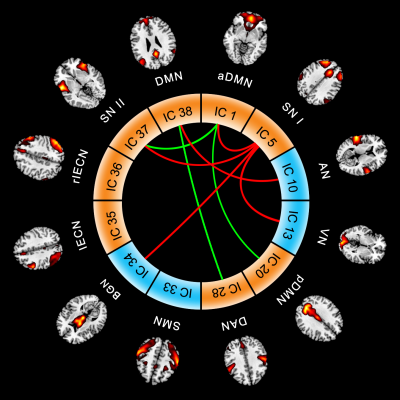
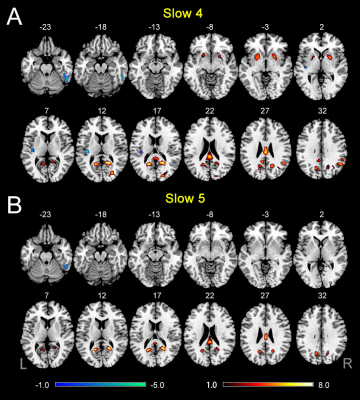
Fig. 3 PC
patients exhibited decreased internetwork connectivity between the DMN and auditory
network (AN) and between DMN and anterior salience network (SN) and between SNI
and SNII and between SN and visual network (VN), as well as increased internetwork
connectivity between the DMN and dorsal attention network (DAN) and between anterior
DMN and posterior DMN.
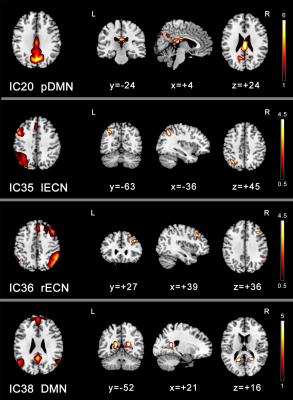
Fig. 2 Compared
with controls, PC patients showed significantly decreased network connectivity
within the default mode network (DMN), Left executive control network (lECN)
and right executive control network (rECN).
-
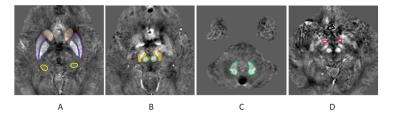
Thalamic nuclei changes in prodromal and clinical Alzheimer’s disease
Adam S Bernstein1, Steve Z Rapcsak2, Michael Hornberger3, and Manojkumar Saranathan4
1College of Medicine, University of Arizona, Tucson, AZ, United States, 2Department of Neurology, University of Arizona, Tucson, AZ, United States, 3Department of Medicine, University of East Anglia, Norwich, United Kingdom, 4Department of Medical Imaging, University of Arizona, Tucson, AZ, United States
TBD
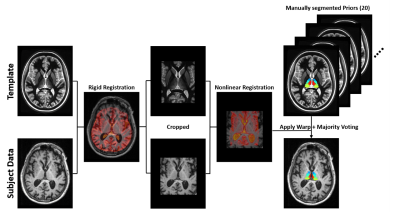
Figure 1. Multi-atlas segmentation scheme for thalamic nuclei segmentation. The multi-atlas consists of 20 manually segmented WMn MPRAGE data which are warped to subject space and label fused using a majority voting scheme. A WMn template is used as an intermediate step to improve robustness and cropping is performed to improve speed and accuracy.
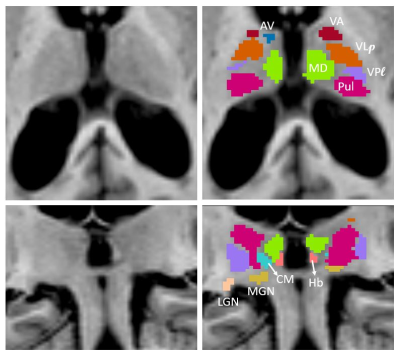
Figure 2. Thalamic nuclei segmentation labels from the modified THOMAS method
overlaid on MPRAGE data in axial (top panel) and coronal (bottom panel) for a patient with AD (enlarged ventricles). Note visualization of small structures such as anteroventral (AV), centromedian (CM) and habenula (Hb).
-
The changes of hippocampus in Type 2 Diabetes Mellitus Patients with Mild Cognitive Impairment: A Multiple Advanced Diffusion Models study
Mengzhu Wang1, Yunzhu Wu1, and Wenjiao Lyu2
1MR Scientific Marketing, Siemens Healthcare, Guangzhou, China, 2Department of Radiology, the First Affiliated Hospital of Guangzhou University, Guangzhou, China
MAP-MRI and NODDI showed higher potential in grading of detect changes of hippocampus than DTI and DKI models, and the radiomics model by combining the parameters of MAP-MRI and NODDI could be used to accurately diagnosis the changes of hippocampus in type 2 diabetes mellitus patients with mild cognitive impairment.
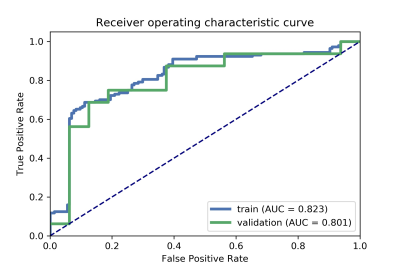
Figure 2. The area under the ROC curve of train and validation set based on radiomics model
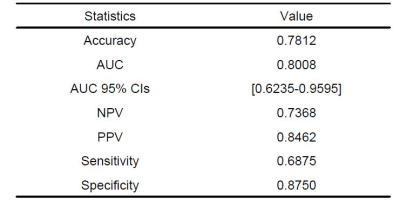
Table 1. Clinical statistics in the diagnosis.
-
Cardiovascular fitness does not influence relationships between cortical thickness and obesity in aging
Brittany Intzandt1,2,3, Safa Sanami4, Julia Huck4, Richard D Hoge5, Louis Bherer2,3,6,7, and Claudine J Gauthier3,4,6
1INDI Department, Concordia University, Montreal, QC, Canada, 2Centre de Recherche de l'Institut Universitaire de Geriatrie, Montreal, QC, Canada, 3Centre de Recherche, l'Institut de Cardiologie de Montréal, Montreal, QC, Canada, 4Physics Department, Concordia University, Montreal, QC, Canada, 5Department of Neurology and Neurosurgery, McGill University, Montreal, QC, Canada, 6PERFORM Centre, Concordia Univeristy, Montreal, QC, Canada, 7Départment de Médicine, Université de Montréal, Montreal, QC, Canada
Cardiovascular
fitness did not moderate the relationship between increased adiposity and cortical
thickness in overweight males and females, nor in those with normal weight.
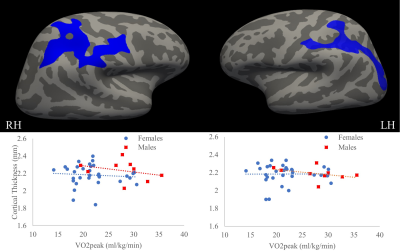
Figure 2: Regions in the right and left hemispheres
(RH; LH) demonstrating significant differences in OBW versus OBM, where OBW demonstrated
greater cortical thickness in these regions indicated in blue (p = 0.00010,
corrected for age, education, study). The graphs demonstrate no influence of
VO2peak on cortical fitness and the relationships for OBW and OBM separately in
the RH (graph on the left; p > 0.05) and LH (graph on the right; p >
0.05).
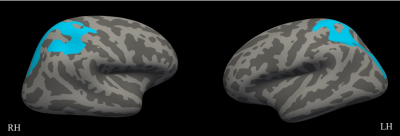
Figure 1: Regions in the right and left hemispheres
(RH; LH) demonstrating significant differences in females versus males, where
females demonstrated greater cortical thickness in these regions in teal
(regardless of BMI status). (p =0.00010; corrected for age, education, study)
-
Does basal forebrain volume reduction in MRI indicate cholinergic degeneration? A validation study in mouse model of Alzheimer’s Disease
Xiaoqing Alice Zhou1, Grace Ngiam1, Lei Qian2, Tammy Sankorrakul3, Elizabeth J Coulson2, and Kai-Hsiang Chuang4
1QBI/SBMS, The University of Queensland, Brisbane, Australia, 2SBMS/QBI, The University of Queensland, Brisbane, Australia, 3SBMS, The University of Queensland, Brisbane, Australia, 4QBI/CAI, The University of Queensland, Brisbane, Australia
TBM analysis revealed a significant volume decrease in medial septum (MS) and substantia innominate (SI). However, the MRI-detected volume changes in the basal forebrain is not associated with cholinergic neurons in 3xTg-AD animals.
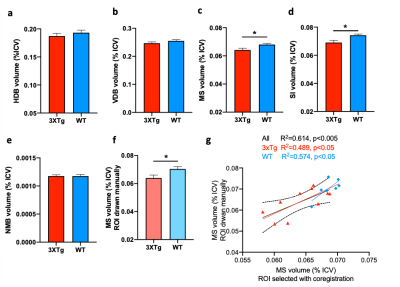
Figure 2. 3xTg mice have smaller basal forebrain volume. (a-e) Automated image registration-based quantification of the basal forebrain volume of control and 3xTg mice. (f) Manually drawn ROI showed decreased MS volume in 3xTG mice. (g) The automated image registration-based quantification and manual ROI quantification show significant correlation. MS, medial septum; SI, substantia innominate; HDB, the horizontal limb of the diagonal band of Broca; VDB, vertical diagonal band nucleus; BNM, basal nucleus of Meynert. Data are shown in mean ± SEM, *P<0.05.
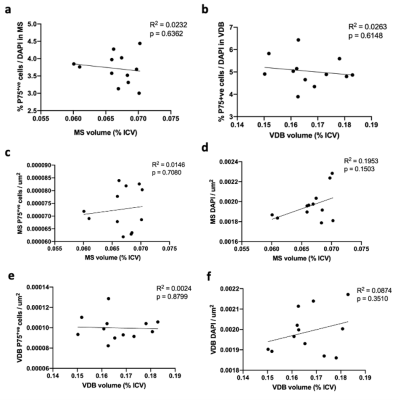
Figure 5. Correlation between MRI-detected volume and cholinergic cell proportion and density. (a-f) Simple linear regression of MRI volume of MS and VDB, as represented by the proportion of intracranial volume (% ICV), plotted against p75 positive cell proportion (n=12, p>0.05).
-
DGE-MRI detects the therapeutic effect of IL-33 in Alzheimer’s mice by assessing cerebral glucose uptake and clearance at 3T
Zilin Chen1, Jianpan Huang1, Yang Liu1, Joseph H.C. Lai1, and Kannie W.Y. Chan1,2,3
1Biomedical Engineering, City University of Hong Kong, Hong Kong, Hong Kong, 2Russell H. Morgan Department of Radiology and Radiological Science, The Johns Hopkins University School of Medicine, Baltimore, MD, United States, 3City University of Hong Kong Shenzhen Research Institute, Shenzhen, China
Enhanced D-glucose clearance in CSF was observed in AD mice after IL-33 treatment through DGE-MRI at 3T, which could provide a non-invasive way to evaluate AD treatment that facilitate brain lymphatic clearance.
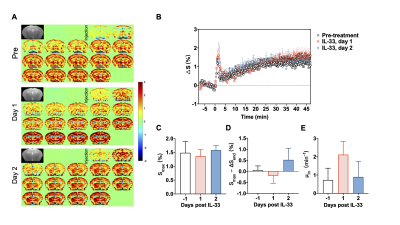
DGE-MRI results for brain parenchyma in APP/PS1 mice before and after IL-33 treatment. (A) Dynamic difference images in brain parenchyma. (B) Experimental DGE plots for brain parenchyma. (C-E) Comparison of the maximum signal Smax, clearance parameters Smax-△Send and glucose uptake rate μin before and after treatment. Data were presented as mean ± SEM (n=4).
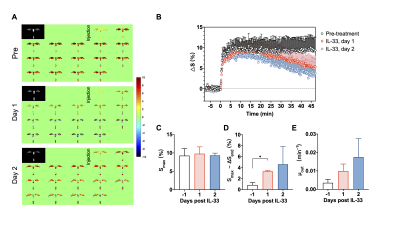
DGE-MRI results for CSF in APP/PS1 mice before and after IL-33 treatment. (A) Dynamic difference images in CSF. (B) Experimental DGE plots for CSF in APP/PS1 mice. (C-E) Comparison of the maximum signal Smax, clearance parameters Smax-△Send and washout rate μout before and after treatment. Data were presented as mean ± SEM (n=4). *P<0.05, one-way ANOVA.
-
1-Norm for quantifying the degree of brain tissue mechanical inhomogeneity due to neurodegenerative disease
Harish Palnitkar1, Shreyan Majumdar2, Rolf Reiter3, Shujun Lin2, Joseph Crutison2, Thomas Royston2, and Dieter Klatt2
1Department of Mechanical and Industrial Engineering, University of Illinois at Chicago, Chicago, IL, United States, 2Richard and Loan Hill Department of Bioengineering, University of Illinois at Chicago, Chicago, IL, United States, 3Charite Universitatsmedizin, Berlin, Germany
In prior investigations, we have established 1-Norm as quantitative measure of degree of inhomogeneity of biological tissues. Here, we apply 1-Norm to study effect of Alzheimer’s disease on mechanical inhomogeneity of brain. We aim to establish 1-Norm as biomarker to detect AD in humans.
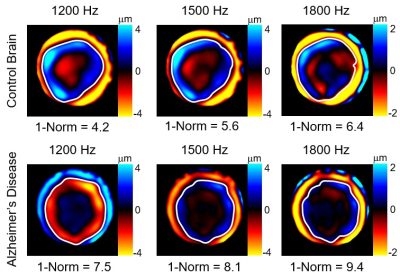
Figure 2. Complex wave images (real part) for control
brain (top row) and brain of 5xFAD AD mouse model (bottom row), along with the
delineated contour of zero displacement shown in white color.
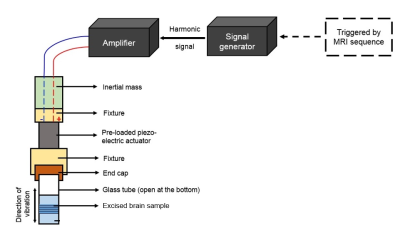
Figure 1. Representative block
diagram of the Magnetic Resonance Elastography (MRE) experimentation set-up.
-
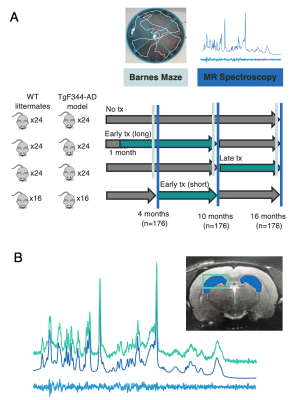
Longitudinal Characterization of Volumetric Changes During Healthy Aging and Between Sexes in the Fischer 344 Rat Brain
Dana Goerzen1,2, Caitlin Fowler1,2, Dan Madularu3, Gabriel A Devenyi2, M. Mallar Chakravarty1,2, and Jamie Near1,2
1McGill University, Montreal, QC, Canada, 2Centre d'Imagerie Cérébrale, Douglas Mental Health University Institute, Montreal, QC, Canada, 3Center for Translational Neuroimaging, Northeastern University, Boston, MA, United States
For the first time, longitudinal changes in 71 unique brain regions were characterized in aging male and female Fischer rats, contributing to our understanding of baseline neuroanatomical changes associated with healthy aging in both sexes.
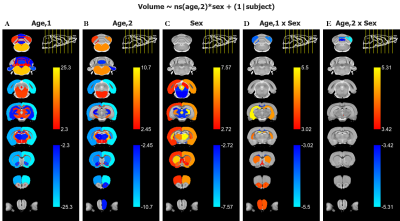
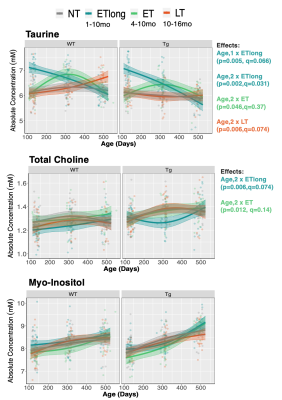
Figure 2. Regional linear model of relative volume=ns(age,2)*sex+(1|subject) with columns A-E corresponding to different model terms. Each regional t-value for each model term is mapped to the corresponding atlas label and overlaid onto the anatomical average image as a regional t-value heatmap. Only regions with statistics that surpass a 5% FDR correction are plotted and the upper bound of the scale corresponds to the maximal t-value modeled by that term. t-value scale is shown for each term.
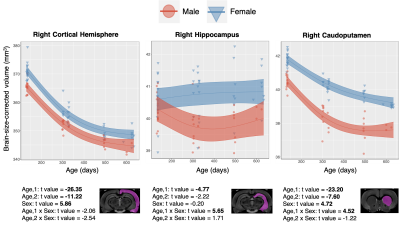
Figure 3. Data from selected grey matter regions is shown with individual data points shown and the overall model as with confidence interval as described in Methods overlaid. T-values for each region and model term are shown on bottom, with significant terms after 5% FDR correction given in bold.
-
Testing the cognitive reserve hypothesis in the non-Western populations: evidence from a multicentric neuroimaging study in India
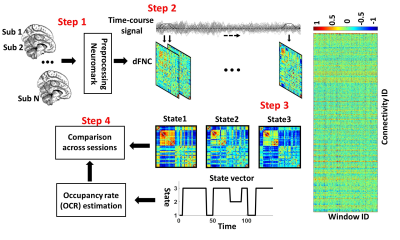
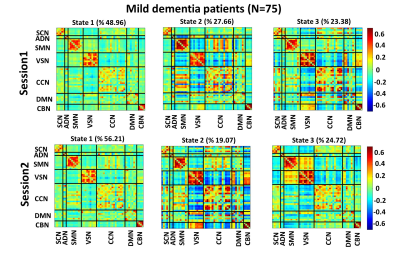
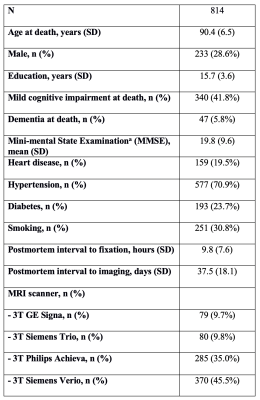
Brenton James Keller1, Jorge Jovicich2, Himanshu Joshi3, Leon Aksman4, John John3, A. B. Dey5, Arthur Toga4, Eileen Crimmins6, and Jinkook Lee1
1CSCR, University of Southern California, Los Angeles, CA, United States, 2Center for Mind/Brain Sciences (CIMEC),, University of Trento, Trento, Italy, 3Multimodal Brain Image Analysis Laboratory, National Institute of Mental Health and Neurosciences, Bangalore, India, 4Laboratory of Neuro Imaging, University of Southern California, Los Angeles, CA, United States, 5All India Institute of Medical Sciences, New Delhi, India, 6Davis School of Gerontology, University of Southern California, Los Angeles, CA, United States
Using multicentric brain structural 3T MRI morphometry, we
show evidence in support of the cognitive reserve hypothesis in an Indian
population including healthy elderly (55) and mild cognitively impaired (75)
volunteers.
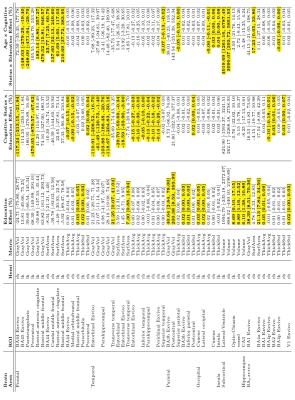
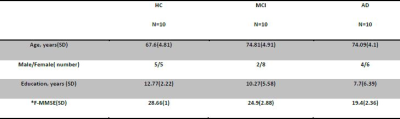
List of brain regions and morphometry metrics that were
found to be significantly associated (highlighted) with either education,
education x disease status, or age x education x disease status.
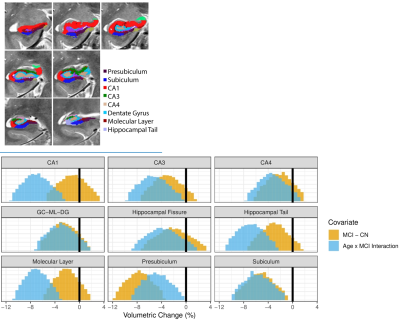
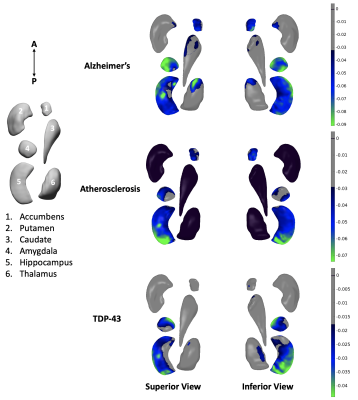
Top: Sample
hippocampal subfield segmentation results. Bottom: Distribution of Bayesian
regression of hippocampal subfield volumes examining MCI effects and age x MCI
interaction effects. Distribution tails crossing zero are non-significant. Presubiculum and subiculum volumes were
significantly decreased in MCI. CA1, CA3, hippocampal tail, molecular layer,
presubiculum, and subiculum volumes were negatively associated with age x MCI
interaction.
-
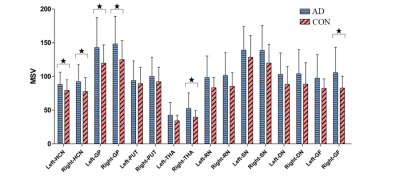
Early Stage Diagnosis of Alzheimer’s Disease Employing DTI-Derived Biomarkers
Forough Sodaei1,2, Jafar Zamani1,3, Maryam noroozian4, and Hamidreza Saligheh Rad1,5
1Quantitative MR Imaging and Spectroscopy Group, Research Center for Cellular and Molecular Imaging, Tehran University of Medical Sciences, Tehran, Iran (Islamic Republic of), 2Department of Medical Physics and Biomedical Engineering, School of Medicine, Tehran University of Medical Sciences, Tehran, Iran (Islamic Republic of), 3Department of Electrical Engineering, Iran University of Science and Technology, Tehran, Iran (Islamic Republic of), 4Memory and Behavioral Neurology Department, Roozbeh Hospital, Tehran University of Medical Sciences, Tehran, Iran (Islamic Republic of), 5Department of Medical Physics and Biomedical Engineering, School of Medicine, Tehran, Iran (Islamic Republic of)
Morphologic alterations of AD have been conventionally associated with the cerebral cortex; however, it is clear that other areas of the brain, especially the hippocampus are also involved. These structures, together with white matter structures including fornix constitute the limbic system, which is anatomic substrate of the memory system. Neurodegeneration in these areas lead to clinical manifestation of AD. In this study, we evaluated integrity of the limbic-associated areas in three groups using DTI. Findings yielded that the DTI-derived indices of the limbic-associated areas offer potential biomarkers for early and differential diagnosis of AD.
Clinical and demographic data of participants
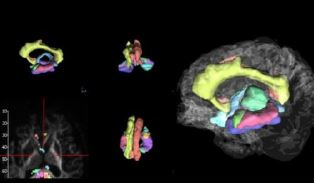
Fig. 1 The parcellation map with ROIs of the limbic-associated areas overlaid on DTI-derived maps.
-
Maturation and degeneration of the human cerebrum across the adult lifespan
Matthew Kiely1, Nikkita Khattar1, Curtis Triebswetter1, Zhaoyuan Gong1, Maryam H. Alsameen1, Richard G. Spencer1, and Mustapha Bouhrara1
1Laboratory of Clinical Investigation, National Institute on Aging, Baltimore, MD, United States
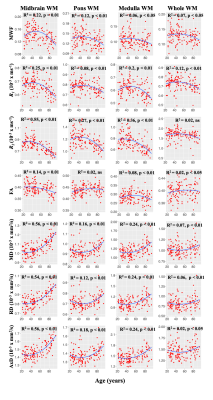
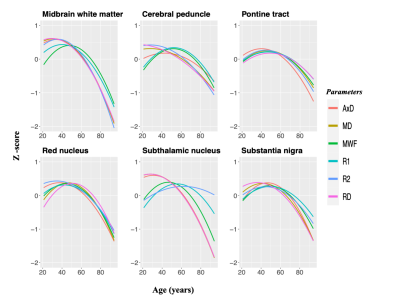
· MWF
and DTI indices follow quadratic associations with age
· Sex
effect on MWF and DTI indices was not significant
· Weak-to-moderate
regional correlations between DTI indices and MWF
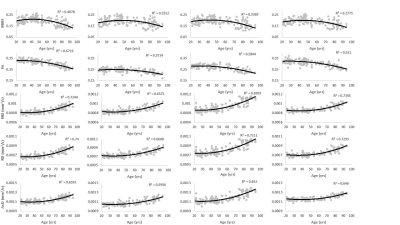
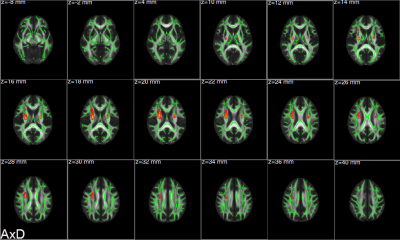
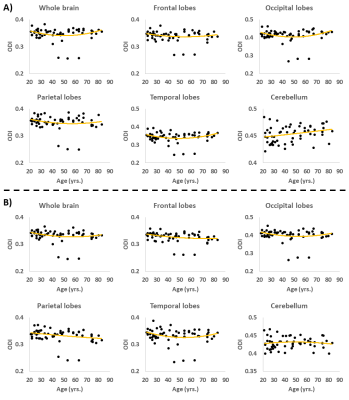
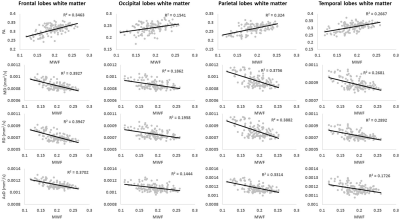
Figure
1. Plots illustrating regional MWF, FA, MD, RD, or AxD values as a function of
age for four representative cerebral white matter structures/ROIs. For each
ROI, the coefficient of determination, R2, is reported.
Figure
3. Plots illustrating examples of regional correlations of FA, MD, RD, or AxD
and MWF. Results are shown for four representative cerebral white matter
structures/ROIs. For each ROI, the coefficient of determination, R2,
is reported.