-
Gray Matter Based Spatial Statistics Shows Cortical Alterations in Individuals With Autism Spectrum Disorder
Marissa DiPiero1,2, Janet Lainhart2,3, Brittany Travers2,4, Andrew Alexander 2,3,5, and Doug Dean2,6
1Neuroscience Training Program, University of Wisconsin - Madison, Madison, WI, United States, 2Waisman Center, University of Wisconsin - Madison, Madison, WI, United States, 3Department of Psychiatry, University of Wisconsin - Madison, Madison, WI, United States, 4Department of Kinesiology, University of Wisconsin - Madison, Madison, WI, United States, 5Department of Medical Physics, University of Wisconsin - Madison, Madison, WI, United States, 6Department of Pediatrics, University of Wisconsin - Madison, Madison, WI, United States
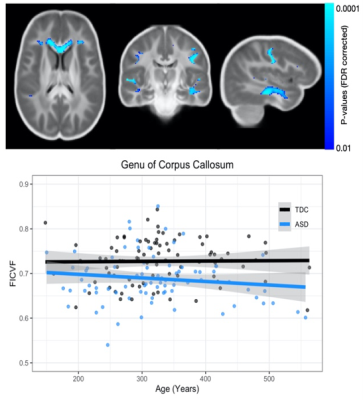
Main findings demonstrate the sensitivity of NODDI-GBSS to characterize age-related cortical gray matter differences in people with autism spectrum disorder. Such advancements will contribute to our understanding of brain dysfunction related to ASD.
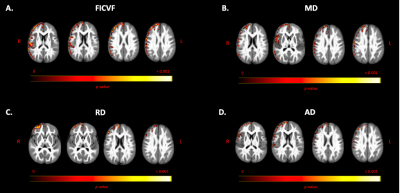
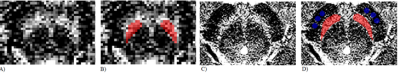
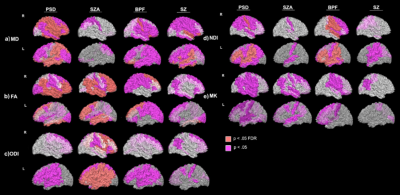
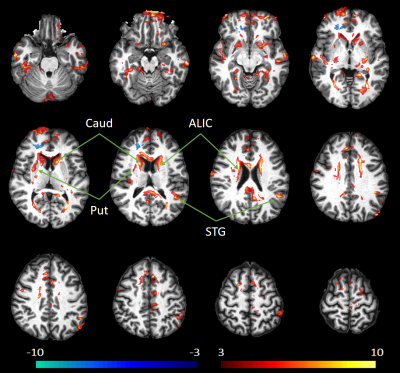
Figure 2: NODDI and DTI group differences. Color bar indicates level of significance of voxels from group difference model. A. Significant voxels and neuroanatomical location of FICVF group differences. B. Significant voxels and neuroanatomical location of MD group differences. C. Significant voxels and neuroanatomical location of RD group differences. D. Significant voxels and neuroanatomical location of AD group differences.
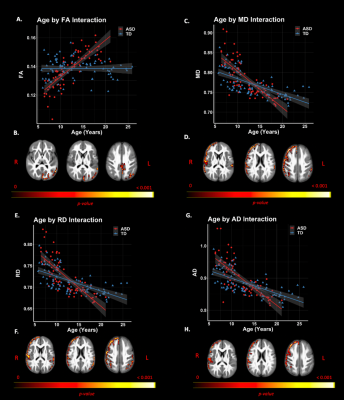
Figure 4: DTI age by group interactions. Significant voxels displayed on the neuroanatomical maps, color bar indicates level of significance (B, D, F, H). A. Scatter plot representing mean FA values of significant voxels of age-by-group interaction. C. Scatter plot representing MD values of significant voxels of age-by-group interaction. E. Scatter plot representing mean RD values of significant voxels of age-by-group interaction. G. Scatter plot representing mean AD values of significant voxels of age-by-group interaction.
-
Power spectral density of salience network alterations in obsessive-compulsive disorder: Impact on thought-action fusion performance
Eunji Kim1, Sang Won Lee2, Hyunsil Cha1, Heajung Choi1, Seungho Kim1, Yunheung Kim3, Seung Jae Lee2, and Yongmin Chang4
1Medical & Biological Engineering, Kyungpook National University, Daegu, Korea, Republic of, 2Psychiatry, Kyungpook National University Hospital, Daegu, Korea, Republic of, 3Kyungpook National University, Daegu, Korea, Republic of, 4Radiology and Molecular Medicine, Kyungpook National University, Daegu, Korea, Republic of
OCD
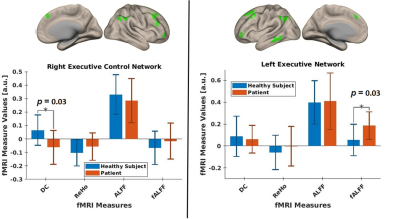
demonstrated the alterations of PSD which reflects neural activity in TAF task and resting-state.
These PSDs are correlated to psychological measures. Therefore,
alterations of PSD in SN during TAF task seem to be associated with OCD
symptoms.
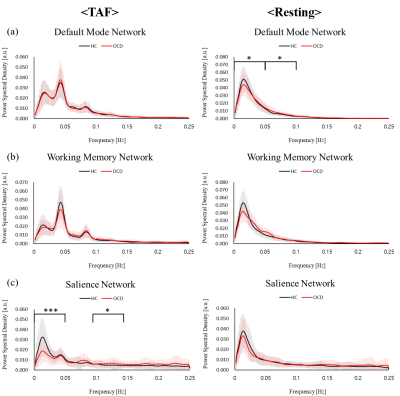
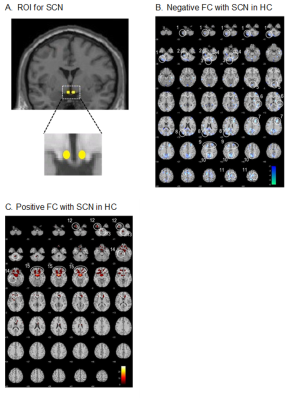
Power spectra under TAF task and resting state of OCD (red) and HC
(black). During resting state, intrinsic neural activity power within DMN had
significant difference at Bin1 and Bin2. Salience network showed significant
difference at Bin1 and Bin3 during TAF task. (Bin1: 0-0.05 Hz, Bin2: 0.05-0.1
Hz, Bin3: 0.1-0.15 Hz, Bin4: 0.15-0.2 Hz, Bin5: 0.2-0.25Hz)
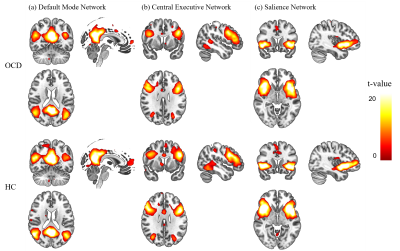
Independent components of each group under the TAF
task. Spatial maps were thresholded at p < 0.05 using one sample t-test,
corrected for family wise error (FWE). (a) Default Mode Network (DMN), (b)
Central Executive Network (CEN), and (c) Salience Network (SN).
-
Evaluation of White Matter Integrity via Fixel-Based Analysis in HIV Infection
Alan Finkelstein1, Md Nasir Uddin2, Miriam Weber2, Jianhui Zhong1,3,4, and Giovanni Schifitto2,3
1Biomedical Engineering, University of Rochester, Rochester, NY, United States, 2Neurology, University of Rochester, Rochester, NY, United States, 3Imaging Sciences, University of Rochester, Rochester, NY, United States, 4Physics and Astronomy, University of Rochester, Rochester, NY, United States
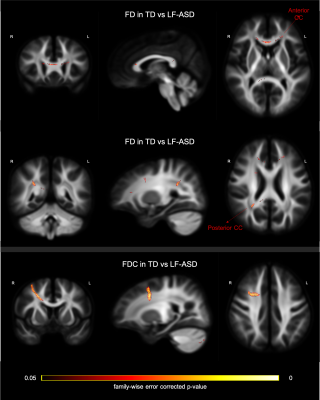
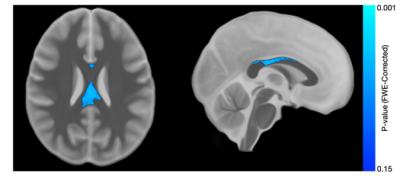
Chronic neuroinflammation in the setting of HIV infection leads to atrophy and demyelination, resulting in neurocognitive impairment. Fixel-based analysis was used to evaluate matter integrity in HIV+ individuals and their relationship with cognitive function.
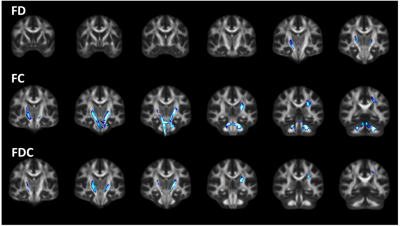
Figure 2. Significant differences in fixel-based metrics between HIV-infected and HIV-uninfected individuals. (top) Fiber Density (FD), (middle) Fiber bundle Cross-section (FC), and (bottom) Fiber density and cross-section (FDC). Significant fixels (family-wise error corrected p < 0.05) were mapped to streamlines and thresholded at p < 0.05.
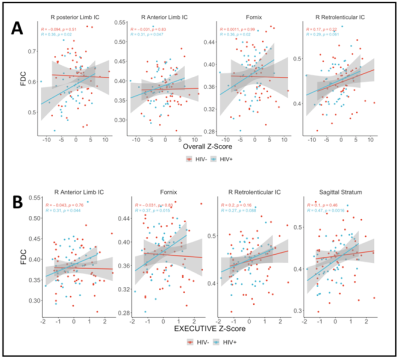
Figure 4. Scatterplots showing FDC as a function of Overall Z-score (A), and as a function of Executive z-score (B). Only regions with significant correlations are shown. Solid lines are linear fits and shaded areas are for 95% confidence interval. FDC: Fiber density and cross-section, IC: internal capsule.
-
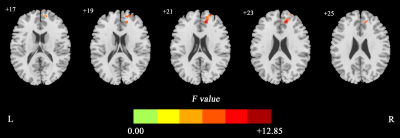
Assessment of brain structural connectome alterations in depressive patients with suicidal attempt using GQI
Chun-Ju Kao1, Vincent Chin-Hung Chen2,3, Yuan-Hsiung Tsai3,4, and Jun-Cheng Weng1,2,5
1Department of Medical Imaging and Radiological Sciences, and Bachelor Program in Artificial Intelligence, Chang Gung University, Taoyuan, Taiwan, 2Department of Psychiatry, Chang Gung Memorial Hospital, Chiayi, Taiwan, 3School of Medicine, Chang Gung University, Taoyuan, Taiwan, 4Department of Diagnostic Radiology, Chang Gung Memorial Hospital, Chiayi, Taiwan, 5Medical Imaging Research Center, Institute for Radiological Research, Chang Gung University and Chang Gung Memorial Hospital at Linkou, Taoyuan, Taiwan
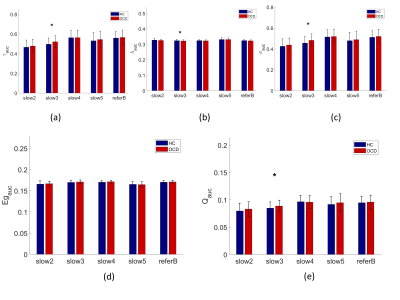
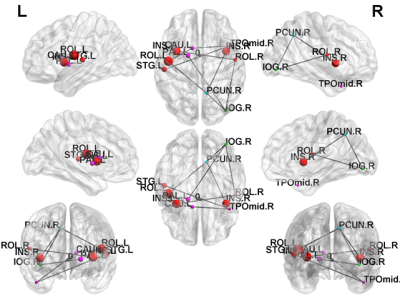
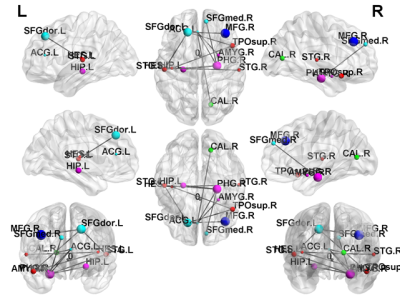
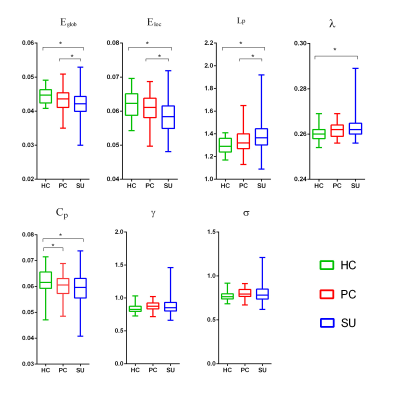
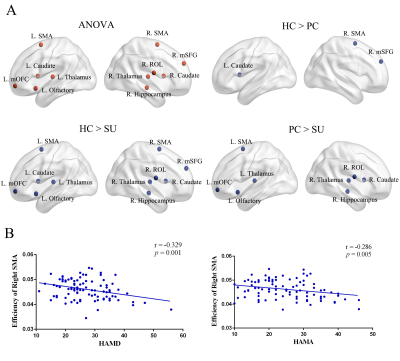
SA group showed lower global integration and higher local segregation compared to D and HC groups. Furthermore, SA and D groups had significant subnetwork connections in frontal and parietal lobes than HC group.
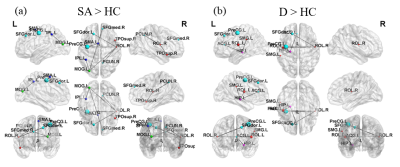
Figure 3. NBS results. (a) Compared with the HC group, the SA group demonstrated significantly stronger subnetwork connections in the frontal and parietal lobe. (b) Compared with the HC group, the D group demonstrated significantly stronger subnetwork connections in the parietal lobe (p < 0.05).
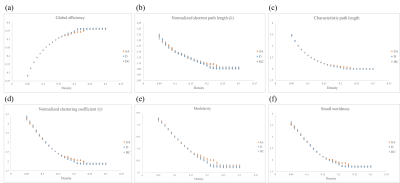
Figure 2. Topological parameters of graph theoretical analysis. Topological parameters including (a) global efficiency, (b) normalized shortest path length (λ), (c) characteristic path length, (d) normalized clustering coefficient (γ), (e) modularity and (f) small-worldness index among three groups (SA, D and HC).
-
Longitudinal assessment of lesion volume and ADC in patients with Fabry disease: a 5 year follow up study
Koen P.A. Baas1, Simon Körver2, Bram F. Coolen3, Gustav J. Strijkers3, Carla E.M. Hollak2, and Aart J. Nederveen1
1Radiology and Nuclear Medicine, Amsterdam UMC, Amsterdam, Netherlands, 2Endocrinology and Metabolism, Amsterdam UMC, Amsterdam, Netherlands, 3Biomedical Engineering and Physics, Amsterdam UMC, Amsterdam, Netherlands
ADC
values in Fabry patients were significantly higher within white matter lesions
compared to healthy white matter, and increased further with lesion age.
Moreover, before lesions were detected on FLAIR images, we already found abnormal
ADC values in these specific regions.
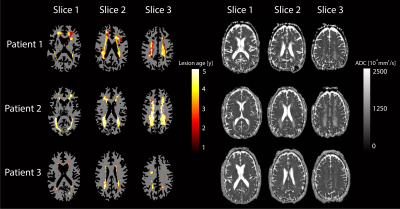
Figure 1:
lesion progression in three patients projected on WM segmentations (left) and
corresponding slices of ADC maps (right). Colors indicate the age of the
lesion. Only four time points were available for patient one and does therefore
not show lesion age of five years. Patient two and three had five available
time points.
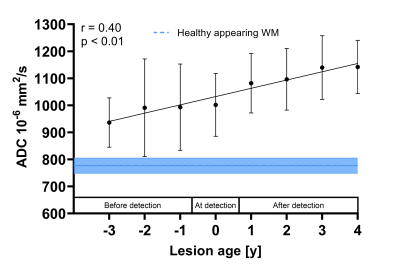
Figure 2: averaged
ADC values within newly detected WML as a function of lesion age. WMLs that
were present at the first time point were not included because the age of these
lesions cannot be determined. Error bars denote standard deviations. Linear
regression of all individual newly detected lesion areas after each year showed
a significant correlation between lesion age and ADC.
-
Free-Water Eliminated DTI Measures of Neuro-inflammation and White Matter Structural Deterioration in HIV-1 Clade C Infection
Teddy Salan1, Deepika Aggrawal2, Gaurav Garg2, Manju Mohanty2, Paramjeet Singh2, Mahendra Kumar1, Sameer Vyas2, and Varan Govind1
1University of Miami, Miami, FL, United States, 2Post Graduate Institute of Medical Education & Research, Chandigarh, India
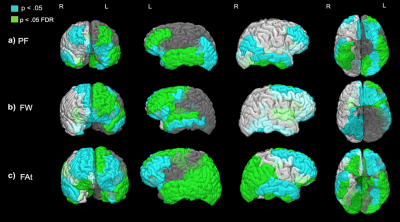
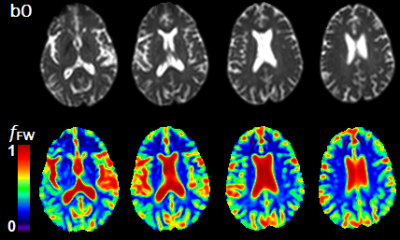
We use free-water eliminated DTI (FWE-DTI) to determine the extent of
micro-structural brain damage in drug-naïve HIV-1 clade C subjects. Our
results show white matter structural
abnormalities and inflammation manifested by increases in free water and reduced FWE fractional anisotropy.
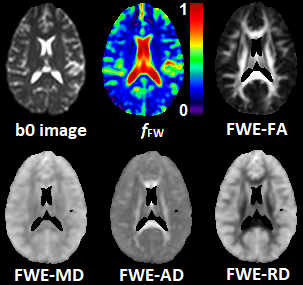
Axial slice from an HIV-1C positive subject illustrating the different parametric maps obtained with obtained with FWE-DTI: free-water volume fraction (fFW), fractional anisotropy (FWE-FA), mean diffusivity (FWE-MD), axial diffusivity (FWE-AD), and radial diffusivity (FWE-RD). A b0 image is included for anatomical reference.
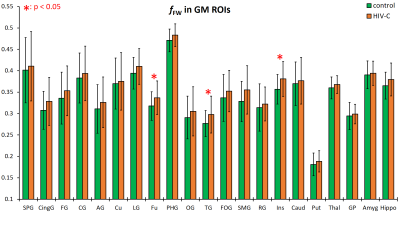
Free-water
volume fraction (fFW)
measured at 20 gray matter ROIs for the HIV-1C and control groups.
-
Mapping Increased Cerebral Free Water Volume Fraction in Hepatic Encephalopathy
Teddy Salan1, Varan Govind1, and Sameer Vyas2
1University of Miami, Miami, FL, United States, 2Post Graduate Institute of Medical Education & Research, Chandigarh, India
We applied free-water eliminated
diffusion tensor imaging (FWE-DTI) to calculate the
free-water volume content fraction (fFW)
in the brains of HE and healthy control subjects. We found significant fFW
increases among HE patients indicating low-grade edema and glial swelling.
Axial slices from the brain of an HE subject showing b0 images (top row) and the corresponding the fFW maps (bottom row).
Voxelwise z-score maps comparing fFW values from the brain of an HE subjects with the mean values of the control group. The z-scores are overlaid on a template T1 image in MNI space.
-
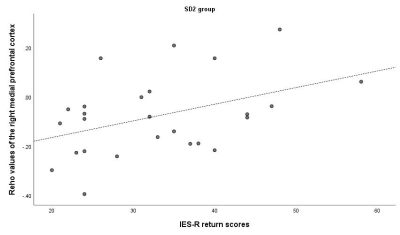
Preliminary results of longitudinal brain volume analyses in adolescents with Duchenne muscular dystrophy
Mariken C.R. Hoegen1,2, Nathalie Doorenweerd1,2,3, Emma M. Broek1, Kieren G. Hollingsworth4, Chiara Marini Bettolo5, Jos G.M. Hendriksen 6,7, Erik H. Niks2,8, Volker Straub3, and Hermien E. Kan1,2
1Department of Radiology, Leiden University Medical Center, Leiden, Netherlands, 2Duchenne Center Netherlands, Leiden, Netherlands, 3John Walton Muscular Dystrophy Research Centre, Newcastle upon Tyne, United Kingdom, 4Translational and Clinical Research Institute, Newcastle University, Newcastle upon Tyne, United Kingdom, 5Faculty of Medical Sciences, John Walton Muscular Dystrophy Research Centre, Newcastle upon Tyne, United Kingdom, 6Expertise Center Kempenhaeghe, Heeze, Netherlands, 7Duchenne Center Netherlands, Heeze, Netherlands, 8Department of Neurology, Leiden University Medical Center, Leiden, Netherlands
Our preliminary results show no changes in brain volume over time between groups. We found a consistently lower total grey matter volume and no differences in white matter volume in DMD. Our data suggest that the differences in brain volume in DMD are non-progressive up to ± 20 years of age.
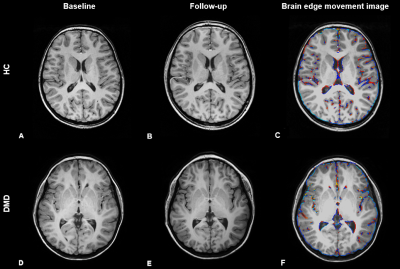
Figure
1. Axial slices of an individual participant with DMD and a healthy control.
The first row (A-C) show T1-weighted images of a HC at baseline
(A), follow-up (B) and the corresponding image of changes at the brain edges
superimposed on a interpolated halfway point between baseline and follow-up MR
images (edge-motion image). (C) The bottom row shows T1-weighted images of a participant with DMD, with baseline (D), follow-up (E) and
edge-motion image. The brain edge movement image shows local reductions (in
blue-green) and increases (red-yellow).
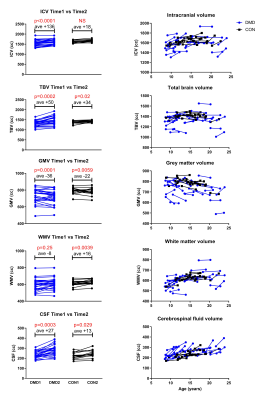
Figure 2. Left top to bottom: results of the
paired t-test between baseline (Time1) and follow-up (Time2) within groups; DMD
in blue, HC in black. Intracranial volume (ICV), total brain volume (TBV), grey
matter volume (GMV), white matter volume (WMV) and cerebrospinal fluid volume
(CSF) with average increase or average decrease over time. Results were
considered significant at Bonferroni corrected p≤0.005. Right
top to bottom: results of the longitudinal mixed model analysis between groups
corrected for age. DMD in blue, HC in black.
-
Cerebral iron deposition in gray nucleus in type 2 diabetes mellitus patients and the correlation with metabolic disorders
Yangyingqiu Liu1, Na Liu1, Yanwei Miao1, Ailian Liu1, Jiazheng Wang2, and Yishi Wang2
1Department of Radiology, First Affiliated Hospital of Dalian Medical University, Dalian, China, 2Philips Healthcare, Beijing, China
Iron deposition of the gray nucleus is quantitatively assessed by magnetic
sensitivity value (MSV)using quantitative susceptibility mapping (QSM), and its’
correlation to metabolic disorders index is also analyzed in patients with type 2 diabetes
mellitus (T2DM).
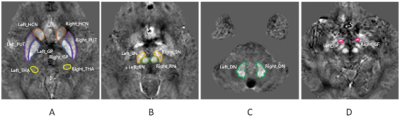
Fig.1 ROI
selection of gray nucleus. (A)The HCN、PUT、GP、THA are shown
front and back. (B)Showing the RN
and SN. (C) Showing the DN. (D) Showing the GF.
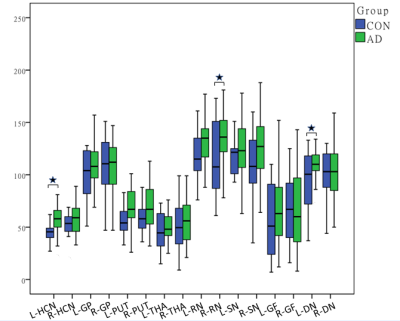
Fig.2 Comparison of gray nucleus MSV between T2DM
and CON group. ★P < 0.05.
-
Examining the association between sluggish cognitive tempo and functional connectivity in children with ADHD: A pilot study
Adebayo B Braimah1, Jonathan A Dudley1, Jeffery Epstein2, Leanne Tamm2, and Stephen P Becker2
1Imaging Research Center, Cincinnati Children's Hospital Medical Center, Cincinnati, OH, United States, 2Behavioral Medicine and Clinical Psychology, Cincinnati Children's Hospital Medical Center, Cincinnati, OH, United States
Sluggish
cognitive tempo symptoms were associated with lower connectivity between the
attention seed and medial visual areas. This preliminary study is one of the
first to indicate that SCT symptoms may be associated with specific connectivity patterns independent of ADHD symptom severity.
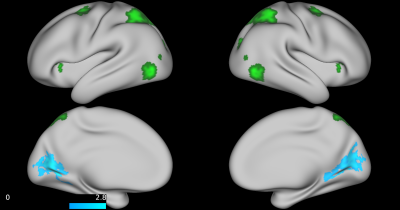
Figure
3: Child-rated SCT symptoms
(controlling for age, sex, and parent-rated ADHD inattention symptoms) shows
decreased functional connectivity between the attention seed region and the: left
cuneus cortex, left isthmus – cingulate cortex, left lingual gyrus, left
pericalcarine cortex, left precuneus cortex, right cuneus cortex, right isthmus
– cingulate cortex, right lingual gyrus, right parahippocampal gyrus, right
pericalcarine cortex, right precuneus cortex.
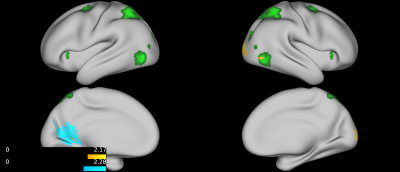
Figure
2: Teacher-rated SCT
(controlling for age, sex, and teacher-rated ADHD inattention symptoms) shows
increased functional connectivity between the attention seed region and the: right
cuneus cortex, right lateral occipital cortex, fight pericalcarine cortex, right
superior parietal cortex, and decreased functional connectivity between the: left cuneus cortex, left isthmus –
cingulate cortex, left lingual gyrus, left pericalcarine cortex, Left precuneus
cortex.
-
Fibre-specific white matter changes in neonates born to women prescribed methadone in pregnancy
Manuel Blesa Cábez1, Thijs Dhollander2, Victoria J Monnelly1, Alan J Quigley3, Scott I Semple4, Mark E Bastin4, and James P Boardman1
1MRC Centre for Reproductive Health, University of Edinburgh, Edinburgh, United Kingdom, 2Developmental Imaging, Murdoch Children's Research Institute, Melbourne, Australia, 3Department of Radiology, Royal Hospital for Sick Children, Edinburgh, United Kingdom, 4Edinburgh Imaging, University of Edinburgh, Edinburgh, United Kingdom
Prenatal exposure to methadone is associated with microstructural
alterations in major white matter tracts, assessed by a reduction in fiber-bundle
cross-section and fiber density and cross-section apparent soon after birth.
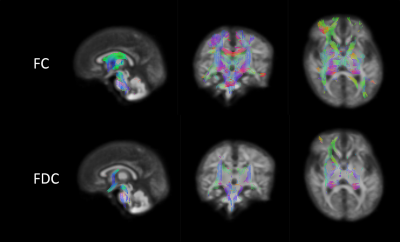
Figure 1: The top panels show
the areas where the prenatal methadone exposed group has lower FC and the
bottom panels show and the areas where they have lower FDC values. All the
results are overlaid to the WM FOD template for reference. Axial and coronal views
follow radiological convention.
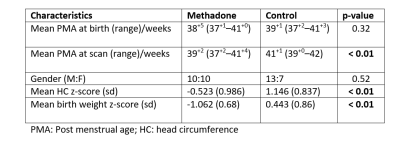
Table 1: Infant characteristics.
-
Correlations between microstructural changes of anterior cingulum cortex and cerebral small vascular disease induced depression : A DKI Study
Zhenyu Pan1, Kun li1, Dongtao Liu2, Xiuqin Jia1, Qiao Bu1, Rui Jia1, Tao Jiang1, Yueluan Jiang3, Qinglei Shi3, and Lichun Zhou2
1Department of Radiology, Beijing Chao-Yang Hospital, Beijing, China, 2Department of Neurology, Beijing Chao-Yang Hospital, Beijing, China, 3MR Scientific Marketing, Diagnosis Imaging, Siemens Healthineers China, Beijing, China
The study aimed to find the correlation between microstructural changes
of ACC and CSVD-induced depression patients by DKI. The results showed DKI
parameters of ACC are potentially useful for the quantitative evaluation the
degree of CSVD-induced depression.
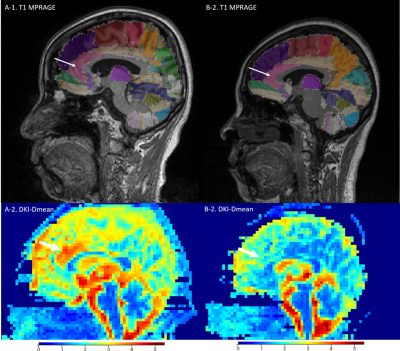
Figure 2. Images of CVSD-D patient (A-1, T1WI 3D MPRAGE, A-2, DKI-Dmean map) and CVSD-ND patient (B-1, T1WI 3D MPRAGE, B-2, DKI-Dmean map). Compared with non-depression CVDS patient, the Dmean map of CVSD-D patient have more warm pixels in region of ACC. White arrow indicate left ACC.
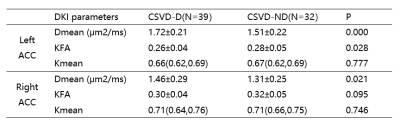
Table 1. A comparison of DKI derived parameters in ACC between two groups.
Note: Values are presented as mean ± SD or median
(interquartile range).
Abbreviations: Dmean, mean diffusivity; KFA, kurtosis fractional
anisotropy; Kmean, mean kurtosis.
-
Application of quantitative susceptibility mapping of brain iron content in children with autism
Shilong Tang1 and Lisha Nie2
1Children's Hospital of Chongqing Medical University, Chongqing, China, 2GE Healthcare, MR Research China, Beijing, Beijing, China
The results of this study indicate that the
brain magnetic
susceptibility values of
preschool children with autism is lower than that of normal preschool children.
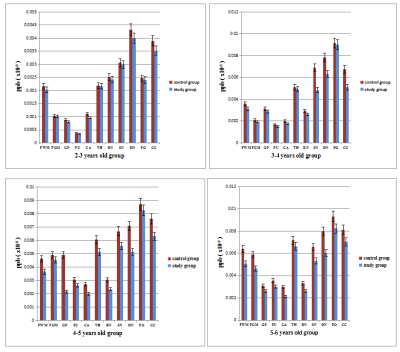
Fig. 1 Bar chart comparing brain iron content measurement results
across children in the same age group
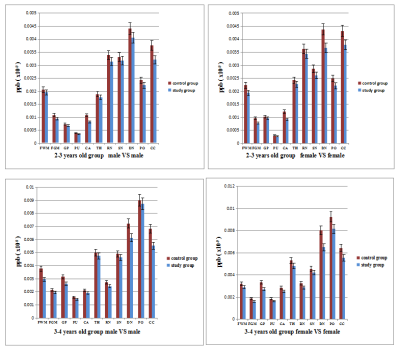
Fig. 2 Bar chart comparing brain iron content measurement results
across children in the same age and sex group
-
Preliminary Assessment of Intravoxel Incoherent Motion Diffusion-Weighted MRI Metrics in Acute Carbon Monoxide Poisoning
Shenghai Wang1, Juan Chen1, Kechao Xu1, Xiyao Zhang1, Haining Li2, and Zhengxian Zhang1
1Yan 'an People's Hospital, Yan 'an, China, 2First Affiliated Hospital of Xi 'an Jiaotong University, Xi 'an, China
The purpuse of this study was to assess microvascular perfusion and microstructural integrity using Intravoxel incoherent motion (IVIM) imaging in acute CO poisoning. This study shows that IVIM-DWI may be a promising method to assess brain perfusion and injury in acute CO poisoning.
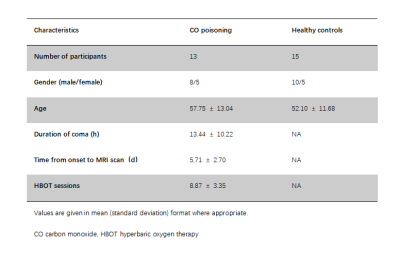
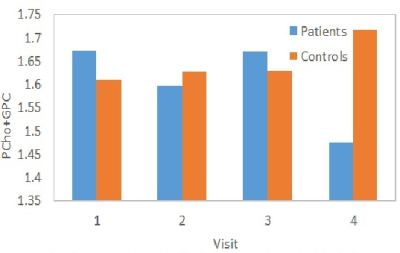
Table 1 demographic characteristics of the cohorts
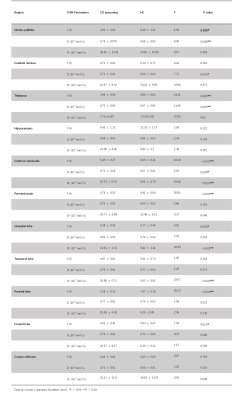
Table 2 Difference of IVIM Parameters between the patients with acute CO poisoning and healthy controls
-
A radiomics method to identify non-neuropsychiatric systemic lupus erythematosus with grey matter volume
Xiangliang Tan1, Kan Deng2, Yingjie Mei2, Tianjing Zhang2, Yang Song3, Qiaoli Yao1, and Yikai Xu1
1Medical Imaging Center, Nanfang Hospital, Southern Medical University, Guangzhou, China, 2Philips Healthcare, Guangzhou, China, 3Shanghai Key Laboratory of Magnetic Resonance, East China Normal University, Shanghai, China
Our study suggests that the grey matter
volume parameter is an effective classification feature for the radiomics
models to identify non-NPSLE patients from HC subjects.
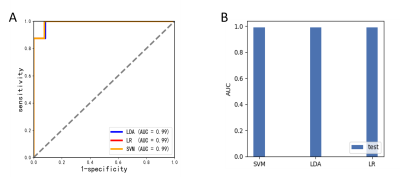
Figure 2(A) ROC
curves of the non-NPSLE classification on different classifiers (B) Histograms
of AUC on different classifiers. SVM, support vector machine, LDA, linear
discriminant analysis, LR, logistic regression.
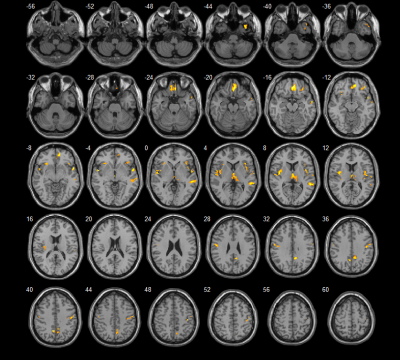
Figure 1. Brain
structures with grey matter volume decreased in non-NPSLE compared to healthy
controls
-
Demyelination is related to deep gray matter iron deposition in CADASIL patients
hui hong1, shuyue wang1, xinfeng Yu2, Yererfan Jiaerken2, Xiaojun Guan2, and minming zhang2
1radiology, Zhejiang University, hangzhou, China, 2radiology, the second affiliated hospital of zhejiang university, school of medicine, hangzhou, China
Demyelination of white matter is associated with deep gray matter iron deposition in CADASIL patients.
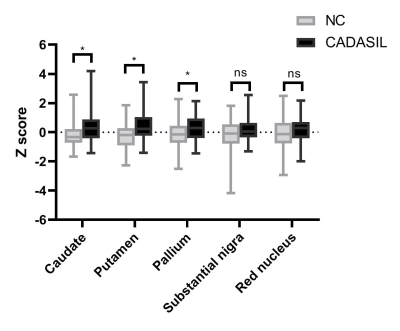
Comparison of iron deposition between
patients with cerebral autosomal dominant arteriopathy with subcortical
infarcts and leukoencephalopathy (CADASIL) and healthy controls. Increased iron
deposition of caudate, putamen, and pallium in patients with CADASIL compared
with healthy controls. ns indicates nonsignificant. *A significant correlation (P<0.05).
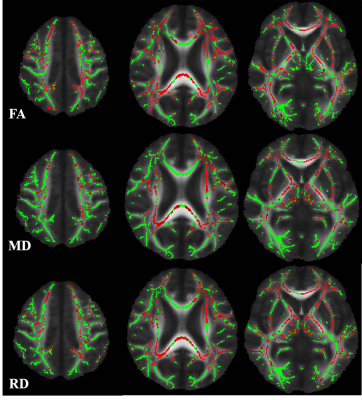
Correlations between white matter
microstructure and putamen iron deposition.
FA: fractional anisotropy; MD: mean diffusivity; RD:
radial diffusivity
-
Altered global functional network connectivity and its relationship to cognitive dysfunction in rheumatoid arthritis
Zeyu Liu1, Bo Hou1, and Feng Feng1
1Peking Union Medical College Hospital, Beijing, China
This study demonstrated the altered FCS in RA patients using rs-fMRI. The decreased FCS was correlated to worsening performance in MMSE and MoCA. The increased FCS of the left inferior parietal lobule/supramarginal gyrus in RA may partially compensate for cognitive dysfunction in RA.
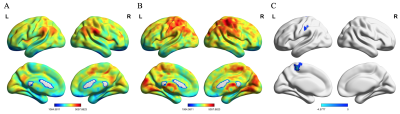
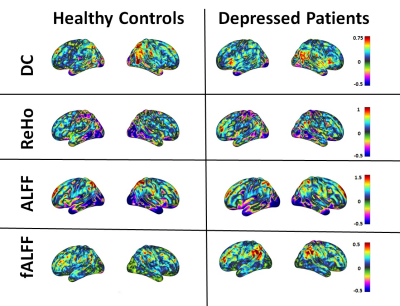
The images show the mean FCS in RA (A), HC (B) and the difference between RA and HC (C). The color bar at the bottom of each picture represents the FCS value for each group.
The correlation between FCS and neuropsychological scores (A, MMSE; B, MoCA) in RA patients. The color bar represents the ! value.
-
Limbic System Lateralization of Amide Proton Transfer Weighted Signals in Young Healthy Subjects
Yuhan Jiang1, Weiwei Wang1, Peipei Chang1, Yingqiu Liuyang1, Bingbing Gao1, Yiwei Che1, Renwang Pu1, Qingwei Song1, Ailian Liu1, Zhiwei Shen2, Jiazheng Wang2, and Yanwei Miao1
1the First Affiliated Hospital of Dalian Medical University, Dalian, China, 2Philips Healthcare, Beijing, China
In this study, we
investigated the APTw signals in the limbic system in healthy young volunteers
and found that significant higher APTw signals in the right side than those in
the left side, especially in the insula, post cingulum, para hippocampus, amygdala
and olfactory regions.
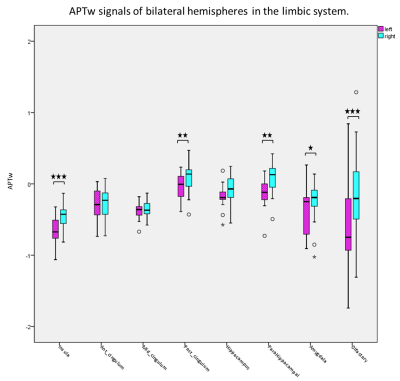
Fig 1. Comparison of APTw values of left and
right hemispheres in different regions of limbic system.
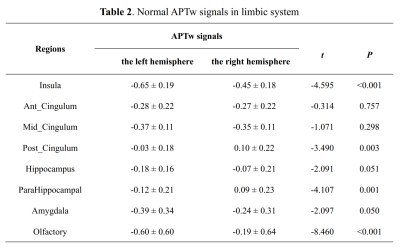
Table 2. Normal APTw signals in limbic system
-
Diffusion Tensor Imaging in Cubital Tunnel Syndrome
Ryckie George Wade1, Timothy T Griffiths1, Robert Flather1, Irvin Teh1, Hamied A Haroon2, David Shelley3, Sven Plein1, and Grainne Bourke3
1University of Leeds, Leeds, United Kingdom, 2University of Manchester, Manchester, United Kingdom, 3Leeds Teaching Hospitals, Leeds, United Kingdom
This proof-of-concept study shows that, throughout the length of the ulnar nerve, fractional anisotropy and radial diffusivity are significantly different between asymptomatic adults and adults with cubital tunnel syndrome.
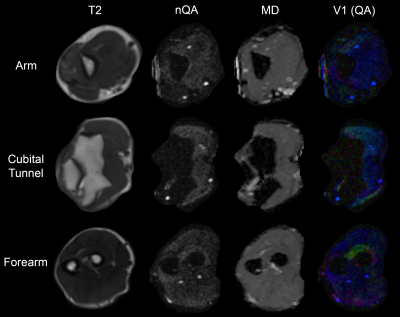
Figure 1. Data derived from a healthy control. The rows show data from the arm, cubital tunnel and forearm. The columns contain T2-weighted scans, and corresponding maps of normalised quantitative anisotropy (nQA), mean diffusivity (MD) and the principal eigenvector (V1) with the colours red, green and blue representing diffusion in x, y and z directions, and the intensity scaled by QA.
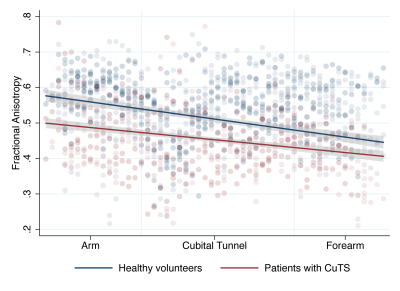
Figure 2. Scatter plot with linear fit (and 95% CI) showing the relationship between Fractional Anisotropy of the ulnar nerve in volunteers and patients, at different positions within the upper limb.
-
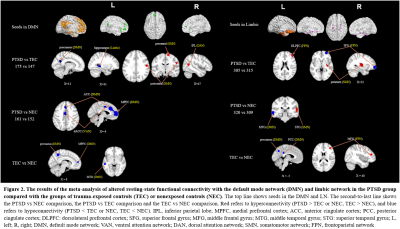
Resting-state functional connectivity and brain network abnormalities in depressive patients with suicidal ideation
Jun-Cheng Weng1,2,3, Yu-Syuan Chou4, Yuan-Hsiung Tsai5,6, and Vincent Chin-Hung Chen3,5
1Department of Medical Imaging and Radiological Sciences, and Bachelor Program in Artificial Intelligence, Chang Gung University, Taoyuan, Taiwan, 2Medical Imaging Research Center, Institute for Radiological Research, Chang Gung University and Chang Gung Memorial Hospital at Linkou, Taoyuan, Taiwan, 3Department of Psychiatry, Chang Gung Memorial Hospital, Chiayi, Taiwan, 4Department of Radiology, Taichung Veterans General Hospital, Taichung, Taiwan, 5School of Medicine, Chang Gung University, Taoyuan, Taiwan, 6Department of Diagnostic Radiology, Chang Gung Memorial Hospital, Chiayi, Taiwan
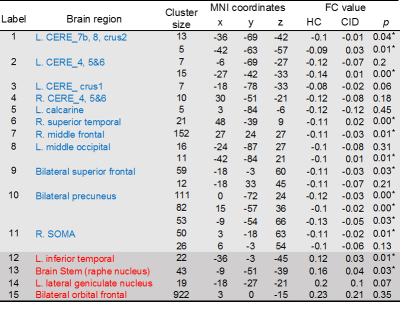
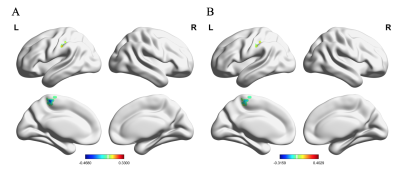
Our results showed that lower activity in the thalamus and cuneus regions were related to suicidal ideation. The different topological organization and slightly worse local segregation of the brain network in suicidal ideation patients.
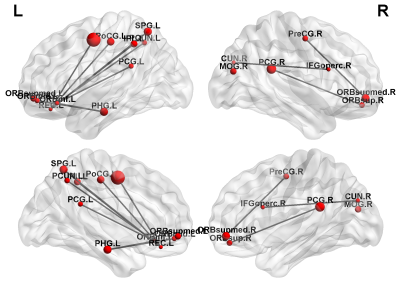
Figure 3. The NBS analysis results. A disrupted subnetwork was found in the SI group compared with the NS group (NS > SI).
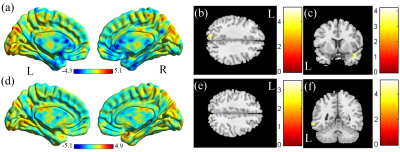
Figure 1. (a) Two-sample t-test results of mfALFF between the SI and the NS groups (NS > SI, color bar represents t-score). (b) Lower mfALFF of the left cuneus and (c) higher mfALFF of the right middle temporal pole gyrus were found in the SI group compared with the NS group. (d) Two-sample t-test results of mReHo between the SI and the NS groups (NS > SI; color bar represents t-score). (e) Lower mReHo of the right cuneus and (f) higher mReHo of the left middle temporal gyrus (MTG) were found in the SI group compared with the NS group.