-
Hyaluronan depletion improved intratumor pO2 and sensitized tumor to radiation therapy in pancreatic cancer model mouse.
Yu Saida1, Tomohiro Seki2, Shun Kishimoto1, Yasunori Otowa1, Kota Yamashita1, Kazutoshi Yamamoto1, Nallathamby Devasahayam1, Jeffrey R. Brender1, and Murali C. Krishna1
1Radiation Biology Branch, National Cancer Institute, Bethesda, MD, United States, 2Laboratory of Pharmaceutics, Faculty of Pharmacy and Pharmaceutical Sciences, Josai University, Saitama, Japan
Multimodal-molecular
imaging showed improved oxygenation, increased blood volume, and decreased lactate-to-pyruvate
ratio in tumors in response to PEGPH20 treatment. PEGPH20 could enhance the
effect of radiotherapy.
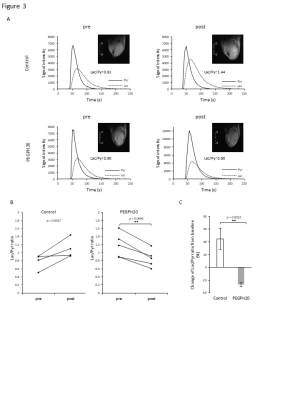
Fig. 3 HP [1-13C] Pyruvate MRI showed decreased Lac/Pyr
ratio after PEGPH20 treatment.
HP
[1-13C] Pyruvate MRI was performed in BxPC3-HAS3 tumor bearing mice treated
with control buffer or PEGPH20 before and after treatment. A,
Representative kinetics of [1-13C] pyruvate and [1-13C] lactate and its
anatomical 1H image. B, Lac/Pyr ratio of each tumor are shown by
treatment group. Individual values are shown. C, Lac/Pyr ratio change
from the baseline (pre-treatment) of each group.
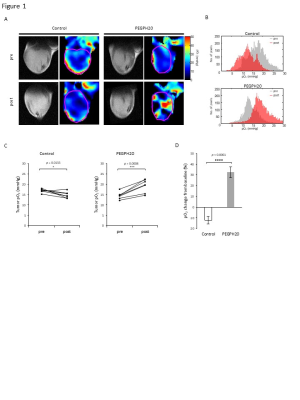
Fig. 1 EPR imaging showed increased pO2 after PEGPH20
treatment.
EPR
imaging was performed in BxPC3-HAS3 tumor bearing mice treated with control
buffer or PEGPH20 before and after treatment. A, Representative oxygen
map obtained by EPR imaging and T2-weighted anatomical image. B,
Histograms of pO2 distribution within the tumor of each group. C, The
mean pO2 of each tumor shown by treatment group. D, pO2 change (%) from
the baseline (pre-treatment) of each group.
-
Multimodal molecular imaging assessment of changes in tumor microenvironment in response to combination of Evofosfamide and GEM
Yasunori Otowa1, Kota Yamashita1, Yu Saida1, Kazutoshi Yamamoto1, Jeffery R Brender1, Nallathamby Devasahayam1, Murali C. Krishna1, and Shun Kishimoto1
1National Cancer Institute, Bethesda, MD, United States
still in progress
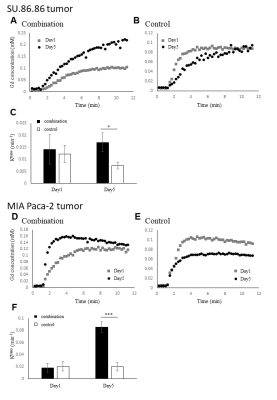
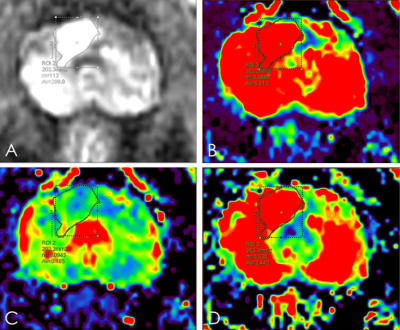
Permeability of Gd-DPTA into SU.86.86 and MIA
Paca-2 tumors before treatment on Day 1 and 1 hour after treatment on Day 5
evaluated by DCE-MRI. (A) (B) (D) (E)Kinetics of the Gd-DTPA incorporation into
SU.86.86 or MIA Paca-2 tumors treated with combination of evofosfamide and GEM or vehicle. (C)
Comparison of Ktrans in combination of evofosfamide and GEM and control treated
tumor in SU86.86 tumor (*P=0.041). (F) Comparison of Ktrans in combination of evofosfamide and
GEM and control treated tumor in MIA Paca-2 tumor (***P<0.001).
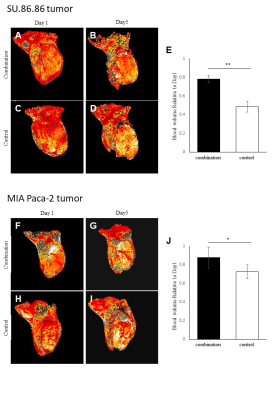
Blood volume (%) changes calculated using
MRI with the blood pooling T2 contrast agent USPIO. (A) (B) (C) (D) The images
of blood volume on Day 1 and Day 5 in SU.86.86 tumors. (E) Comparison of blood
volume on Day 5 relative to Day1 in SU.86.86 tumors (**P=0.004). (F) (G)
(H) (I) The images of blood volume on Day 1 and Day 5 in MIA Paca-2 tumors. (E)
Comparison of blood volume on Day 5 relative to Day1 in MIA Paca-2 tumors (*P=0.036).
-
Iron oxide-based Enzyme Mimic Nanocomposite for Dual-Modality Imaging Guided Chem-phototherapy and Anti-tumor Immunity Against Breast Cancer
Xiuhong Guan1, Jiali Cai2, Xiangyu Xiong1, Hong Liu2, Shihui Huang2, Sheng Wang2, Chuanqi Sun1, Yi Sun3, Tianjing Zhang4, Guoxi Xie1, and Zhiyong Wang2
1Department of Biomedical Engineering, Guangzhou Medical University, Guangzhou, China, 2School of Materials Science and Engineering, Sun Yat-sen University, Guangzhou, China, 3Siemens Healthineers, Shanghai, China, 4Philips Healthcare, Guangzhou, China
This
study reports a kind of functional nanocomposite, superparamagnetic iron oxide
nanocrystals (SPIO@NC), exhibiting NIR-II and MR dual-modal imaging guided chem-phototherapy
and anti-tumor immunity against triple-negative breast cancer.
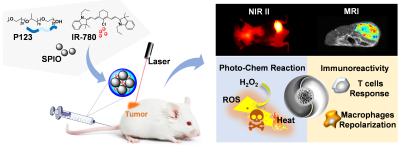
Schematic
illustration of experimental flow. Schematic illustration of SPIO@NC
synthesis and experiments in mice in
vitro and in vivo.
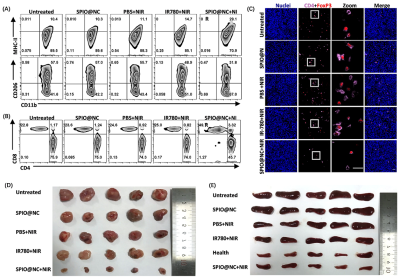
Fig.
4 (A)(B)Representative flow cytometric analysis displaying the
absolute percentage of (A)
M1
(MHC-II+) and M2 (CD206+) macrophages in CD45+CD11b+ tumor cells,
and (B) CD8+ T cells and
CD4+ T cells in CD45+CD3+
tumor cells from mice with different
treatments at 7 days. (n = 5). (C) Representative immunofluorescence
imaging of Treg cells (CD4+FoxP3+)
in tumor from mice received various
treatments on 7th days. Scale bar, 30μm. (D)(E) Real
pictures of tumors(D) and (E) after dissection from mice received different
treatments.
-
Precision MRI (pMRI) of Liver Metastasis enabled by Protein MRI contrast agents
Jenny Yang1, Mani Salarian2, Hua Yang3, Shanshan Tan4, Oluwatosin Y Ibhagui4, Jingjuan Qiao4, Zongxiang Gui4, and Hans E Grossniklaus3
1Chemistry, Georgia State University, Atlatna, GA, United States, 2Chemistry, Georgia State University, Atlanta, GA, United States, 3Emory University, Atlanta, GA, United States, 4Georgia State University, Atlanta, GA, United States
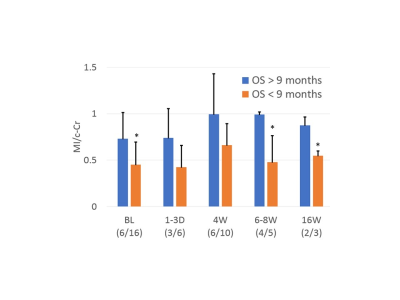
We anticipate that pMRI will demonstrate
significantly-improved imaging sensitivity and accuracy and will enable
detection of liver metastasis at a much earlier stage, potentially leading to
improved treatment responses.
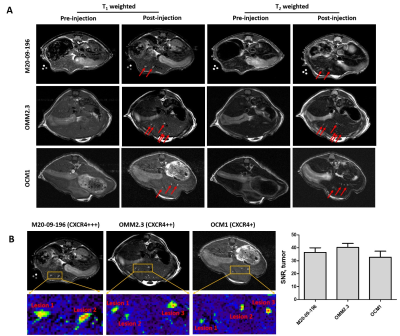
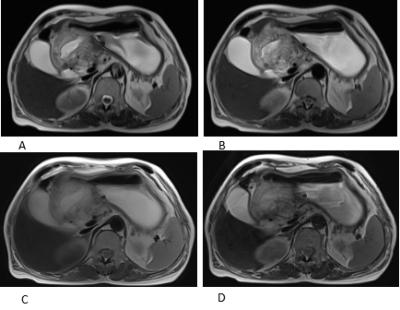
Figure 4. . MR images of metastatic
mice models with ProCA32.CXCR4 administration. A. Comparison of MRI images of
metastatic mice models including M20-09-196, OMM2.3, and OCM1 before and after
administration of ProCA32.CXCR4. B. Zoom-in view of the metastases from M20-09-196,
OMM2.3, and OCM1 mouse models; MRI signal-noise-ratio (SNR) of metastases
following the ProCA32.CXCR4 administration.
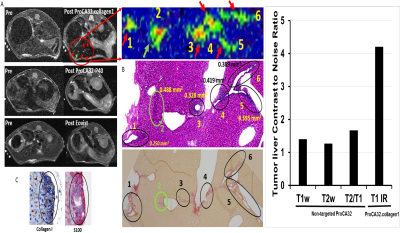
Figure 2. A Detection of UM
liver metastasis using ProCA32.collagen (top), non-targted ProCA32 (middle) and
Eovist (bottom) at 7T. Detected liver
metastasis are verified by H&E and Sirius red staining (B) and UM markers HMB45 and S100 staining (C). The tumor liver contrast to noise ratio is
further increased by inversion recovery pulse sequence showed in the figure on right.
-
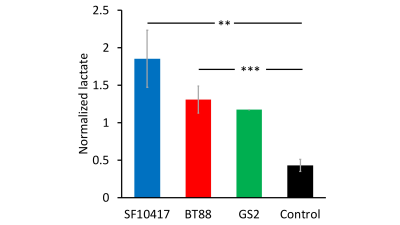
Imaging ascorbate-mediated oxidative stress in PDX models of pancreatic cancer
Nathaniel Kim1, Arsen Mamakhantan1, Kristin Granlund1, Elisa de Stanchina2, Manish Shah3, Lewis Cantley4, and Kayvan R. Keshari1
1Department of Radiology, Memorial Sloan Kettering Cancer Center, New York, NY, United States, 2Antitumor Assessment Core Facility, Molecular Pharmacology Program, Memorial Sloan Kettering Cancer Center, New York, NY, United States, 3Weill Cornell Medicine, New York-Presbyterian Hospital, New York, NY, United States, 4Meyer Cancer Center, Department of Medicine, Well Cornell Medical College, New York, NY, United States
Hyperpolarized dehydroascorbic acid was used to measure changes in redox in KRAS and BRCA mutant PDX models of pancreatic cancer. Increasing the hyperpolarized lifetime via D2O solvation in awake mouse injections allowed for changes in oxidative stress to be measured upon ascorbate therapy.
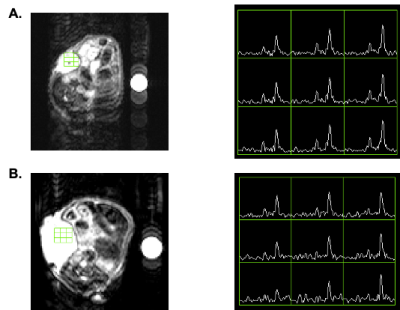
Figure 3. Representative HP 13C MRS of (A) vehicle and (B) ascorbate-treated KRAS PDX model of pancreatic cancer. Metabolic conversion of DHA to ascorbate in pancreatic cancer PDXs changes after 1 week treatment of twice daily ascorbate.

Figure 2. Tumor growth curves for patient derived xenograft models of KRAS and BRCA driven cancer. After 2 weeks of tumor implantation, mice were randomly divided into two groups. One group was treated with freshly prepared vitamin C in 400 μL of PBS (4 g/kg) twice a day via IP injection (KRAS, n= 7; BRCA, n = 7). Control group mice were treated with PBS using the same twice a day dose (KRAS, n = 7; BRCA, n = 7). Tumor growth change for the KRAS PDX tumors is significant after 21 days and significant after 4 days for the BRCA PDX tumors.
-
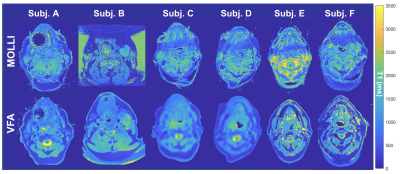
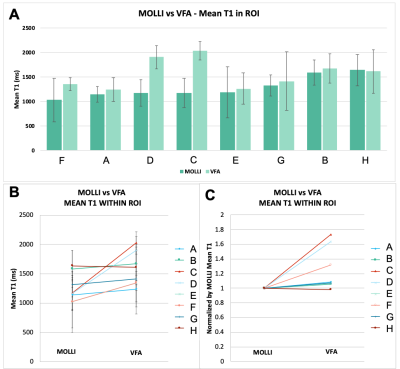
3D Free-breathing Multitasking T1-T2 Mapping in Small Animals on a 3-Tesla System: A Preliminary Study on a Murine Model with Liver Metastasis
Nan Wang1, Jingjuan Qiao2, Zhijun Wang3, Pei Han1,4, Hsu-Lei Lee1, Sen Ma1, Hui Han1, Zhaoyang Fan1, Anthony G. Christodoulou1, Ekihiro Seki3, Stephen Pandol5, Debiao Li1, Jenny Yang2, and Yibin Xie1
1Biomedical Imaging Research Institute, Cedars-Sinai Medical Center, Los Angeles, CA, United States, 2Chemistry Department, Georgia State University, Atlanta, GA, United States, 3Department of Medicine, Cedars-Sinai Medical Center, Los Angeles, CA, United States, 4Bioengineering, University of California, Los Angeles, Los Angeles, CA, United States, 5Division of Digestive and Liver Diseases, Cedars-Sinai Medical Center, Los Angeles, CA, United States
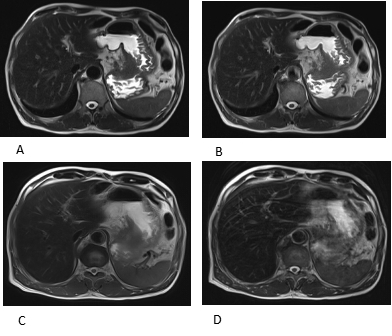
A Multitasking technique was proposed for mouse abdominal imaging at 3T, achieving 3D motion-resolved acquisition and simultaneous T1 T2 mapping within 10 minutes. It produced better images with vastly reduced scan time on a murine model with liver metastasis of colorectal cancer.
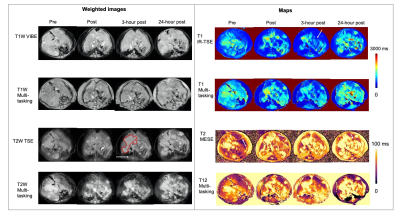
Figure 4: T1-T2-weighted images and T1 T2 maps from conventional methods and from Multitasking acquired on an HFD mouse at week 2 with ProCA.collagen1 injection. Multitasking consistently showed improved image quality. The tumor were labeled by red dashed boundary on T2W TSE. Tumor showed higher T1 and T2 values compared to normal liver parenchymal, which was consistent with conventional methods and Multitasking. Some breathing artifacts on conventional images were labeled by white arrows
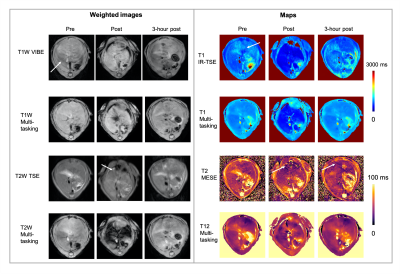
Figure 3: T1-T2-weighted images and T1 T2 maps from conventional methods and from Multitasking acquired on an LFD mouse at week 1 with Eovist injection. In each imaging session, conventional image series took about 45 to 50 minutes in total, while Multitasking can generate T1-T2-weighted images and T1 T2 maps in one single 10-min scan. Moreover, Multitasking produced improved image quality in both weighted images and quantitative maps. Some breathing artifacts on conventional images were labeled by white arrows
-
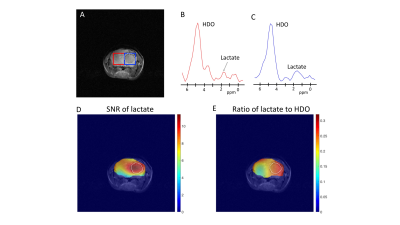
Deuterium metabolic imaging (DMI) of glucose highlights pancreatic cancers in two mice models
Stefan Markovic1, Tangi Roussel2, Keren Sasson3, Dina Preise3, Lilach Agemi3, Avigdor Scherz3, and Lucio Frydman1
1Department of Chemical and Biological Physics, Weizmann Institute of Science, Rehovot, Israel, 2Center for Magnetic Resonance in Biology and Medicine, Marseille, France, 3The Moross Integrated Cancer Research Center, Weizmann Institute of Science, Rehovot, Israel
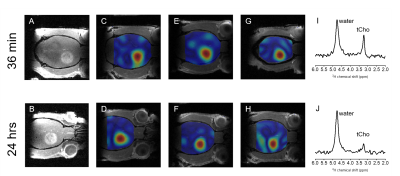
Deuterium
Metabolic Imaging was used to follow the metabolic conversion of 2H6,6’-glucose
in a pancreatic cancer mouse model at 15.2T. Lactate was produced exclusively in
the tumors, leading to the marking of the latter within the abdomen.
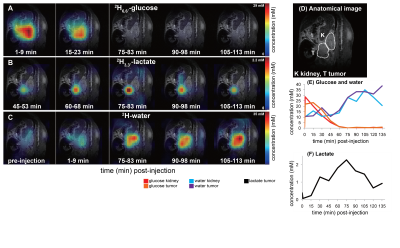
DMI
data collected at the indicated stages following the intravenous administration
of 2H6,6’-glucose to a pancreatic cancer mouse. Metabolic
maps of 2H6,6’-glucose (A) and its metabolic products 2H3,3’-lactate
(B) and 2H-water (C) are here shown as absolute concentration
colormaps. The anatomical 1H image on top of which all 2H
data are shown is depicted in (D). Concentrations for glucose and water (E) and
for the lactate (F) are shown for the entire time series.
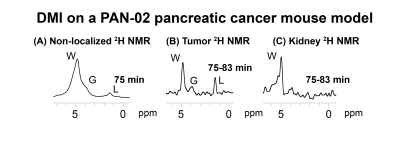
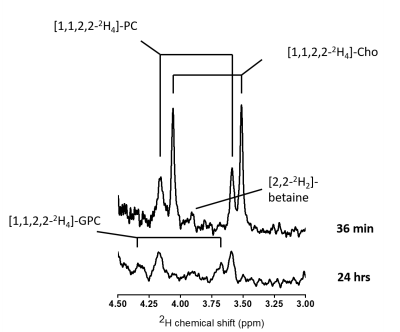
2H NMR spectra
arising at the indicated times after an intravenous 2H6,6’-glucose
administration into a pancreatic cancer mouse model. (B) and (C) show organ-specific
2H spectra extracted from the CSI data at the indicated sites. Signals
for 2H6,6’-glucose and its metabolic products water and
lactate are indicated by letters G, W and L respectively.
-
In-Vivo Cell Tracking of Murine Natural Killer Cells in Lymphoma by Fluorine-19 MRI
Lawrence Lechuga1, Sean B Fain1,2,3,4, Christian M Capitini3,4,5, and Matthew H Forsberg5
1Medical Physics, University of Wisconsin, Madison, Madison, WI, United States, 2Radiology, University of Wisconsin, Madison, Madison, WI, United States, 3Biomedical Engineering, University of Wisconsin, Madison, Madison, WI, United States, 4Carbone Cancer Center, University of Wisconsin, Madison, Madison, WI, United States, 5Pediatrics, University of Wisconsin, Madison, Madison, WI, United States
PFPE labeled NK cells were detected and quantified in 3 lymphoma bearing mice out to 6 days post injection by 19F MRI. Quantification indicates that 87% and 70% were detectible at days 0 and 6. Postmortem flow cytometry verified that NK cells maintain label and viability out to 6 days post injection.
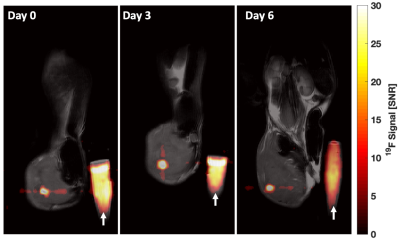
Representative mouse composite magnitude images on Day 0, 3, and 6 after intratumoral injection of 5.3 x 10⁵ NK cells into syngeneic EL4 lymphomas. Images were scaled against their own noise to place into units of pixel SNR. The 19F signal mitigating from labeled cells is detectible within the tumor in all three images. White arrow indicates the PFPE reference vial of known spin density.
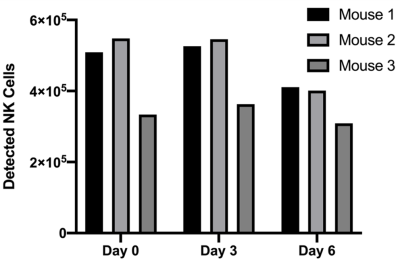
In vivo NK cell quantification results indicate the calculated number of PFPE-red labeled GFP+ NK cells within the tumor volume of each mouse. Difference in time points are not statistically significant.
-
Comparison of Tumour pH Environment and Glycolysis Measurements in a C6 Rat Model of Glioma
Qi Qi1,2,3, Matthew Fox1,4, Robert Bartha2,5,6, Miranda Bellyou5, Lise Desjardins7, Lisa Hoffman1,2,8, Alex Li5, Andrew McClennan1,2, Ting Yim Lee1,2,3,5,6, and Jonathan D Thiessen1,2,3,6
1Lawson Imaging, Lawson Health Research Institute, London, ON, Canada, 2Medical Biophysics, Western University, London, ON, Canada, 3Molecular Imaging, Western University, London, ON, Canada, 4Physics and Astronomy, Western University, London, ON, Canada, 5Robart Research Institute, London, ON, Canada, 6Medical Imaging, Western University, London, ON, Canada, 7Lawson Health Research Institute, London, ON, Canada, 8Anatomy and Cell Biology, Western University, London, ON, Canada
This study demonstrates the capability of
simultaneous measurements of pHi and pHe using CEST MRI,
a more complete picture of the tumour pH environment, and explores the
intrinsic relationship between tumour glycolysis and its pH environment.
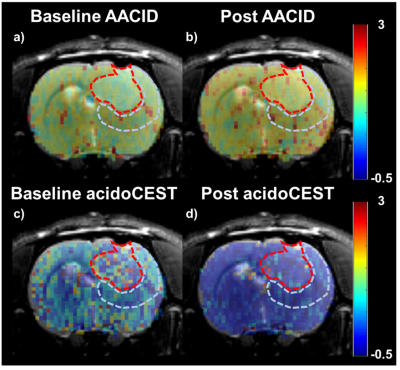
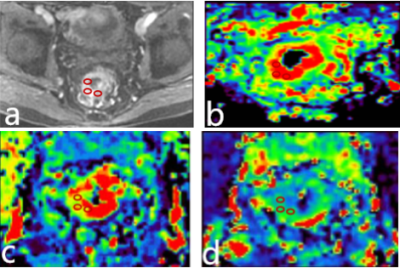
Figure 2: Illustrative examples
of baseline (a) and post-injection (b) AACID maps; baseline (c)
and post-injection (d) acidoCEST maps. All maps are overlaid on top
of the corresponding T2-weighted MRI. The tumour region is delineated with the
red-dotted line, and the peri-tumour region is contoured with the light-blue-dotted
line using the T2-weighted MRI.
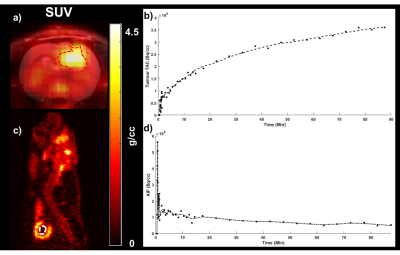
Figure 1: An illustrative
example of the FDG-PET image of the last frame (SUV, a), time-activity
curve from the tumour region (b) delineated with red-dotted line, and
the arterial input function (AIF) from the left ventricle of the heart delineated
with white-dotted line (c, d). The axial SUV map is overlaid on top of
the corresponding T2-weighted MRI.
-
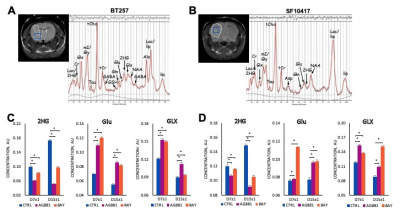
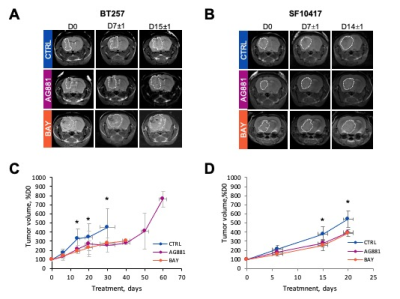
MRS based biomarkers of IDH1 mutant glioma response to the BAY-1436032 IDH inhibitor
Donghyun Hong1, Georgios Batsios1, Pavithra Viswanath1, Anne Marie Gillespie1, Russell O Pieper2,3, Joseph Costello2, and Sabrina M Ronen 1,3
1Department of Radiology and Biomedical Imaging, University of California, San Francisco, San Francisco, CA, United States, 2Department of Neurological Surgery, University of California San Francisco, San Francisco, CA, United States, 3Brain Tumor Research Center, University of California San Francisco, San Francisco, CA, United States
Here we treated mutant IDH1-expressing cells with the emerging inhibitor BAY-1436032 and identified translatable MRS based metabolic biomarkers of mutant IDH1 inhibition using 1H and hyperpolarized 13C spectroscopy.
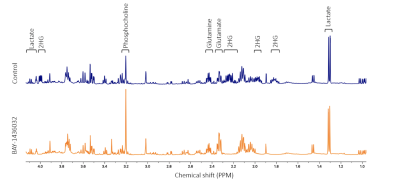
Figure 1. Representative 1H MRS spectra of control and treated NHAIDH1mut cells.
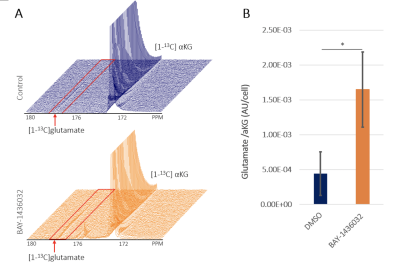
Figure 3. (A) shows fluxed from the hyperpolarized [1-13C]α-ketoglutarate to glutamate between control (blue) and the BAY-1436032 treated (orange) cells. A significant increase in glutamate was observed in the BAY-1436032 cells (B)
-
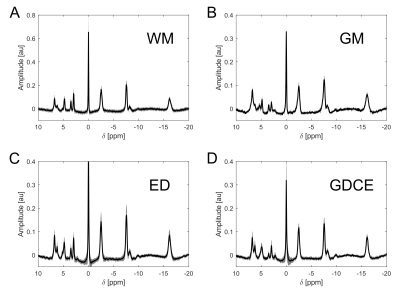
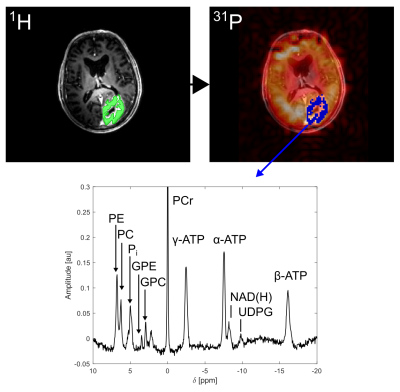
31P MRSI in tumor-bearing mice at 9.4T
Vanessa L. Franke1, Justyna Platek1, Philip S. Boyd1, Stephanie Laier2, Karin Mueller-Decker2, Andrey Glinka3, Mark E. Ladd1, Steffen Goerke1, Peter Bachert1, and Andreas Korzowski1
1Division of Medical Physics in Radiology, German Cancer Research Center (DKFZ), Heidelberg, Germany, 2Center for Preclinical Research, Core Facility Tumor Models, German Cancer Research Center (DKFZ), Heidelberg, Germany, 3Division of Molecular Embryology, German Cancer Research Center (DKFZ), Heidelberg, Germany
31P
MRSI with large spatial coverage in mice at B0=9.4T with a spatial
resolution of (2.5x2.5x7.5)mm³ obtained in 50 minutes is feasible and enables
the quantification of signals in diseased tissue, while maintaining the
separation to healthy tissue
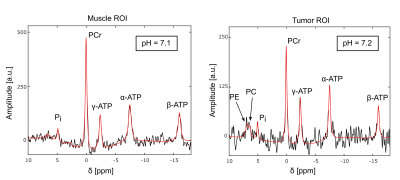
Figure 4: Summed 31P spectra from
the muscle (left) and tumor ROI (right) with the corresponding fitted signal
(red line) acquired with protocol 2 (Fig.3). Acquisition parameters: TR=300ms, α=45°, Δf=6060 Hz, 1024
time points, postprocessing with a 40-Hz Gaussian filter in time domain.
The following resonances were
resolved: PCr, ATP, Pi, PC, and Phosphoethanolamine (PE). Note the
different scales of the y-axis in both spectra.
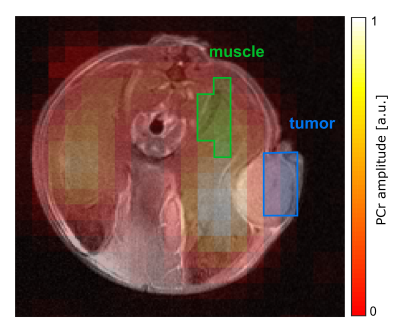
Figure 3: Transversal map of
the fitted PCr amplitude overlaid on the morphological 1H image in
the slice covering the tumor. Data was acquired with protocol 2: matrix size=10x10,
FOV=(25x25)mm², Hamming-weighted k-space averaging with 400 central averages, postprocessing with zerofilling-factor 2. The tumor ROI (blue) was
drawn on the marginal part of the tumor to reduce signal contamination from muscle. The muscle ROI (green) includes the same number of voxels as the
tumor ROI.
-
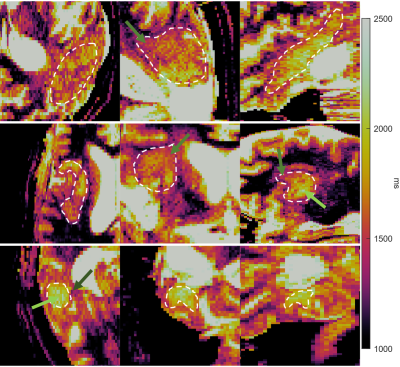
MR elastography reveals a marked increase in breast cancer viscoelasticity in vivo following hyaluronan degradation by PEGPH20
Emma L. Reeves1, Jin Li1,2, Konstantinos Zormpas-Petridis1, Jessica K. R. Boult1, James Sullivan1,3, Craig Cummings1, Barbara Blouw4, David Kang4, Ralph Sinkus5, Yann Jamin1, Jeffrey C. Bamber1, and Simon P. Robinson1
1Radiotherapy & Imaging, Institute of Cancer Research, London, United Kingdom, 2Institutes of Brain Science, Fudan University, Shanghai, China, 3Royal Marsden NHS Foundation Trust, Sutton, United Kingdom, 4Halozyme Therapeutics, San Diego, CA, United States, 5Division of Imaging Sciences and Biomedical Engineering, King's Health Partners, St Thomas's Hospital, London, United Kingdom
MRE revealed a ~80% increase in MDA-MB-231 LM2-4 tumour viscoelasticity following hyaluronan (HA) degradation by PEGPH20. However, no PEGPH20-induced change in viscoelasticity occurred in 4T1 or 4T1/HAS3 tumours. Hence, MRE is unlikely to provide a robust biomarker of HA degradation.
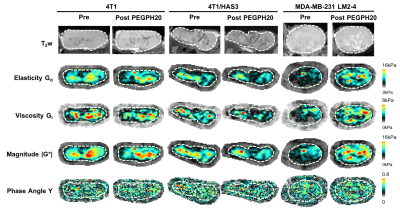
Figure 1. Anatomical T2-weighted (T2w) MRI and parametric maps of Gd, Gl, |G*| and Y for representative 4T1, 4T1/HAS3 and MDA-MB-231 LM2-4 tumours prior to and 24 hours after treatment with PEGPH20 (1 mg/kg). The tumour is delineated by a white dashed line.
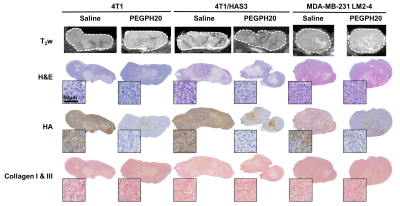
Figure 3. Anatomical T2-weighted (T2w) MRI and aligned tissue sections stained with H&E, HTI-601 (hyaluronan/HA) and picrosirius red (collagen I & III). Representative saline and PEGPH20 treated tumours are shown for each tumour model (4T1, 4T1/HAS3 and MDA-MB-231 LM2-4). The PEGPH20 treated tumours are the same as those shown in Figure 1. The whole section images highlight the close matching of the histology with MRI. Representative high-power images (20x) are inset next to each whole tumour section.
-
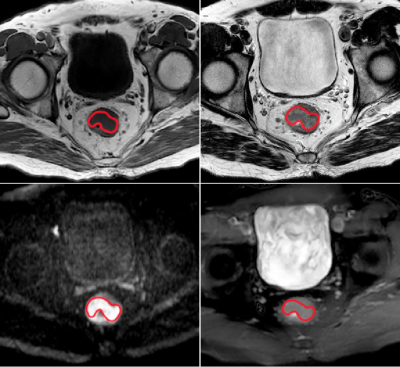
Metabolomic Characterization of renal cell carcinoma patient-derived xenografts and derived Tissue Slice Cultures
Deepti Upadhyay1, Jinny Sun1, Joao Piraquive Agudelo1, Hongjuan Zhao2, Rosalie Nolley2, Robert Bok1, James D. Brooks2, Donna M. Peehl1, John Kurhanewicz1, and Renuka Sriram1
1Department of Radiology and Biomedical Imaging, University of California, San Francisco, San Francisco, CA, United States, 2Department of Urology, Stanford University, Stanford, CA, United States
Metabolic characterization of renal cell carcinoma patient derived-xenografts and tissue slice cultures using stable isotope resolved metabolism showed metabolic heterogeneity among PDXs and TSCs of different clinical and pathological stages.
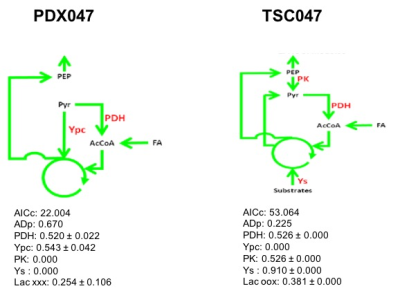
Figure 4. 13C Isotopomer modeling of [U-13C] glucose-labeled of PDX047 and TSC047 using tcaCALC software. (PDH - Pyruvate dehydrogenase, PK-Pyruvate Kinase, Y-denotes anaplerotic denotes, Ypc - Pyruvate Carboxylase and Ys- anaplerosis via succinyl CoA, glutaminolysis)
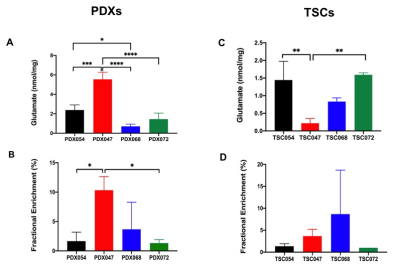
Figure 3: Comparison of (A) steady state concentration and (B) Fractional enrichment of glutamate among PDX model, while (C) & (D) represent steady state concentration and Fractional enrichment of glutamate, respectively among TSCs model. *p<0.05, **p<0.005, ***p< 0.0005, n=3 for all groups except TSC072 (n=2)
-
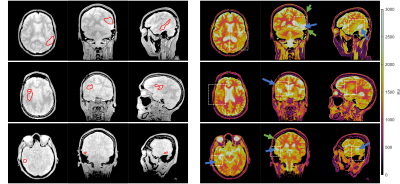
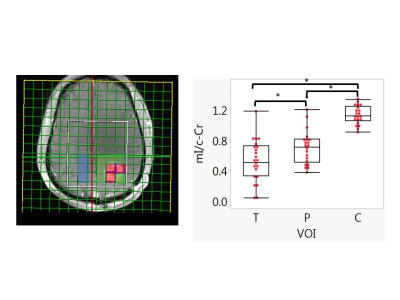
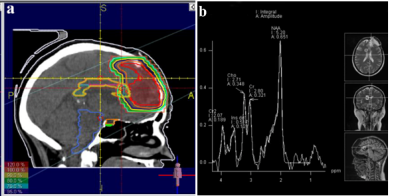
Glioma Genetic Diagnosis Software for Detection of IDH and TERTp Mutations based on 1H MR Spectroscopy and Mass Spectrometry
Abdullah Bas1, Banu Sacli-Bilmez1, Gokce Hale Hatay1, Alpay Ozcan2,3, Cansu Levi4, Ayca Ersen Danyeli3,5, Ozge Can3,6, Cengiz Yakicier3,7, M.Necmettin Pamir3,8, Koray Ozduman3,8, Alp Dincer3,9, and Esin Ozturk-Isik1,3
1Institute of Biomedical Engineering, Bogazici University, İstanbul, Turkey, 2Electrical and Electronics Engineering, Bogazici University, Istanbul, Turkey, 3Center for Neuroradiological Applications and Reseach, Acibadem Mehmet Ali Aydinlar University, Istanbul, Turkey, 4Department of Medical Biochemistry, Acibadem Mehmet Ali Aydinlar University, Istanbul, Turkey, 5Department of Medical Pathology, Acibadem Mehmet Ali Aydinlar University, Istanbul, Turkey, 6Department of Medical Engineering, Acibadem Mehmet Ali Aydinlar University, Istanbul, Turkey, 7Department of Molecular Biology and Genetics, Acibadem Mehmet Ali Aydinlar University, Istanbul, Turkey, 8Department of Neurosurgery, Acibadem Mehmet Ali Aydinlar University, Istanbul, Turkey, 9Department of Radiology, Acıbadem Mehmet Ali Aydinlar University, Istanbul, Turkey
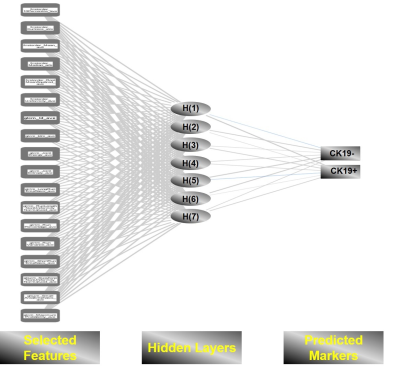
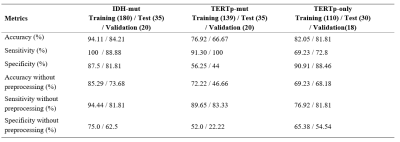
Glioma Genetic Diagnosis Software was developed for
noninvasive detection of IDH and TERTp mutations in gliomas. The
machine-learning models in the tool were trained with proton magnetic resonance
spectroscopy and mass spectrometry data of 237 gliomas.
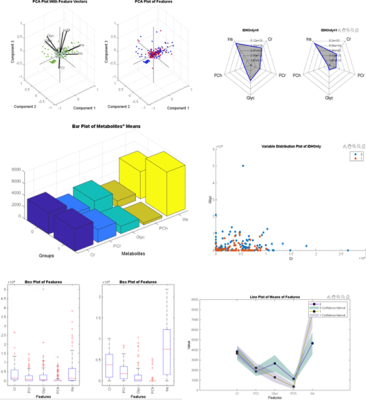
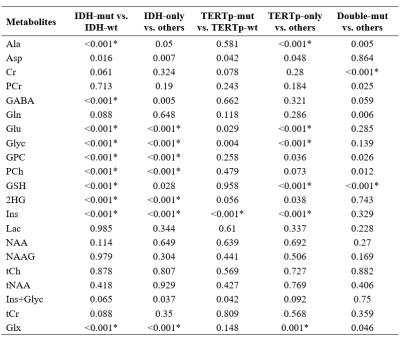
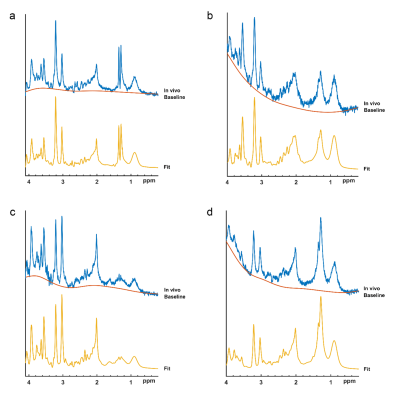
Figure 3: Visualization of
the data.
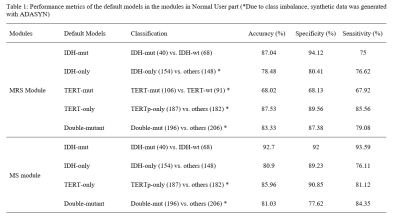
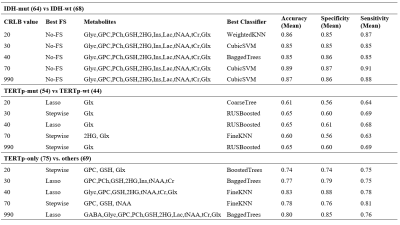
Table 1: Performance metrics of the
default models in the modules
in Normal User part (*Due to class imbalance, synthetic data was generated with
ADASYN)
-
Tumour vascular response to the FGFR inhibitor derazantinib assessed using susceptibility-contrast MRI with ferumoxytol
Jessica K.R. Boult1, Mahmoud El Shemerly2, Felix Bachmann2, Laurenz Kellenberger2, Heidi Lane2, Paul McSheehy2, and Simon P. Robinson1
1The Institute of Cancer Research, Sutton, United Kingdom, 2Basilea Pharmaceutica International Ltd, Basel 4005, Switzerland
FGFR inhibitor
derazantinib causes dose-dependent inhibition of endothelial cell proliferation,
VEGFR signalling and vascular permeability in mouse skin, and induces a
reduction in fractional blood volume, as assessed by susceptibility-contrast
MRI, in colorectal tumour xenografts.
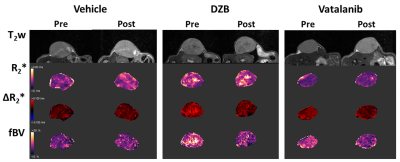
Figure 3. T2w images and paramagnetic maps of
baseline R2*, USPIO-induced ΔR2* and fractional blood
volume (fBV) from representative athymic nude mice pre and post 48h treatment
with vehicle, 80mg/kg DZB daily or 50mg/kg vatalanib twice daily.
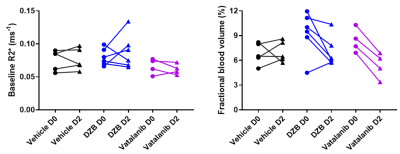
Figure
4. Quantification
of baseline R2* and fractional blood volume (fBV) in all mice pre and post 48h treatment with vehicle,
80mg/kg DZB daily or 50mg/kg vatalanib twice daily. DZB and vatalanib induced
significant reductions in fBV (p<0.05, 2-way repeated measures ANOVA).
-
Evaluating the utility of DCE-MRI in differentiating brain tumours using the extended Tofts and the Shutter Speed Model
Sourav Bhaduri1, Samantha Mills2, Mark Radon2, Michael Jenkinson3, and Harish Poptani1
1Department of Molecular and Clinical Cancer Medicine, University of Liverpool, Liverpool, United Kingdom, 2Department of Neuroradiology, The Walton Centre NHS Foundation Trust, Liverpool, United Kingdom, 3Department of Neurosurgery, The Walton Centre NHS Foundation Trust, Liverpool, United Kingdom
We demonstrate the potential utility of DCE-MRI derived pharmacokinetic parameters in differentiating brain tumour types using the extended Tofts and the Shutter Speed Model.
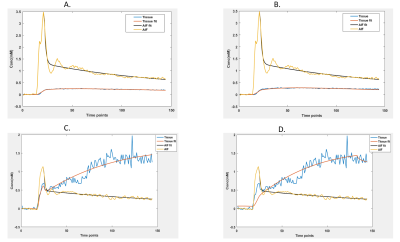
Fig 1: Model fitting using A. extended Tofts and B. SSM in PCNSL. The same is shown for GBM in C and D. The original AIF curve is shown in yellow and its biexponential fit shown in black. The tissue uptake is shown in blue with its fitting shown in red.
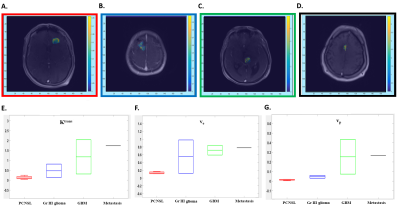
Fig 2: Ktrans maps from the extended Tofts model from a patient with PCNSL (A), Gr III Glioma (B), GBM (C) and Metastasis (D). Box plots demonstrating the Ktrans (min-1, E), ve (F) and vp (G) values using extended Tofts model demonstrate highest values in metastasis, while PCNSL patients demonstrate lower values.
-
Estimation of capillary level input function for abbreviated breast Dynamic Contrast-Enhanced MRI using deep learning approach
Jonghyun Bae1,2,3, Zhengnan Huang1,2,3, Florian Knoll2,3, Krzysztof Geras2,3, Terlika Sood2,3, Laura Heacock2,3, Linda Moy2,3, Li Feng4, and Sungheon Gene Kim5
1NYU School of Medicine, New York, NY, United States, 2Center for Advanced Imaging Innovation and Research, New York, NY, United States, 3Center for Biomedical Imaging, NYU, New York, NY, United States, 4Icahn School of Medicine at Mount Sinai, New York, NY, United States, 5Weill Cornell Medicine, New York, NY, United States
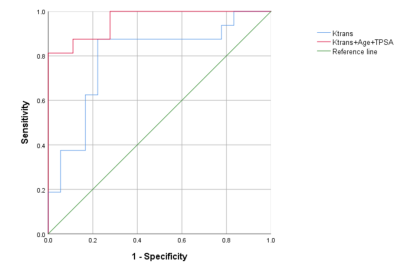
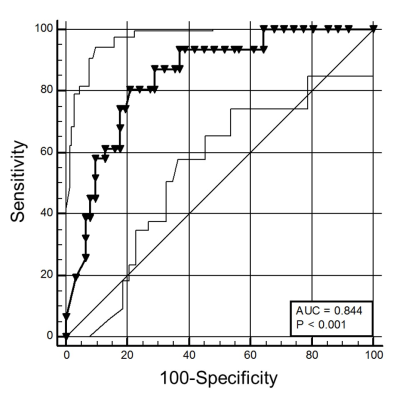
Our proposed AI-based approach to estimate CIF has demonstrated its accuracy in estimating Pharmacokinetic parameters to aid the diagnosis of the breast cancer in the clinical setting, while eliminating the need for any manual selection of AIF.
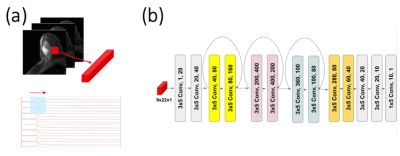
(a) A patch of DCE data has been rearranged to 2-dimensional matrix X = (n t), where n is the number of voxel (9 in our design) and t is the number of temporal frames. (b) Schematic diagram for the deep learning network. The total of twelve 2D-convolutional layers were connected in series and each convolutional layer is linked with Rectified Linear Unit activation function. After two layers, a skipping connection was made and filters were concatenated together, just like in the Residual Network
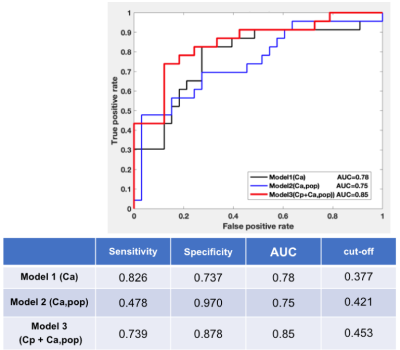
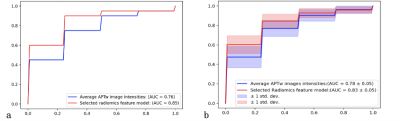
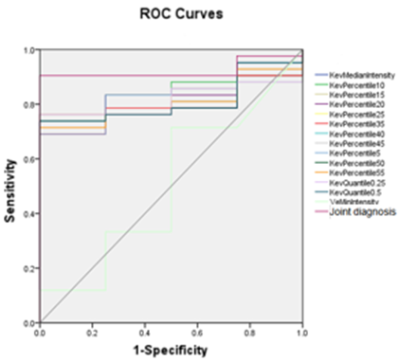
Receiver Operating Characteristic (ROC) curve for the estimated Fp from the PKM analysis of the clinical data. Fp estimation from 3 approaches using (1)the case-specific AIF(Ca), (2)the population-averaged AIF, and (3)the predicted Cp with the population-averaged AIF(Cp+Ca,pop) was used to assess the diagnostic performance in predicting the malignancy of breast cancer. Fp estimation from our proposed model yielded the highest AUC.
-
Commonality and complexity of systemic metabolic dysregulation caused by cancer and cancer-induced cachexia
Santosh Kumar Bharti1, Raj Kumar Sharma1, Paul T Winnard1, Marie-France Penet1, and Zaver M. Bhujwalla1,2,3
1Div. of Cancer Imaging Research, The Russell H. Morgan Dept of Radiology and Radiological Science, The Johns Hopkins University School of Medicine, Baltimore, MD, United States, 2Sidney Kimmel Comprehensive Cancer Center, The Johns Hopkins University School of Medicine, Baltimore, MD, United States, 3Radiation Oncology and Molecular Radiation Sciences, The Johns Hopkins University School of Medicine, Baltimore, MD, United States
Identification of systemic metabolic dysregulation
caused by cancer and
cancer-induced cachexia in PDAC cachexia mice model using high-resolution 1H MRS
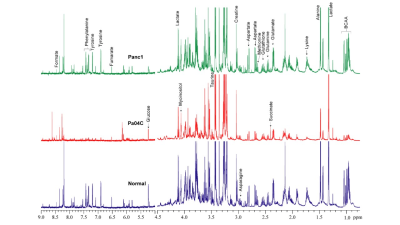
Figure
1: Representative
1H MR spectra acquired from aqueous phase tissue extracts of spleen
obtained from normal mice and cachectic (Pa04C ) and non-cachectic (Panc1)
tumor bearing mice.
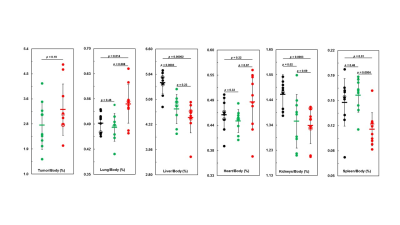
Figure 2: Lung, liver, heart, kidney and spleen weights in
control mice (black) as compared with Panc1 (green) and Pa04C (red) tumor‐bearing mice. In all panels, means of cohorts are
shown as rectangles bar. P-value less that ≤ 0.05 are considered statistically
significant.
-
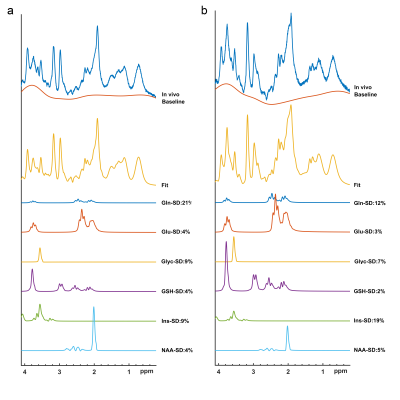
Wavelet Oversampling for Imbalance Childhood Brain Tumour Classification
Dadi Zhao1,2, James T. Grist1,2, Heather E.L. Rose1,2, Yu Sun1,2, and Andrew C. Peet1,2
1Institute of Cancer and Genomic Sciences, University of Birmingham, Birmingham, United Kingdom, 2Department of Oncology, Birmingham Children's Hospital, Birmingham, United Kingdom
Wavelet oversampling showed significantly improved classification performance of childhood brain tumours through metabolite profiles from 1H-MRS.
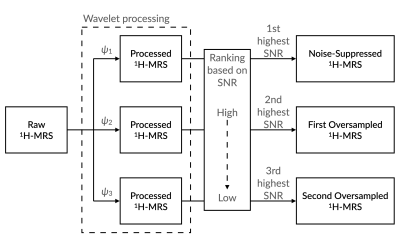
Illustration showing the procedure of generating oversampled proton magnetic resonance spectroscopy (1H-MRS) from the raw 1H-MRS by using Wavelet OverSampling (WvOS). Abbreviations: SNR, signal-to-noise ratios; ψ, wavelet basis.
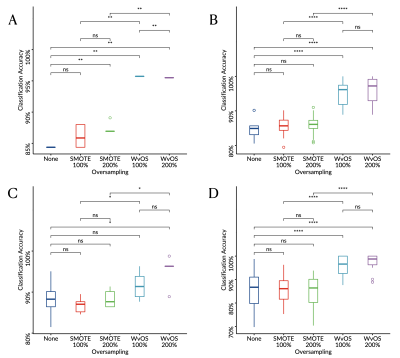
Boxplots showing the balanced classification accuracy for the 1.5T cohort of childhood brain tumours derived through linear discriminant analysis (A, C) or supper vector machine (B, D) with leave-one-out (A-B) or six-fold (C-D) cross validation.
-
Tumorous Tissue Characterization in Diffuse Glioma Based on 1H-MRS Data Employing 1D Convolutional Neural Networks
Farzad Alizadeh1,2, Anahita Fathi Kazerooni3,4, Hanieh Bahrampour5, Hanieh Mobarak Salari1,2, and Hamidreza Saligheh Rad1,2
1Department of Medical Physics and Biomedical Engineering, Tehran university of Medical Science, Tehran, Iran (Islamic Republic of), 2Quantitative MR Imaging and Spectroscopy Group, Research Center for Molecular and Cellular Imaging, Tehran, Iran (Islamic Republic of), 3Center for Biomedical Image Computing and Analytics (CBICA), University of Pennsylvania, Philadelphia, PA, United States, 4Department of Radiology, Perelman School of Medicine, University of Pennsylvania, Philadelphia, PA, United States, 5Biomaterials Engineering, School of Metallurgy and Materials Engineering, Iran University of Science and Technology, Tehran, Iran (Islamic Republic of)
Convolutional neural networks are able to differentiate brain tumorous tissue subregions based on 1H-MRS data with acceptable accuracy scores.
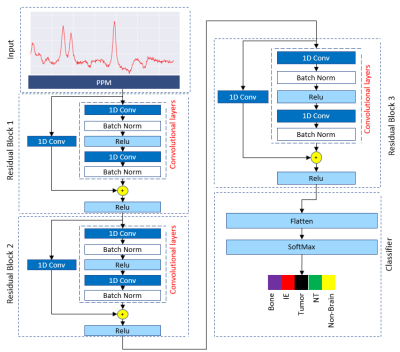
Our proposed Resnet-based convolutional neural
network architecture applied to classify five tissue types in diffuse glioma.
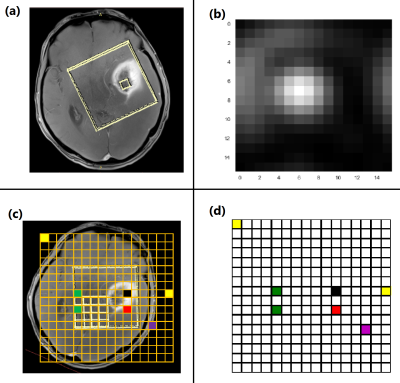
T1-w image of a patient with a diffuse glioma (a).
Chemical Shift Image (CSI) of the patient (b). Rotated overlaid image of CSI
grid on T1-w image (c). color coded grid of CSI in order to exact localization of the signals (d).