-
Hippocampal segmentation from 7T images showed reduced subfields volume in Sickle Cell Disease subjects
Tales Santini1, Minseok Koo1, Nadim Farhat1, Vinicius P. Campos2, Salem Alkhateeb1, Marcelo A. C. Vieira2, Meryl A Butters1, Caterina Rosano1, Howard J Aizenstein1, Joseph Mettenburg1, Enrico M. Novelli1, and Tamer S Ibrahim1
1University of Pittsburgh, Pittsburgh, PA, United States, 2University of Sao Paulo, Sao Carlos, Brazil
We collected and processed 7T MRI images from individuals with sickle cell
disease and matched controls. Individuals with SCD have significantly smaller
volumes of the DG+CA2+CA3 hippocampal region. Other subregions also showed a
trend towards smaller volumes
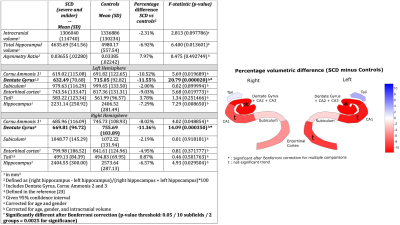
Neuroimaging characteristics. Mean volume (in mm3),
standard deviation and percent difference.
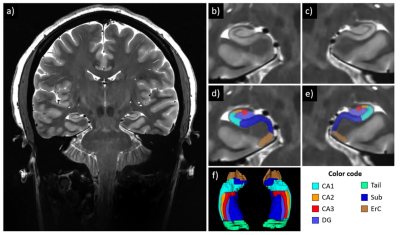
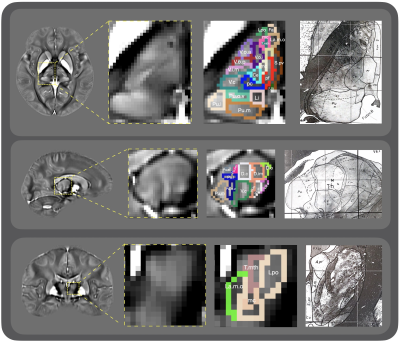
Example of hippocampal subfields segmentation in a subject
with SCD. a: coronal slice of the T2-weighted image, acquired at 7T with
resolution 0.375x0.375x1.5mm2; b,c: zoom-in images showing details
of the hippocampus structure, subject right and left, respectively; d,e:
hippocampus subfield segmentations overlaying the T2-weighted image, subject
right and left, respectively; f: 3D reconstruction of the hippocampal subfield
segmentations.
-
Altered intrinsic brain functional network dynamics in patients with end-stage renal disease undergoing maintenance hemodialysis
Baolin Wu1, Feifei Zhang1, Zhiyun Jia1,2, and Qiyong Gong1,3
1Huaxi MR Research Center (HMRRC), Department of Radiology, West China Hospital of Sichuan University, Chengdu, China, 2Department of Nuclear Medicine, West China Hospital of Sichuan University, Chengdu, China, 3Psychoradiology Research Unit of Chinese Academy of Medical Sciences (2018RU011), Chengdu, China
Our study demonstrated
altered dynamic functional connectivity properties in patients with end-stage
renal disease, and the number of transitions were correlated with cognitive
performance in those patients.
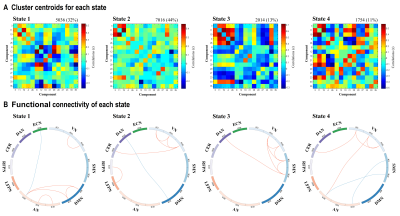
Figure 3. Results of the k-means clustering analysis per
state. A. Cluster centroids for each state. B. The strongest 5% of the
functional connectivity matrix in each state. Red lines represent positive functional connectivity, and
blue lines represent negative functional connectivity. VN = visual network; SMN = sensorimotor network; DMN = default mode network; AN = auditory network;
LFPN = left
frontoparietal network; RFPN = right frontoparietal network; CER = cerebellum;
DAN = dorsal attention network; ECN = executive control network.
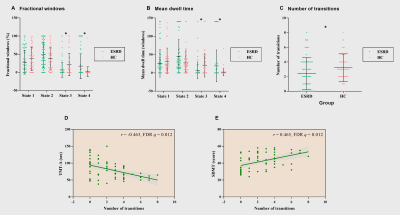
Figure 5. Between-group comparison in temporal
properties of functional connectivity states and the partial correlation
analysis results. Dot plots show individual data points (squares),
averages (transverse lines), and standard deviations (vertical lines) of the
mean fractional windows (A), mean dwell time (B), and total number of
transitions (C). The transverse lines represent averages, and the vertical
lines represent standard deviations. D-E. Partial correlation analysis results. *p < 0.05. TMT-A = Trail
Making Test A; SDMT = Symbol Digit Modalities Test
-
Diagnostic accuracy of ASL in comparison with DSC perfusion in the surveillance of different types of brain tumors
Anna Lavrova1, Wouter Teunissen2, Esther Warnert2, Martin van den Bent3, Vladimir Cheremisin1, and Marion Smits2
1Radiology, Saint Petersburg University, Saint Petersburg, Russian Federation, 2Radiology, Erasmus MC, Rotterdam, Netherlands, 3Neurology, Erasmus MC, Rotterdam, Netherlands
Our findings so far suggest using ASL instead of DSC in glioma at 3T, whereas lymphoma and metastases require further investigation in the follow-up analysis.
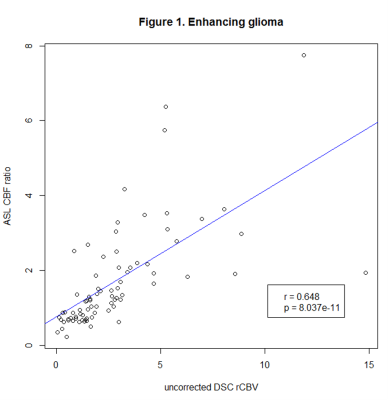
Figure 1. Pearson’s correlation coefficients of ASL CBF ratio and uncorrected DSC rCBV in enhancing glioma.
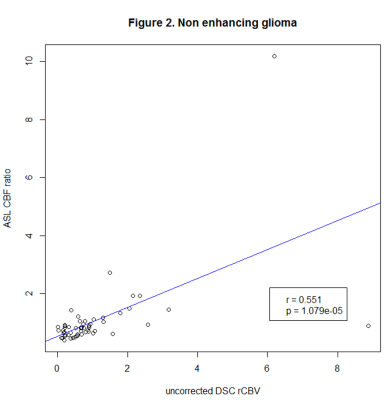
Figure 2. Pearson’s correlation coefficients of ASL CBF ratio and uncorrected DSC rCBV in non-enhancing glioma.
-
Regional Brain Perfusion Changes in Cognition and Mood Regulatory Sites in Patients with Type 2 Diabetes Mellitus
Bhaswati Roy1, Sarah Choi2, Matthew J. Freeby 3, and Rajesh Kumar1,4,5,6
1Anesthesiology, University of California Los Angeles, Los Angeles, CA, United States, 2School of Nursing, University of California Los Angeles, Los Angeles, CA, United States, 3Medicine, Endocrinology - Diabetes and Metabolism, University of California Los Angeles, Los Angeles, CA, United States, 4Bioengineering, University of California Los Angeles, Los Angeles, CA, United States, 5Radiological Sciences, University of California Los Angeles, Los Angeles, CA, United States, 6Brain Research Institute, University of California Los Angeles, Los Angeles, CA, United States
T2DM
patients show cognitive and mood changes, and brain tissue injury in those
regions; however, the underlying cause of tissue injury is unknown. We found
significantly reduced CBF in multiple brain areas and its associations with
functional deficits in those control sites in the condition.
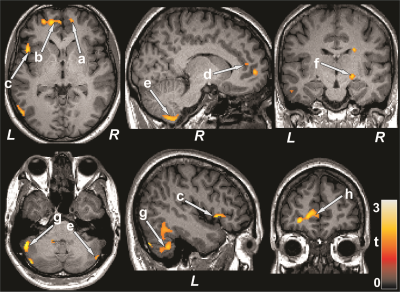
Figure 1: Brain regions with reduced cerebral blood flow in
T2DM patients over control subjects. The sites with reduced cerebral blood flow
in T2DM patients were included the bilateral prefrontal cortices (a, b), right
insula (c), bilateral cingulate (d, h), bilateral cerebellum (e, g), and right
thalamus (f). All images are in neurological convention (L = left; R = right).
Color bar indicates t-statistic values.
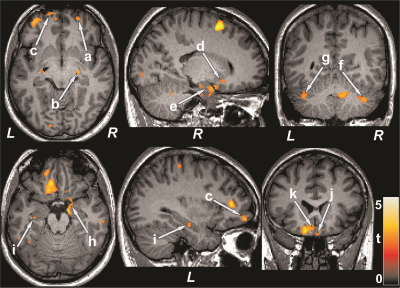
Figure 3: Cognition showed positive associations with cerebral
blood flow in T2DM patients. Positive correlations appeared between MoCA scores
and cerebral blood flow of the bilateral prefrontal cortices (a, c), right
thalamus (b), right putamen (d), bilateral hippocampus (e, i), bilateral
cerebellum (f, g), right amygdala (h), and bilateral basal forebrain (j, k).
Figure conventions are same as in Figure 1.
-
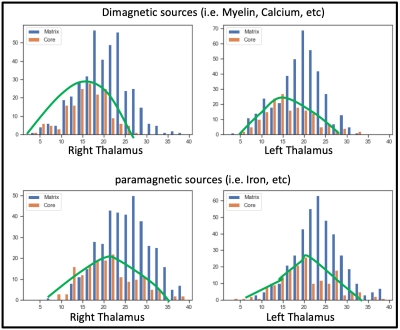
Application of quantitative susceptibility mapping in assessment of iron content in brain regions of normal children
Shilong Tang1 and Lisha Nie2
1Children's Hospital of Chongqing Medical University, Chongqing, China, 2GE Healthcare, MR Research China, Beijing, Beijing, China
Quantitative susceptibility
mapping can evaluate the iron content in each brain region of normal children
and facilitate the diagnosis and treatment of clinical diseases.
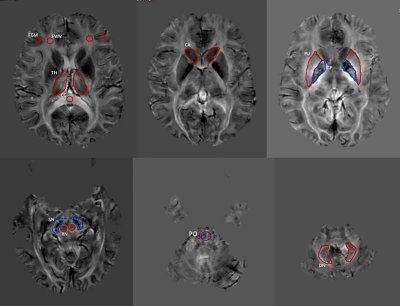
Fig. 1 Schematic diagram of the ROI measurement in various
regions of the brain
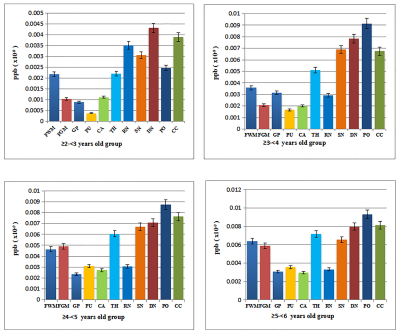
Fig. 2 Bar chart
comparison of the iron content measurement results of various brain regions in
each age group
-
Regional Brain Growth in Fetuses with Congenital Diaphragmatic Hernia
Fedel Machado-Rivas1,2, Lina Acosta Buitrago3, Jungwhan J Choi1,2, Onur Afacan1,2, Clemente Velasco-Annis1, Simon K Warfield1,2, Ali Gholipour1,2, and Camilo Jaimes1,2
1Radiology, Boston Children's Hospital, Boston, MA, United States, 2Radiology, Harvard Medical School, Boston, MA, United States, 3Universidad del Rosario, Bogota, Colombia
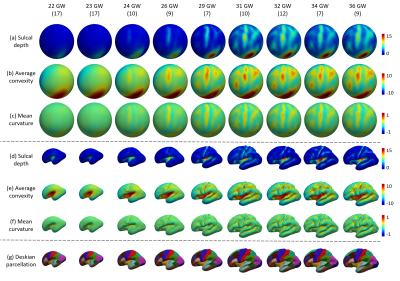
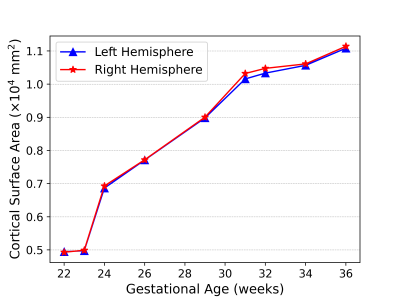
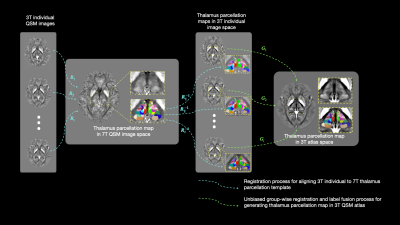
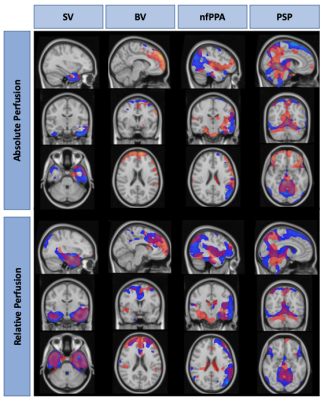
Brain growth trajectories of fetal subjects with congenital diaphragmatic hernia (CDH) show global and localized volume loss when compared to typically developing fetuses. Volume differences between controls and CDH subjects are associated with hernia morphometric characteristics.
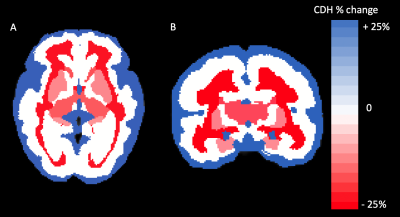
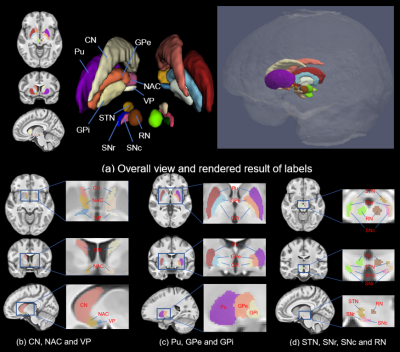
Axial (A) and corononal (B) heat map of segments differences between controls and CDH subjects. Percent change for CDH subjects when compared to controls is displayed. Segments in blue represent volume gain, while segments in red correspond to volume loss. White segments were not significantly different from controls.
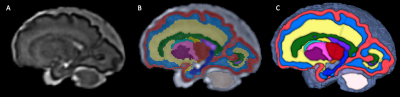
(A)T2-weighted super-resolution volume reconstruction with inter-slice motion correction, and intensity normalization of a T2-weighted fetal acquisition (29 week-old fetus). (B) Propagation of fetal atlas labels. (C) 3D volumetric rendering of propagated labels.
-
Inter-rater reliability of sciatic nerve evaluation with MR neurography: a comparison study of multiple sequences
Ryuna Kurosawa1, Hajime Yokota2, Takafumi Yoda1, Takayuki Sada1, Koji Matsumoto1, Takashi Namiki3, Masami Yoneyama3, Yoshitada Masuda1, and Takashi Uno2
1Department of Radiology, Chiba University Hospital, Chiba, Japan, 2Diagnostic Radiology and Radiation Oncology, Graduate School of Medicine, Chiba University, Chiba, Japan, 3Philips Japan, Tokyo, Japan
To evaluate inter-rater reliability of sciatic nerve evaluation with various MRN sequences. 3D-iNerveVIEW had high inter-rater reliability for signal measurements. For MRN measurements, it is important to understand the characteristics of each sequence.
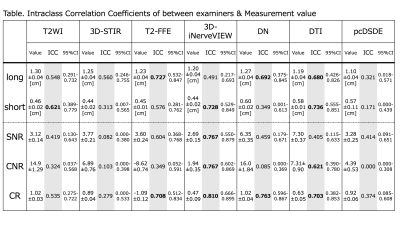
Figure 4. Intraclass coefficient correlations between two examiners for the sciatic nerve size and signal measurements. Bold represents ICC> 0.601. T2-FFE, DN, and DTI show substantial agreements in the long diameter, while T2WI, 3D-iNerveVIEW, and DTI show substantial agreements in the short diameter. Regarding the signal measurements, 3D-iNerveVIEW shows substantial to almost perfect agreements in signal-to-noise ratio (SNR), contrast-to-noise ratio (CNR), and contrast ratio (CR).
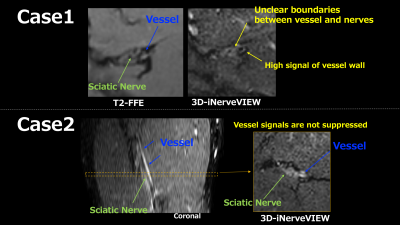
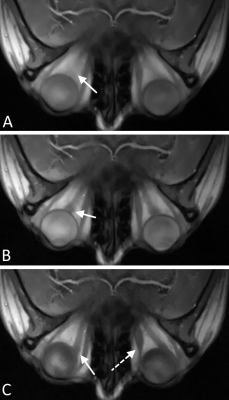
Figure 5. Problems with 3D-iNerveVIEW. Case1: By suppressing the signal of the vessel, the boundary between nerves and blood vessels becomes unclear. In addition, the vessel walls running in parallel in the long diameter direction of the sciatic nerve become high signals, which reduces visibility. Case2: The vessels are misidentified and measured as nerves when the signal of the vessels running parallel to the long diameter of the sciatic nerve cannot be suppressed.
-
White Matter fiber orientation dependent R2*: comparison between post mortem in situ and in vivo
Celine Berger1,2, Claudia Lenz1,2, Melanie Bauer1,2, Eva Scheurer1,2, and Christoph Birkl3
1Institute of Forensic Medicine, Department of Biomedical Engineering, Basel, Switzerland, 2Institute of Forensic Medicine, Health Department Basel-Stadt, Basel, Switzerland, 3Department of Neuroradiology, Medical University of Innsbruck, Austria
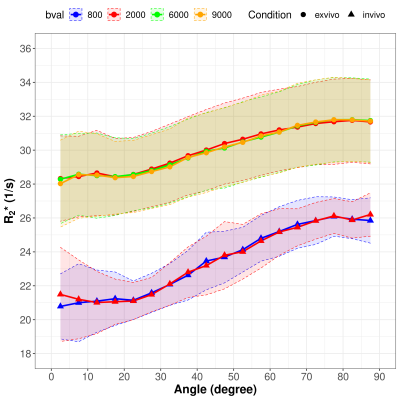
R2* increased with increasing fiber angle in both post mortem in situ and in vivo, whereby a decreased R2* orientation dependency was observed post mortem compared to in vivo.
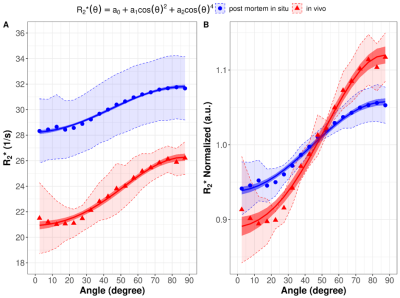
Figure 2: R2* as a function of the WM fiber angle averaged over the in vivo subjects (red) and the post mortem subjects (blue) fitted with the absolute values (A) and normalized to the global mean WM R2* (B). The shaded areas represent the 95% CI of the measured data.
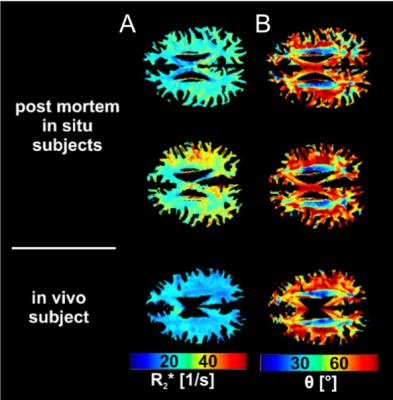
Figure 1: Representative maps of R2* (A) and fiber angle θ (B) of two post mortem subjects with brain temperatures of 5.6°C (top row) and 14.9 °C (middle row) and one in vivo subject shown in the bottom row.
-
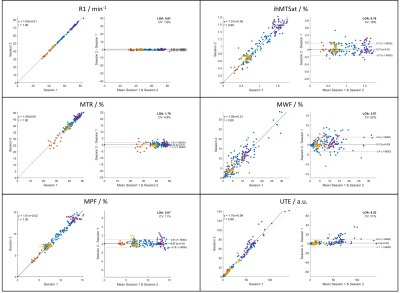
Reproducibility of brain ultrashort-T2* component measurements in healthy volunteers
Nikhil Deveshwar1,2 and Peder E. Z. Larson1,2
1Department of Radiology and Biomedical Imaging, University of California, San Francisco, San Francisco, CA, United States, 2UC Berkeley - UCSF Graduate Program in Bioengineering, Berkeley and San Francisco, CA, United States
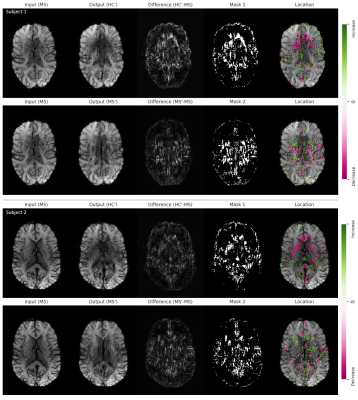
Ultrashort-T2* fraction parameter maps generated at different scans show similar looking structures in the same volunteer. The distributions of the ultrashort-T2* fractional component in various brain ROIs show similar distributions suggesting this technique is reproducible.
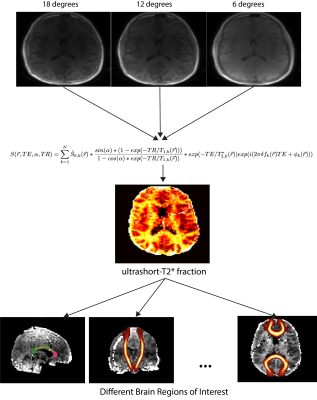
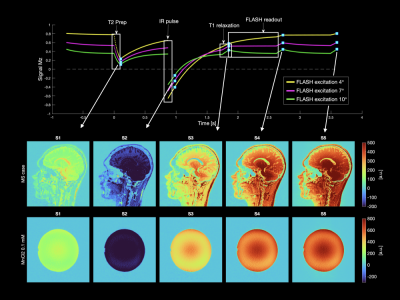
Figure 1: The proposed image processing pipeline. UTE scans at three different flip angles (18, 12, and 6 degrees) are fit with the following signal model. The resulting parameter map corresponding to the ultrashort-T2* fractional component is then used to isolate values in various brain ROIs.
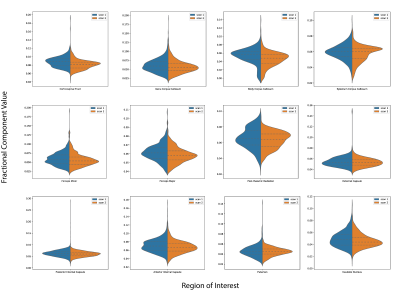
Figure 3: Split violin plots comparing the distributions of the ultrashort-T2* component fraction in various brain ROIs across 4 healthy volunteers. The dashed lines represent the interquartile range of each distribution.
-
Correlating Concussion-Related Symptoms to the Personalized MRI Assessment of Brain Abnormalities in Children
Ethan Danielli1,2, David Stillo1,2, Rachelle Ho3,4, Carol DeMatteo3,5, Geoffrey B Hall4, Nicholas A Bock4, John F Connolly1,4,5,6, and Michael D Noseworthy1,2,5,7,8
1School of Biomedical Engineering, McMaster University, Hamilton, ON, Canada, 2Imaging Research Centre, St. Joseph's Healthcare Hamilton, Hamilton, ON, Canada, 3School of Rehabilitation Sciences, McMaster University, Hamilton, ON, Canada, 4Department of Psychology, Neuroscience & Behaviour, McMaster University, Hamilton, ON, Canada, 5ARiEAL Research Centre, McMaster University, Hamilton, ON, Canada, 6Department of Linguistics, McMaster University, Hamilton, ON, Canada, 7Department of Electrical and Computer Engineering, McMaster University, Hamilton, ON, Canada, 8Department of Radiology, McMaster University, Hamilton, ON, Canada
Decreased FA was significantly correlated with younger age and higher PCSS scores. Increased RD was significantly correlated with younger age and the interaction between time to scan and Post-Concussion Symptom Scale (PCSS) score.
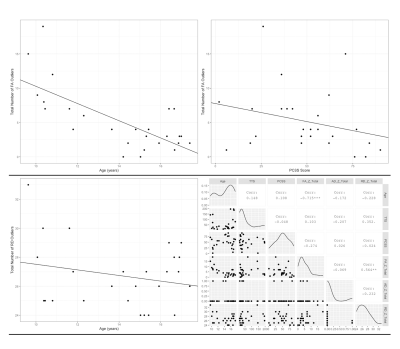
Figure 1. Plots of significant findings between DTI metrics and demographic information. Top left: Total FA injury burden versus Age; Top Right: Total FA injury burden versus PCSS Score; Bottom Left: Total RD injury burden versus Age; Bottom Right: A paired matrix plot indicating the distribution of each metric and the correlation between metrics.
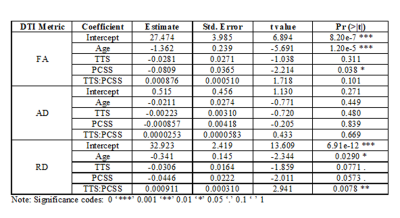
Table 1. Results for the multilinear regression of demographic and DTI metrics.
-
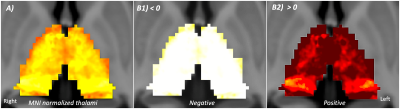
Cerebral perfusion network analysis to understand cognition in old age: a principal component analysis of ASL-MRI
Jodi Karlyn Watt1,2,3, Stefan Pszczolkowski1,2,3, Yue Xing1,2,3, Christopher Tench1,2,3, Dorothee Auer1,2,3, and Alzheimer's Disease Neuroimaging Initiative4
1Division of Clinical Neuroscience, University of Nottingham, Nottingham, United Kingdom, 2Sir Peter Mansfield Imaging Centre, University of Nottingham, Nottingham, United Kingdom, 3NIHR Nottingham Biomedical Research Centre, University of Nottingham, Nottingham, United Kingdom, 4Alzheimer's Disease Neuroimaging Initiative, Los Angeles, CA, United States
The relationship between CBF and tests of global cognition remains unknown. Principal Component Analysis was used to investigate the MoCA/cerebral perfusion relationship, providing preliminary support for a perfusion pattern which partially explains old-age cognitive decline.
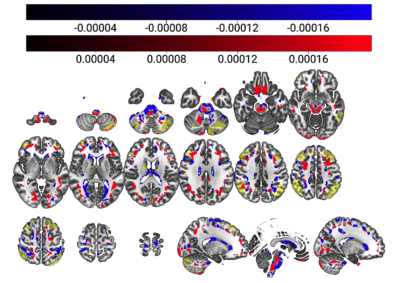
Figure 2: Combined surviving components (components 1, 4 and 42, 98% of r2 retained) overlaid on the MNI152, 2mm brain template. Negative associations with MoCA are depicted in blue, and positive in red, with the ECN map11 in yellow.
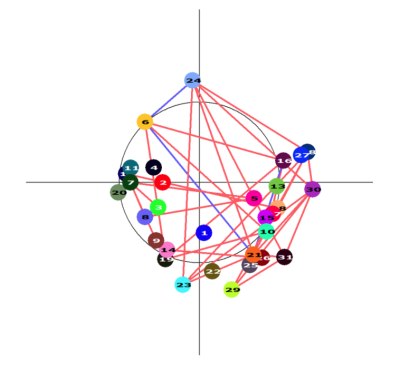
Figure 4: Colour-coded graph depicting the interrelatedness between any pairs of nodes. Positive associations are depicted with red edges, and negative with blue. The circle represents the mid-axial slice of the brain.
-
Altered structural connectivity and impairment of brain network-cognition relationship in obstructive sleep apnea (OSA)
Tasfiya Islam1, Mengting Liu1, Dae Lim Koo2, Ryan Cabeen1, Eunyeon Joo3, and Hosung Kim1
1USC Stevens Neuroimaging and Informatics Institute, Keck School of Medicine of University of Southern California, Los Angeles, CA, United States, 2Department of Neurology, Boramae Medical Center, Seoul National University College of Medicine, Seoul, Korea, Republic of, 33Department of Neurology, Samsung Medical Center, Sungkyunkwan University School of Medicine, Samsung Biomedical Research Institute, Seoul, Korea, Republic of
OSA patients were found to have globally less efficient brain network. In OSA, the higher modularity linked with network segregation and less efficient network may further lead to the failure in coordinating cognitive resources and the impaired visual memory function.
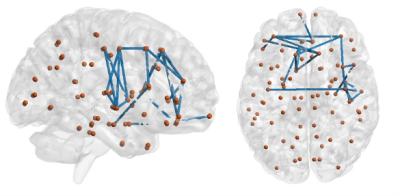
Figure 2: Network based statistics (NBS) under the contrast [-1, 1] for OSA and healthy control group connectivity comparison.
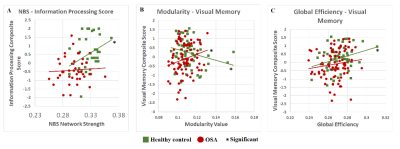
Figure 3: Scatter plot of significant effects found in data collected from behavioral versus brain measure comparison for both healthy and OSA subjects under threshold value of 0.35.
-
QSM detects early alterations of brain venous blood oxygenation in fetuses with complex congenital heart diseases
Cong Sun1, Aocai Yang1, Jiaguang Song2, Minhui Ouyang3, Jinxia Zhu4, Lei Xue5, Hao Huang3,6, and Gunagbin Wang1
1Radiology, Shandong Medical Imaging Research Institute, Cheeloo College of Medicine, Shandong University, Jinan, China, 2Ultrasound, Shandong Provincial Hospital Affiliated to Shandong University, Jinan, China, 3Radiology Research, Children’s Hospital of Philadelphia, Philadelphia, PA, United States, 4MR Collaboration, Healthcare Siemens Ltd., Beijing, China, 5MR Application, Siemens Healthineers Ltd., Jinan, China, 6Radiology, Perelman School of Medicine, University of Pennsylvania, Philadelphia, PA, United States
Fetuses
with various kinds of complex congenital heart disease had higher values of
venous blood oxygen saturation than did normal fetuses of the same gestational
age, as measured with quantitative susceptibility mapping in utero.
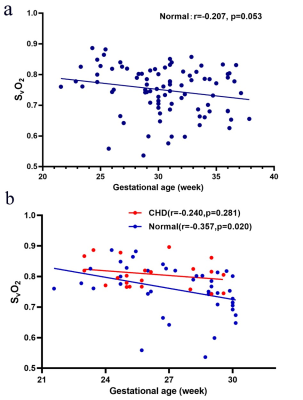
Figure
4a: The
venous blood oxygen saturation (SvO2)
alterations across gestational age (GA) of the normal group: SvO2 =
-0.004223*GA + 0.8783. Figure 4b: SvO2 alterations across gestational age between the
congenital heart disease (CHD) group (SvO2 = -0.00514*GA + 0.942) and
GA-matched normal group (SvO2 =
-0.01205*GA + 1.087) and their corresponding fitting curve. Red circles and red curves represent the CHD group; blue circles and blue curves represent the normal group.
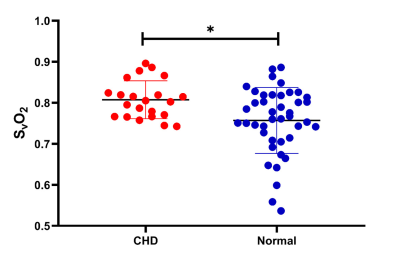
Figure 5: Venous blood oxygen
saturation (SvO2) values in the congenital heart disease (CHD) group and
gestational age (GA)-matched normal group, along with their corresponding mean and 95%
CI SvO2 values. In the analysis of covariance, the SvO2 value showed a significant difference between the CHD (80.8%±4.6%) group and the GA-matched
normal group (75.7%±8.0%) after the effects of GA were excluded (p=0.038).
-
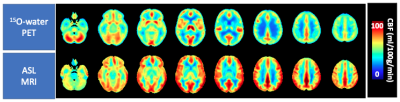
Quantitative cerebral oxygenation mapping by MRI with whole brain coverage compared to PET
Jan Kufer1, Christine Preibisch1,2, Samira Epp1, Jens Goettler1,3, Kilian Weiss4, Mikkel Bo Hansen5, Claus Zimmer1, Kim Mouridsen5, Fahmeed Hyder3, and Stephan Kaczmarz1,3
1Department of Neuroradiology, School of Medicine, Technical University of Munich (TUM), Munich, Germany, 2Department of Neurology, School of Medicine, Technical University of Munich (TUM), Munich, Germany, 3Department of Radiology & Biomedical Imaging (MRRC), Yale University, New Haven, CT, United States, 4Philips Healthcare, Hamburg, Germany, 5Department of Clinical Medicine, Aarhus University, Aarhus, Denmark
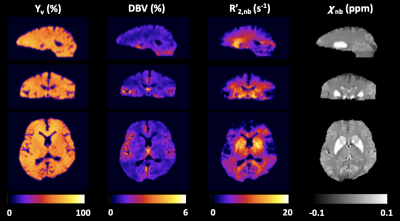
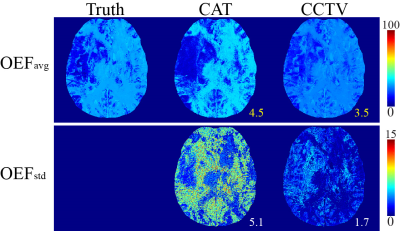
Comparison
of two MRI-based cerebral oxygenation biomarkers OEF from mqBOLD and OEC modelled
from DSC showed good agreement with PET reference data in cortical gray matter in
young healthy volunteers. Some variation between MRI-based OEF and OEC was attributed to different underlying models.
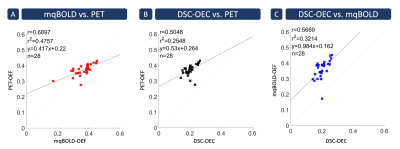
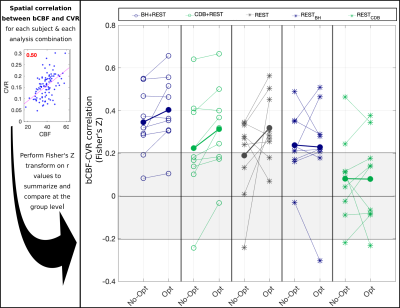
Figure 3: Spatial
correlation across 28 gray matter VOIs. Each cross indicates the mean parameter value in a specific Brodmann
area averaged across subjects. Strongest spatial correlation was found between
PET- and mqBOLD-OEF (A) with r=0.69 (p<0.05). Correlation between PET-OEF
and DSC-OEC (B) was also strong, but slightly weaker with r=0.50 (p<0.05). Similarly,
good correlation was also found between both MRI techniques (C) with r=0.57 (p<0.05).
Note that MRI and PET data were acquired in similar cohorts, but different
subjects.
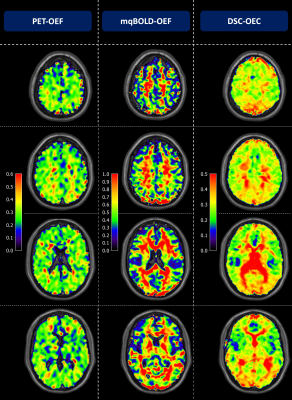
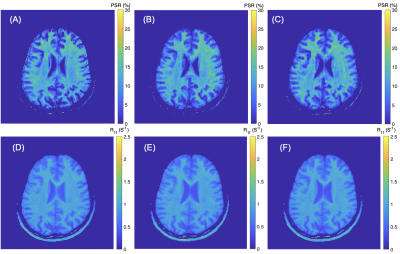
Figure 2: Exemplary PET-OEF, MRI-OEF and MRI-OEC data in
four different slices. PET-OEF
(left column) is quite homogenous across the entire brain, without contrast
between gray (GM) vs. white matter (WM). MRI-based OEF (central column) and OEC
(right column) show some similarity with PET. However, both parameter maps show
an artifactual GM/WM contrast with elevated WM values. While OEF values in GM
seem similar between PET and mqBOLD, OEC values based on the CFIN-model are
generally lower.
-
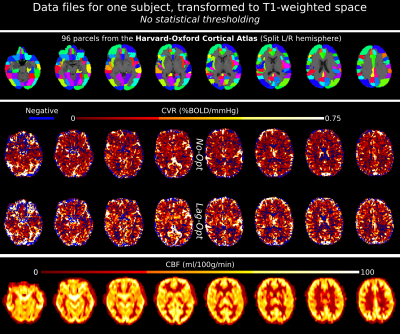
Carbogen-based Cerebrovascular Reserve Using BOLD-based fMRI of Human Brain : tissue, territorial and cortical specificity
Tzu-chen Yeh1,2, Chou-ming Cheng3, and Chi-che Chou3
1Department of Radiology, Taipei Veterans General Hospital, Taipei, Taiwan, 2Institue of Brain Science, National Yang-Ming University, Taipei, Taiwan, 3Department of Medical Research, Taipei Veterans General Hospital, Taipei, Taiwan
A custom-designed system was applied for inhalation of various gas mixtures and air. Independent component analysis was applied to obtain the carbogen response function for mapping of CO2-CVR. And we demonstrated the tissue, territorial and cortical specificities of CO2-CVRof human brain.
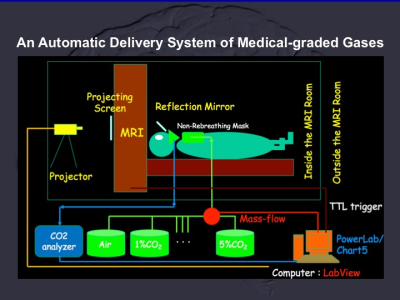
The custom designed automatic delivery system of CO2-CVR included mass flow controllers with medical graded gas mixtures and air, LabView for device control, CO2 analyzer with PoweLab and Chart 5 with synchronization with radiofrequency pulse of MRI.
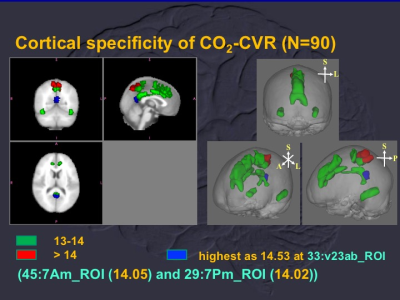
Cortical specificity of CO2-CVR showed highest t values of one-sample t test using carbon response function (see text for details) as 14.53 at ventral portion of Brodmann area 23 (blue). And cortices with CO2-CVR larger than 13 were labelled as green and red for 13 < t values < 14 and t values >14, respectively.
-
Clinical Whole-Brain R2* and Quantitative Susceptibility Maps at 3T – Reproducibility and Parameter Optimization Towards Millimetric 5min Scan
Thomas Troalen1, Arnaud Le Troteur2, Sylviane Confort-Gouny2, Patrick Vioux2, Claire Costes2, Lauriane Pini2, Jean-Philippe Ranjeva2, Maxime Guye2, and Ludovic de Rochefort2
1Siemens Healthcare SAS, Saint-Denis, France, 2CRMBM UMR7339 CNRS Aix-Marseille Université, Marseille, France
This work demonstrates the ability to accelerate
multi gradient echo sequences for a joint R2* and QSM in the brain. Combining this sequence with a state-of-the art automatic
post-processing pipeline, we propose here a standardized whole brain clinical
protocol of 5 minutes.
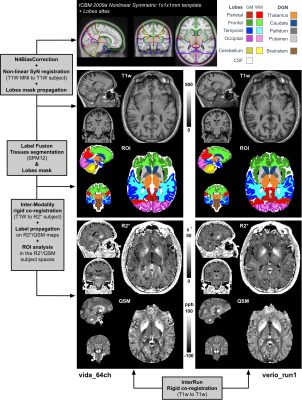
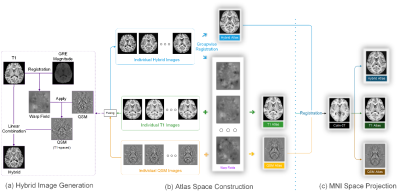
Figure 1: Automatic
processing pipeline: The ICBM 2009a nonlinear symmetric MNI template was non-linearly
registered to the subject’s T1w space (using Vida_64Ch as reference).
Inter/Intra-run
co-registrations were performed (T1wRef-to-T1w, as well as T1w-to-R2*). Tissue
segmentation was achieved using SPM12 software using the default brain
probability maps. Labels were propagated to R2*/QSM space and restricted to
WM/GM tissue types. WM/GM lobes and cerebellum were extracted, as well as four
deep grey nuclei and the brainstem prior ROI analysis on the quantitative maps.
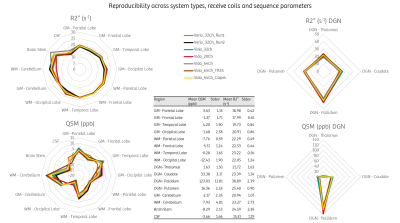
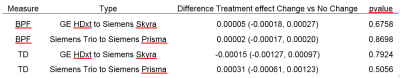
Reproducibility across
MR system types (Verio and Vida), receive head coils (20, 32 and 64 channels)
and sequence parameters. Note that the measured variability on the Vida with
different head coils was not different than the intra-run metric variations on
the Verio system. The signal drop caused by the increased acceleration factor
from 3 to 4 was not reflected in the R2* and QSM estimations, with values in
the same range as the other protocols. The central table reports mean and
standard deviation per segmented region across all measurements.
-
Interhemispheric Functional Connectivity and 18F-fluatmetamol PET differentiate AD, amyloid and non-amyloid Mild cognitive decline
Eva YW Cheung1, Patrick KC Chiu2, YF Shea2, Joseph SK Kwan3, and Henry KF Mak1
1The University of Hong Kong, Hong Kong, Hong Kong, 2Queen Mary Hospital, Hong Kong, Hong Kong, 3Imperial College London, London, United Kingdom
Interhemispheric functional connectivity and 18F-flutametamol PET
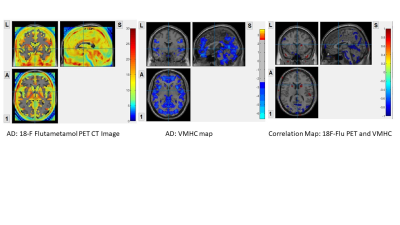
AD
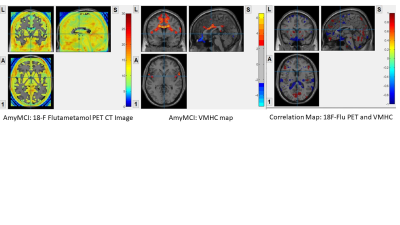
amyMCI
-
Associations of Musical Aptitude with High Angular Resolution Diffusion Imaging (HARDI) derived structural connectivity
Archith Rajan1, Apurva Shah1, Madhura Ingalhalikar1, and Nandini C Singh2
1Symbiosis Centre for Medical Image Analysis, Symbiosis International(Deemed) University, Pune, India, 2Language,Literacy and Music Lab, National Brain Research Centre, Gurgaon, India
-
Prevalence
of inter-hemispheric than intra-hemispheric structural connectivity
that showed positive linear associations with better music perception
abilities.
- Sequential
and not sensory sub-scores showed associations with whole brain
structural connectivity
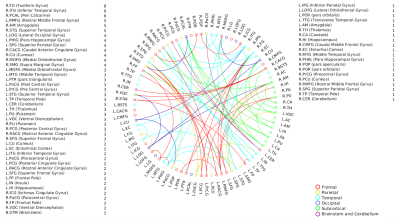
Fig.1
Significant edge list for positive associations with d’-total
scores. The nodes with its total number of connections are also
indicated.
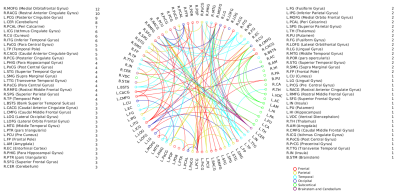
Fig.2
Significant edge list for positive associations with d’s computed
from sequential processing component (comprising Melody, Standard
Rhythm, Embedded Rhythm and Accent). The nodes with its total number of connections are also
indicated.
-
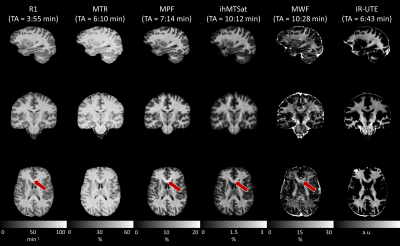
Imaging intracortical structure using navigator-based, motion and B0-corrected T2*-weighted MRI at 7 T
Jiaen Liu1, Peter van Gelderen1, Jacco A. de Zwart1, and Jeff H. Duyn1
1AMRI, LFMI, NINDS, National Institutes of Health, Bethesda, MD, United States
High-resolution T2*-weighted 7 T MRI can be used to delineate intracortical structure owning to its high signal-to-noise and contrast-to-noise ratio. Reliable ultrahigh resolution T2*-weighted MRI can be reliably obtained using a navigator-based sequence with motion and B0 correction.
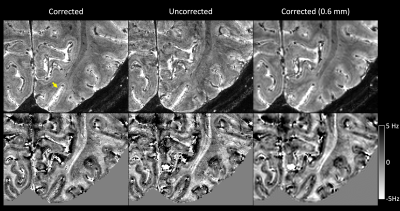
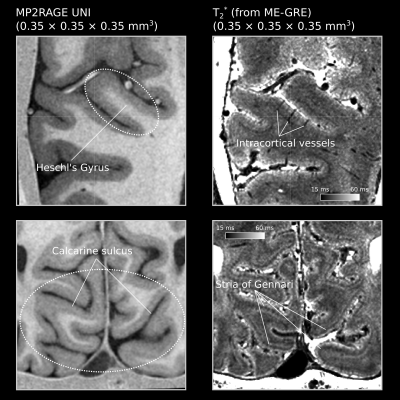
Fig. 1 Top row: magnitude of corrected, uncorrected and lower-resolution corrected (isotropic 0.6 mm) T2*-weighted MRI from one subject. The yellow arrow points to the hypointensive Line of Gennari in the primary visual cortex. Bottom row: the corresponding susceptibility-induced off-resonance frequency maps at 7 T. The Line of Gennari appears as a positive-frequency band (note darker equals more positive).
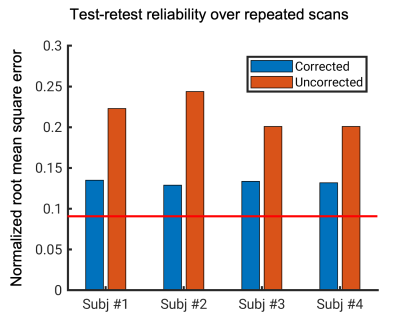
Fig. 2 Normalized root mean square error (NRMSE) between two repeated T2*-weighted scans for each subject. Red line represents the expected NRMSE caused by thermal noise.
-
Detecting normal Fetal brain development with T1Mapping Imaging Technique
Yan-Chao Liu1, Bo-Hao Zhang2, De-Sheng Xuan2, Xue-Yuan Wang2, Kai-Yu Wang3, Xin Zhao2, and Xiao-An Zhang2
1Department of Radiology, The Third Affiliated Hospital of Zhengzhou University, Zhengzhou, China, 2Department of Radiology, the Third Affiliated Hospital of Zhengzhou University, Zhengzhou, 450052, China, Zhengzhou, China, 3MR Research China, GE Healthcare, Beijing 100000, PR China, Beijing, China
Multiple MRI quantitative techniques have
confirmed that postnatal brain development is an ongoing maturation process. Fetal brain development is an ongoing
process. In this work, T1Mapping allowed quantitative
assessment of fetal brain development.
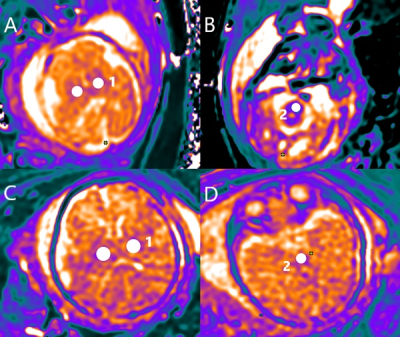
T1Mapping maps in
the fetal brain (A–D). Examples of ROIs for DTI are shown in white color (1–2).
The area of the ROI was adjusted appropriately according to the gestational
week and anatomical structures. Regions of interest: 1,
Thalamus; 2, Corticospinal fibers. A and B are T1Mapping
images of the same fetus; And gestation ages was 28 week. C and D are T1Mapping images of the same
fetus; And gestation ages was 36 week.
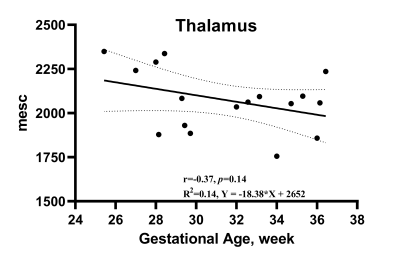
T1 relaxation time trajectories in Thalamus for 17 subjects. T1 had good correlation with gestational age. A regression line is shown along with 95% confidence intervals (dotted lines).