-
Longitudinal Change in Quantitative Magnetic Resonance Imaging Biomarkers in Pediatric Patients with Autoimmune Liver Disease
Neeraja Mahalingam1, Andrew Trout2,3,4, Deep Gandhi1, Ruchi Singh5,6, Alexander Miethke5,6, and Jonathan Dillman2,3,5
1Imaging Research Center, Cincinnati Children's Hospital Medical Center, Cincinnati, OH, United States, 2Department of Radiology, Cincinnati Children's Hospital Medical Center, Cincinnati, OH, United States, 3Department of Radiology, University of Cincinnati College of Medicine, Cincinnati, OH, United States, 4Department of Pediatrics, University of Cincinnati College of Medicine, Cincinnati, OH, United States, 5Center for Autoimmune Liver Disease, Cincinnati Children's Hospital Medical Center, Cincinnati, OH, United States, 6Division of Gastroenterology, Hepatology, and Nutrition, Cincinnati Children's Hospital Medical Center, Cincinnati, OH, United States
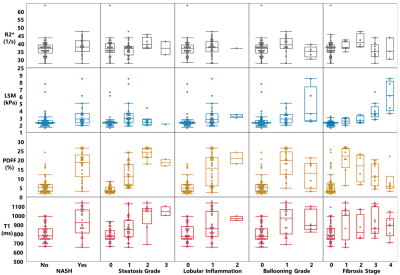
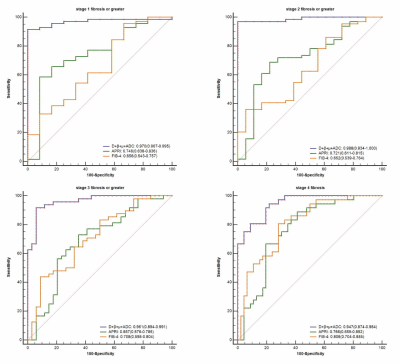
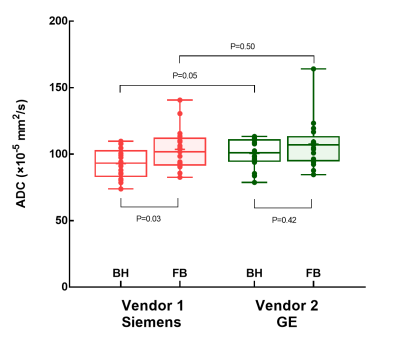
One-way ANOVA (mixed model) testing showed no significant differences in
ROI-based and whole liver cT1 or MRE-derived liver and spleen stiffness measurements
over a 24 month period in pediatric AILD, although near-significant trends were
observed.
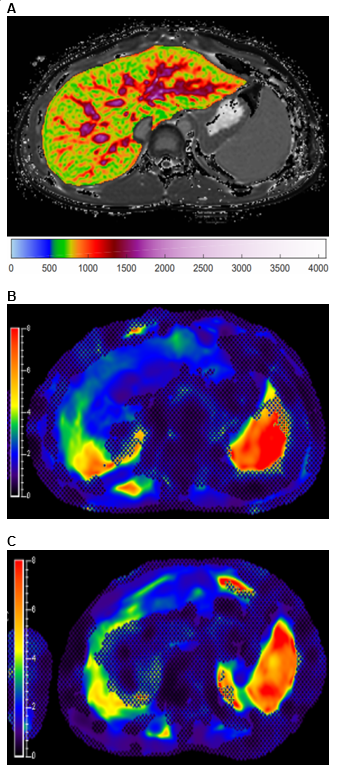
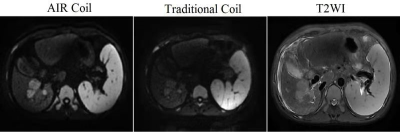
Figure 1: 13-year-old boy with autoimmune sclerosing cholangitis. A) Iron-corrected T1 (cT1) map of the
liver. B) MR elastogram of the liver
(passive driver placed over right upper quadrant). C) MR elastogram of the spleen (passive driver placed over left
flank).
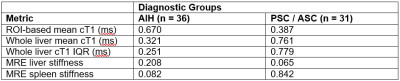
Figure 2: One-way ANOVA (mixed model) results to determine statistical differences
in measurements of interest between baseline, year 1, and year 2 exams for AIH
and PSC / ASC cohorts. P-values reported. AIH: autoimmune hepatitis; PSC:
primary sclerosing cholangitis; ASC: autoimmune sclerosing cholangitis; ROI:
region-of-interest; cT1: iron corrected (T2*) – T1 mapping; MRE:
magnetic resonance elastography.
-
MRI-based quantitation of liver fat fraction does not predict the hypertrophy rate in patients with colorectal liver metastases undergoing PVE
Lea Hitpass1, Paul Felix Sieben1, Vanessa Raaff1, Philipp Bruners1, Christiane K. Kuhl1, and Alexandra Barabasch1
1Department of Diagnostic and Interventional Radiology, RWTH Aachen University Hospital, Aachen, Germany
No correlation between MRI-based liver fat fraction and hypertrophy rate oft the liver remnant after PVE in patients with colorectal liver metastases
Loose correlation between patients age and weekly kinetic growth rate after PVE
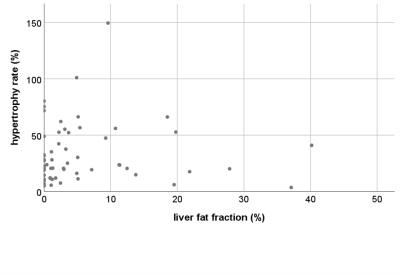
No correlation between liver fat fraction and hypertrophy rate after PVE
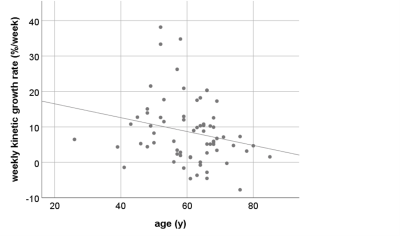
Loose inverse correlation between age and weekly kinetic growth rate R = -0,24 (p=0,04)
-
Hepatocellular Adenoma: Radiology-Pathology Subtype Associations with Hepatobiliary Phase MRI
Alix C Hopp1, Carolyn Mead-Harvey2, and Alvin C Silva1
1Radiology, Mayo Clinic Arizona, Phoenix, AZ, United States, 2Mayo Clinic Arizona, Phoenix, AZ, United States
Retrospective analysis of gadoxetic acid-enhanced MRI of patients with pathologic diagnosis of hepatic adenoma demonstrates that up to 18% can demonstrate iso-/hyperintensity in the hepatobiliary phase, more likely heterogeneous, with the highest prevalence among the β-catenin subtype.
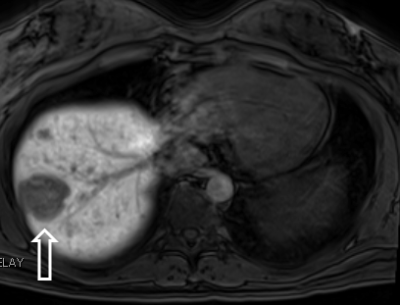
Example of classic predominantly
hypointense HBP of a I-HCA
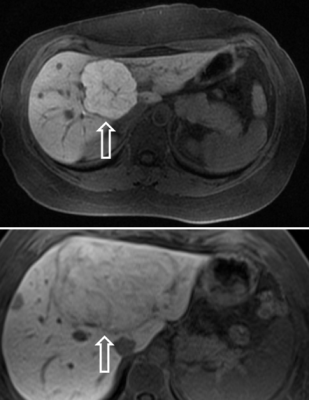
Examples of atypical homogeneously hyperintense HBP of I-HCA and homogeneously isointense HBP of I-HCA
-
Acquisition of High-resolution Time Intensity Curves Using a Deep Learning Reconstruction for Dynamic Contrast Enhanced MRI
Hideaki Kutsuna1, Hideki Ota2,3, Yoshimori Kassai4, Hidenori Takeshima5, Tatsuo Nagasaka6, Takashi Nishina7, Yoshiaki Morita3, and Kei Takase3,8
1MRI Systems Development Department, Canon Medical Systems Corporation, Kanagawa, Japan, 2Department of Advanced MRI Collaboration Research, Tohoku University Graduate School of Medicine, Miyagi, Japan, 3Department of Diagnostic Radiology, Tohoku University Hospital, Miyagi, Japan, 4CT-MR Solution Planning Department, Canon Medical Systems Corporation, Tochigi, Japan, 5Advanced Technology Research Department, Research and Development Center, Canon Medical Systems Corporation, Kanagawa, Japan, 6Department of Radiological Technology, Tohoku University Hospital, Miyagi, Japan, 7MRI Sales Department, Canon Medical Systems Corporation, Miyagi, Japan, 8Department of Diagnostic Radiology, Tohoku University Graduate School of Medicine, Miyagi, Japan
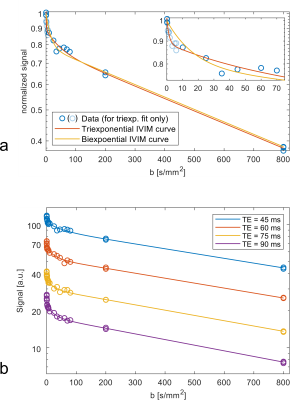
This presentation shows a new result for acquiring improved
time intensity curves of dynamic contrast enhanced MRI. A method based on
convolutional neural network was shown as a better method than a method based
on compressed sensing.
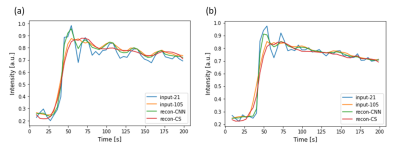
Time
intensity curves obtained from the two volunteers.
(a) TIC
from the first volunteer.
(b) TIC
from the second volunteer.
Blue,
Yellow, Green, Red lines represent TICs from input-21, input-105, recon-CNN and
recon-CS, respectively.
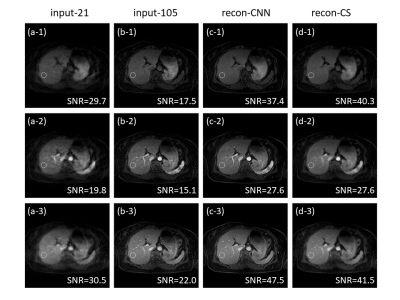
Reconstructed
images from the first test volunteer.
(a) A
subset of the input images with 21 spoke per frame (input-21.)
(b) A
subset of the input images with 105 spoke per frame (input-105.)
(c) Output
images from the CNN (recon-CNN.)
(d) Reconstructed
images with the CS algorithm (recon-CS.)
Rows
of the image matrix represent different temporal frame.
Dashed circles indicate the regions that the SNRs
are calculated.
-
Comparison of MRI and CT for Prediction of Microvascular Invasion in Solitary Hepatocellular Carcinoma: Which Imaging Modality Is Better?
Xiang-Pan Meng1, Yuan-Cheng Wang1, and Shenghong Ju1
1Radiology, Zhongda Hospital, Medical School of Southeast University, Nanjing, China
CT
and MRI had comparable predictive performance for MVI in solitary HCC. Only the radiomics signature at
MRI had significant added value for
MVI prediction on HCC > 2 and ≤ 5 cm.
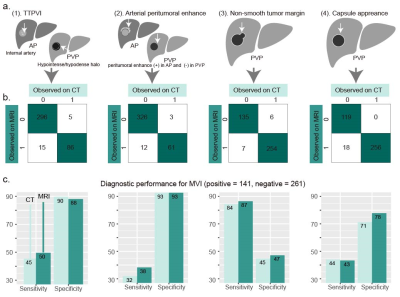
(a) Schematic of two-trait predictor of
venous invasion (TTPVI), arterial peritumoral enhancement, non-smooth tumor
margin, and capsule appearance. (b) Frequencies of presence and absence
of the four features at CT and MRI. The number of cases showing TTPVI, arterial
peritumoral enhancement, non-smooth tumor margin and capsule appearance at MRI
but not at CT was 15, 12, 7, 18, respectively; Number of cases presenting the
four features at CT but not at MRI were 5, 3, 6, and 0, respectively. (c)
Sensitivity and specificity of the four features for MVI diagnosis at CT or
MRI.
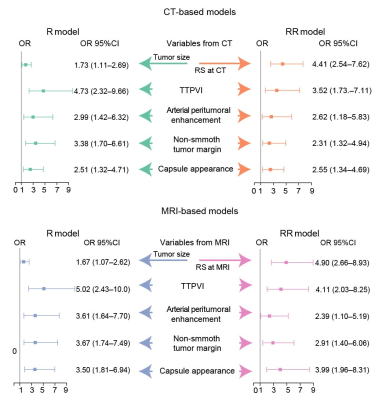
Odds ratios of each
variable contributing to the R and RR models at CT or MRI. R model =
Radiographic model; RR model = radiographic-radiomics model; RS = radiomics
signature; TTPVI = two-trait predictor of venous invasion.
-
MR Elastography-based Shear Strain Mapping for Assessment of Microvascular Invasion in Hepatocellular Carcinoma
Bing Hu1, Ziying Yin2, Mengsi Li1, Ying Deng1, Sichi Kuang1, Jun Chen2, Linqi Zhang1, Meng Yin2, Kevin J. Glaser2, Richard L. Ehman2, and Jin Wang1
1Radiology, The Third Affiliated Hospital of Sun Yat-Sen University, Guangzhou, China, 2Radiology, Mayo Clinic, Rochester, MN, United States
MRE-based
shear strain mapping is a promising technique for non-invasively predicting the
presence of microvascular invasion in patients with HCC.
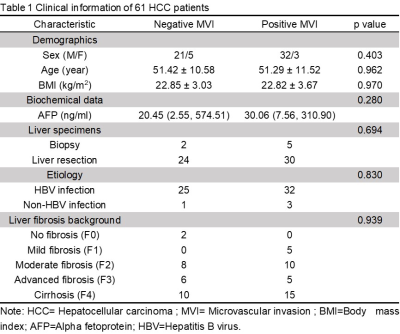
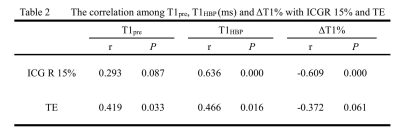
Table 1
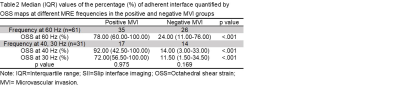
Table 2
-
A nomogram based on Gd-EOB-DTPA-enhanced MRI to predict early recurrence of hepatocellular carcinoma after curative resection
Meng Yan1, Xinming Li1, Zhijun Geng2, Zhendong Qi1, Yingjie Mei3, and Xianyue Quan1
1Department of Radiology, Zhujiang Hospital, Southern Medical University, Guangzhou, China, 2Department of Medical Imaging,Sun Yat-sen University Cancer Center, Guangzhou, China, 3Philips Healthcare, Guangzhou, China
This study developed and validates of a nomogram based on Gd-EOB-DTPA-enhanced MRI to predict early
recurrence of hepatocellular carcinoma after curative resection.
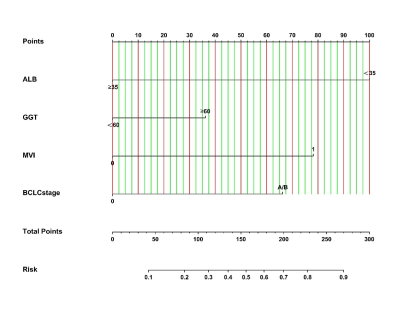
Figure
1. Nomogram, including
ALB, GGT, MVI (microvascular invasion), and BCLC stage, to predict early
recurrence (ER) in patients with hepatocellular carcinoma after curative
resection. The nomogram can help obtain the probability of ER (≤2
years) by adding up the points identified on the points scale for each
variable.
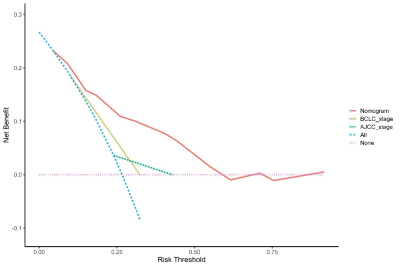
Figure
4. Decision curve
analysis (DCA) for predicting early recurrence. Pink line: All patients dead. Blue
line: No patient dead. Red dashed line: Model of the nomogram. Yellow line: Model
of the BCLC stage. Green line: Model of the AJCC-TNM stage (eighth edition).
-
Correlation of functional MRI with changes in tumor microenvironment following sorafenib and immunotherapy in hepatocellular carcinoma
Yanqiao Ren1, Jingjie Yan2, Lian Yang1, Qingjia Bao3, Chaoyang Liu3, and Chuansheng Zheng1
1Department of Radiology, Union Hospital, Tongji Medical College, Huazhong University of Science and Technology, Wuhan 430022, China, Wuhan, China, 2Wuhan National Laboratory for Optoelectronics, Huazhong University of Science and Technology, Wuhan, 430074, China., Wuhan, China, 3State Key Laboratory of Magnetic Resonance and Atomic and Molecular Physics, Wuhan Institute of Physics and Mathmatics, Innovation Academy for Precision Measurement Science and Technology, 430071Wuhan, China, Wuhan, China
Correlation of functional MRI
with changes in tumor microenvironment following sorafenib and immunotherapy in
hepatocellular carcinoma
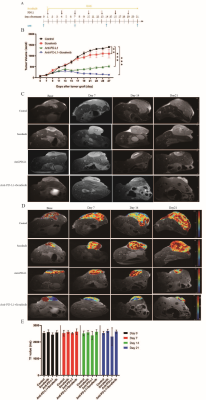
Combined administration of anti-PD-L1 antibody and sorafenib shows enhanced anti-tumor
effects. A: Flow chart of in vivo experiments. B: Response of the subcutaneous tumors to the indicated treatments. C: T2WI of four groups of
subcutaneous tumors before and at different time points after treatment. D: Pseudocolour
images (T1 mapping) of four groups of subcutaneous tumors before and at
different time points after treatment. E: T1 values of four groups of
subcutaneous tumors before and at different time points after treatment (P>0.05). *p < 0.05, **p < 0.01, ***p<0.001.
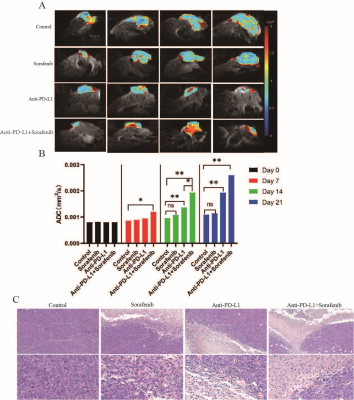
Water ADC maps of representative treated groups
obtained before therapy and at different times post-therapy. A, B: After 7 days
of treatment, the ADC value of the combined treatment group increased
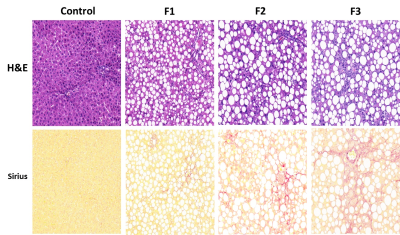
significantly compared with the control group.C: Hematoxylin and eosin
(H&E)-stained histologic sections of representative treated groups obtained
at 21d post-therapy. Data are presented as means ± SEM. *p < 0.05, **p < 0.01, ***p<0.001.
-
Dynamic contrast enhanced imaging (DCE-MRI) combined with T1 and T2 mapping for differentiation between HCC and HM
Lili Fan1, Ailian Liu1, Jiazheng Wang2, Liangjie Lin2, Lihua Chen1, Qingwei Song1, Renwang Pu1, Ying Zhao1, Tao Lin1, and Xue Ren1
1The First Affiliated Hospital of Dalian Medical University, Dalian, China, 2Philips Healthcare, Beijing, China
Dynamic contrast enhanced imaging (DCE-MRI) combined with T1 and T2 mapping showed a high efficacy to distinguish hepatocellular carcinoma (HCC) from hepatic metastasis (HM) (AUC: 0.936; sensitivity: 81.8%; specificity: 100%).
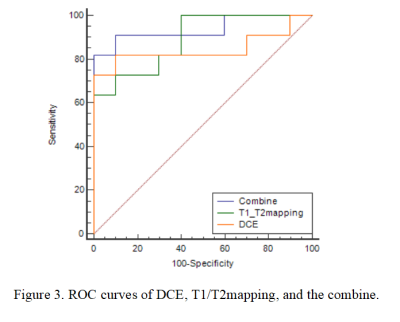
Figure 3. ROC curves of DCE, T1/T2mapping, and the combine.
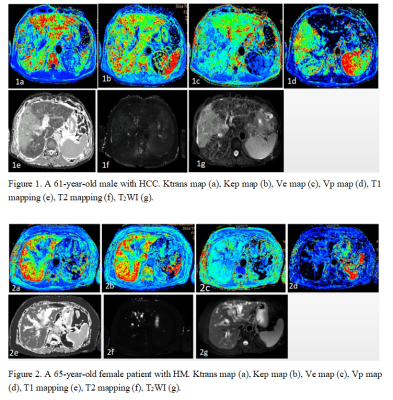
Figure 1. A 61-year-old male with HCC. Ktrans map (a), Kep map (b), Ve map (c), Vp map (d), T1 mapping (e), T2 mapping (f), T2WI (g).
Figure 2. A 65-year-old female patient with HM. Ktrans map (a), Kep map (b), Ve map (c), Vp map (d), T1 mapping (e), T2 mapping (f), T2WI (g).
-
3D Dual Flip Angle (DFA) T1 mapping at 3T for focal liver lesions: comparison with diffusion-weighted imaging
Fei Wang1, Juan Zhu1, Yupei Zhang1, and Mengxiao Liu2
1Anqing municipal hospital, Anqing, China, 2MR scientific Marketing, Diagnostic Imaging, Siemens Healthcare Ltd, Shanghai, China
Three-dimensional
double flip angle T1 mapping is a reliable and accurate technique for diagnosing and evaluation benign and malignant focal liver lesions. The Native
T1 value was superior to DWI in the identification of liver cysts and
hemangiomas.
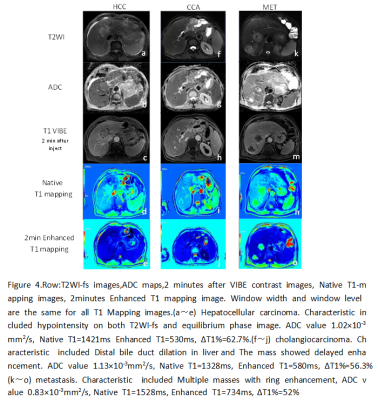
Figure 5
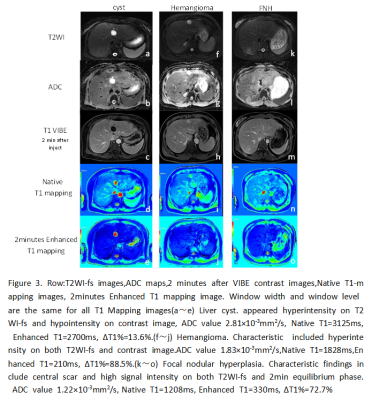
Figure 4
-
Data-driven modification of the LI-RADS major feature system: toward better sensitivity and simplicity
Hanyu Jiang1,2, Bin Song1, Yun Qin1, Yi Wei1, Kyle J. Lafata2,3, Meghana Konanur2, Matthew DF McInnes4,5, and Mustafa R. Bashir2,6,7
1Radiology, West China Hospital, Sichuan University, Chengdu, China, 2Radiology, Duke University Medical Center, Durham, NC, United States, 3Radiation Oncology, Duke University School of Medicine, Durham, NC, United States, 4Radiology, University of Ottawa, Ottawa, ON, Canada, 5Epidemiology, University of Ottawa, Ottawa, ON, Canada, 6Center for Advanced Magnetic Resonance in Medicine, Duke University Medical Center, Durham, NC, United States, 7Division of Gastroenterology, Department of Medicine, Duke University Medical Center, Durham, NC, United States
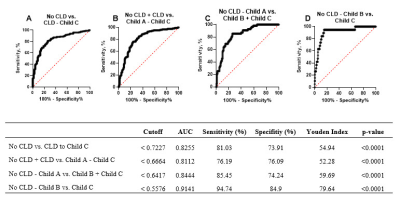
Developed based on hard data, rLI-RADS
demonstrated superior simplicity, sensitivity, and accuracy for HCC than v2018
LI-RADS without substantial loss of specificity; hence should be the preferred major
feature diagnostic system for HCC in at-risk patients.
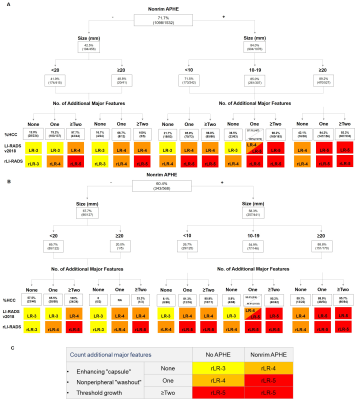
Decision tree
illustrating major feature combinations and HCC proportions(%HCC)/counts
according to LI-RADS v2018 in the training (A) and testing (B) sets. Data were
computed based on sum interpretations of the three readers while adjusted with
a generalized estimating equation model. rLI-RADS diagnostic table based on rLR
3-5 category definitions derived from the decision tree (C).
LI-RADS, Liver
Imaging Reporting and Data System; rLI-RADS, revised Liver Imaging Reporting
and Data System.
-
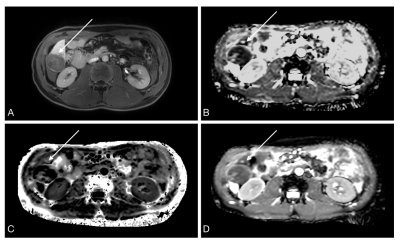
Comparing dedicated 2D-GRE to 3D-SPGR Dixon in- and opposed-phase imaging for the detection of hepatic intralesional fat or iron.
Bradley C Monteforte1, Ali Agely1, Manoj Mathew1, Pejman Ghanouni1, and Ryan L Brunsing1
1Radiology, Stanford University, Palo Alto, CA, United States
We found no difference in performance between dedicated 2D-GRE and 3D-SPGR Dixon sequences for the detection of fat or iron content in liver lesions.
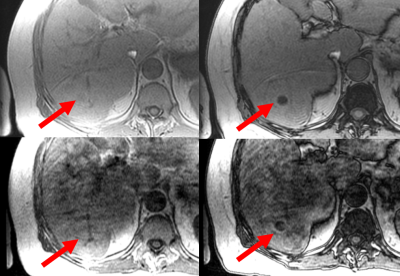
Figure 2. In-phase 2D-GRE
(top left), opposed-phase 2D-GRE (top right), in-phase 3D-SPGR (bottom left),
opposed-phase 3D-SPGR (bottom right). The right hepatic lobe lesion
(arrows) demonstrates signal loss on opposed-phase images with both sequences, as rated
by both readers. Respiratory motion was scored mild and severe by both readers for the 2D-GRE and 3D-SPGR images, respectively. Of note, each pair of IOP
images was assessed at different time points within the full slate of their
respective sequences.
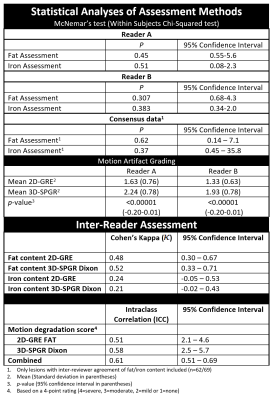
Figure 5. Statistical analyses of assessment methods.
-
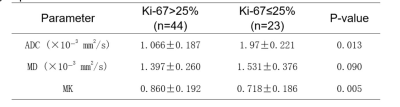
Application of APT and DKI in predicting the postoperative liver decompensation and recurrence of early HCC after TACE treatment
Cai ming xi1, Han dong ming1, and Wang kai yu2
1The First Affiliated Hospital of Xinxiang Medical University, Xinxiang, China, 2GE Healthcare, MR Research China, Beijing, China
The MTRasym value of APT and MK value of DKI can be used to predict the postoperative hepatic insufficiency and recurrence of early stage hepatocellular carcinoma treated with TACE.
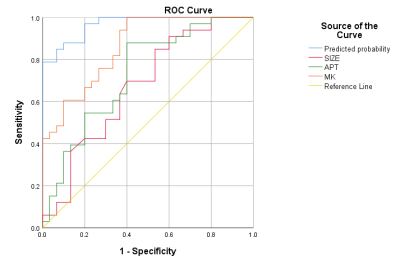
Figure 4. ROC curve of the values for predicting the recurrence of early stage of HCC treated by TACE. The area under curve of tumor size, MK, MTRasym and the prediction model of tumor size+MK+MTRasym were 0.673, 0.861, 0.728 and 0.967, respectively.
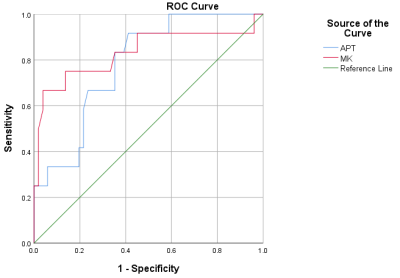
Figure 3. ROC curve of the values for predicting the postoperative hepatic insufficiency of HCC treated by TACE. The area under curve of MTRasym was 0.783 and the MKvalue was 0.811.
-
Contrast-enhanced MRI radiomics for predicting therapeutic response to transcatheter arterial chemoembolization in HCC
Ying Zhao1, Ailian Liu1, Tao Lin1, Qingwei Song1, Yu Yao2,3, Han Wen2,3, Xin Li4, Yan Guo4, and Tingfan Wu4
1The First Affiliated Hospital of Dalian Medical University, Dalian, China, 2Chengdu Institute of Computer Application, Chinese Academy of Sciences, Chengdu, China, 3University of Chinese Academy of Sciences, Beijing, China, 4GE Healthcare (China), ShangHai, China
This study showed
that contrast-enhanced MRI radiomics was capable to predict therapeutic response
in hepatocellular carcinoma treated with transcatheter arterial
chemoembolization, which will provide some guidance for treatment decisions.
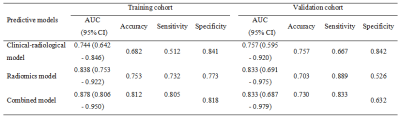
Table
1. Discriminative performance of
different predictive models in the training and validation cohorts
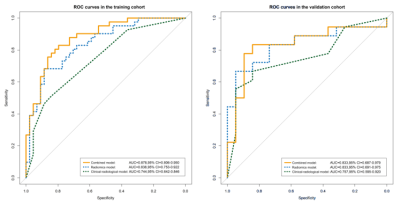
Figure 1. ROC curves for the radiomics model,
clinical-radiological model, and combined model in the training cohort (a) and
validation cohort (b).
-
Accelerated Radial Turbo-Spin-Echo Sequence for Free-Breathing Abdominal T2 Mapping
Fei Han1 and Vibhas Deshpande2
1US MR R&D, Siemens Medical Solutions, USA, Los Angeles, CA, United States, 2US MR R&D, Siemens Medical Solutions, USA, Austin, TX, United States
The proposed acceleration strategy can
potentially reduce the scan time of Radial-TSE T2 mapping by half without
noticeable loss of image quality and quantification accuracy. The shortened
scan could improve the clinical applicability of free-breathing abdominal
T2 quantitative imaging.
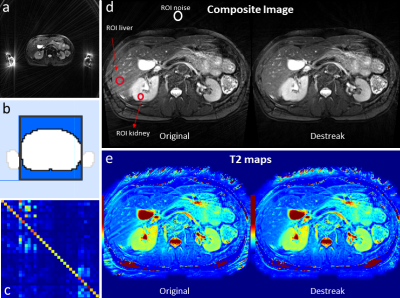
Figure 1. In rTSE imaging, hyperintense? signals originating from
outside the imaging FOV could propagate into the imaging FOV, causing streaking
artifacts (a). In the proposed method, a mask was first generated to cover the
imaging object within the imaging FOV (b). A coil-mixing matrix was then
calculated (c), which is used to process the k-space data before
reconstruction. The streaking artifacts in both the composite images and the T2
maps could be effectively removed by the coil-mixing de-streak method (d,e).
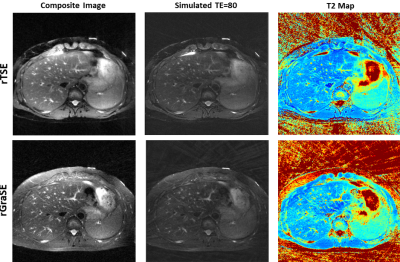
Figure 4. The accelerated rGraSE acquisition offers
comparable image quality and T2 maps as the rTSE but takes half of the time to
acquire.
-
Comparison analysis of IVIM and 4D flow-MRI in patients with liver cirrhosis
Mengting Hu1, Nan Wang1, Ailian Liu1, Qingwei Song1, Renwang Pu1, Lihua Chen1, Jiazheng Wang2, and Zhiwei Shen2
1The First Affiliated Hospital of Dalian Medical University, Dalian, China, 2Philips Healthcare, Dalian, China
In this study, we evaluated the correlation between IVIM and portal vein 4D
flow-MRI in patients with liver cirrhosis. sADC were negatively correlated with
the proximal Flow rate. D value were negatively correlated with the middle Flow.
D* value was positively correlated with the middle Flow and proximal Flow rate.
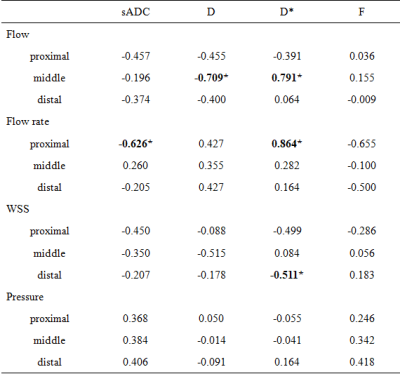
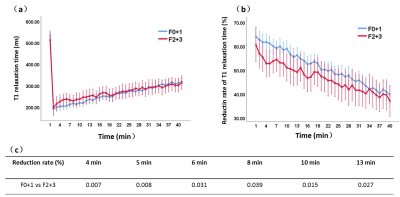
Table2
Correlation between quantitative parameters of IVIM and 4D flow
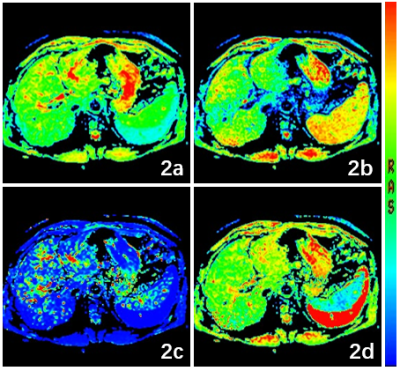
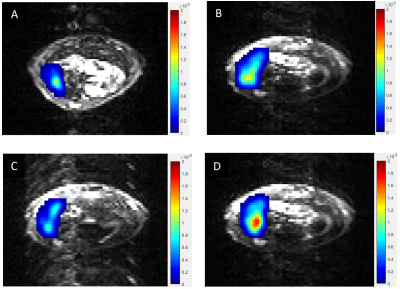
Figure
2 a 65-year-old man with liver cirrhosis.
2a-2d Quantitative parameter (sADC, F, D, D*) mapping of IVM.
-
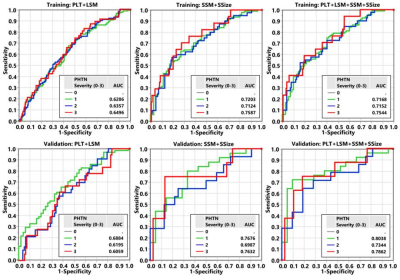
Noninvasive Diagnosis of Portal Hypertension and Screening Varices with 4D Flow MRI: A Pilot Study
Jiachen Ji1, Changchun Liu2, Yunduo Li1, Mingzhu Fu1, Jinghui Dong2, Jianming Cai2, Chunsheng Chi3, Bo Jin3, Wen Shen4, Xiaolong Qi5, and Rui Li1
1Center for Biomedical Imaging Research, Department of Biomedical Engineering, Tsinghua University, Beijing, China, 2Department of Radiology, The Fifth Medical Centre of Chinese PLA General Hospital, Beijing, China, Beijing, China, 3First Liver Cirrhosis Diagnosis and Treatment Center, The Fifth Medical Center of Chinese PLA General Hospital, Beijing, China, Beijing, China, 4Department of Radiology, First Center Hospital of Tianjin, Tianjin, China, Tianjin, China, 5CHESS Center, Institute of Portal Hypertension, The First Hospital of Lanzhou University, Lanzhou, China, Lanzhou, China
In
this study, we identified the reproducibility of the processing and quantifying
procedure of 4D Flow MRI, discovered hemodynamic difference between portal
hypertension (PH) patients and volunteers, and utilized 4D Flow MRI to help diagnose
PH and evaluate the risk of variceal bleeding.
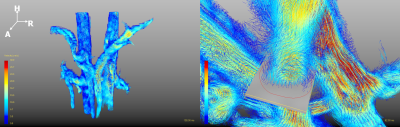
Figure 1. Visualization of the Blood Flow (left)
and the Plane/Contour Used for the Quantification of the Blood Flow (right)
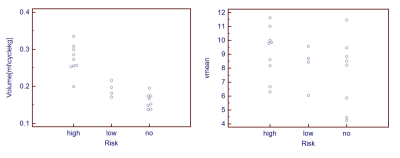
Figure 3. Using Hemodynamic Parameters to
Help Stratify the Risk of Variceal Bleeding: Normalized Flowcyc (left)
and Vavg (right)
-
Influence of portal vein occlusion on portal flow and liver elasticity in an animal model
Simon Chatelin1, Raoul Pop2,3, Céline Giraudeau2, Khalid Ambarki4, Ning Jin5, François Séverac1,6, Elodie Breton1, and Jonathan Vappou1
1ICube, UMR 7357 CNRS, University of Strasbourg, Strasbourg, France, 2IHU-Strasbourg, Institute of image-guided surgery, Strasbourg, France, 3Interventional Neuroradiology Department, University Hospitals of Strasbourg, Strasbourg, France, 4Siemens Healthcare SAS, Saint Denis, France, 5Siemens Medical Solutions USA, Inc., Chicago, IL, United States, 6Public Healthcare Department, University Hospitals Strasbourg, Strasbourg, France
By coupling 4D-flow MRI and MR-Elastography,
this study investigates the extent to which a portal occlusion due to portal
vein thrombosis may attenuate the increase in stiffness due to moderate
fibrosis and potentially lead to false-negative diagnosis using elastography.
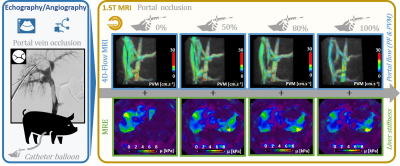
Figure 1. Graphical abstract of the experimental protocol.
Portal occlusion induced by portal vein thrombosis were modeled by successive
inflations of a balloon catheter in the portal vein of four pigs. Portal peak
flow (PF), peak velocity magnitude (PVM) and liver stiffness µ were then
measured using 4D-Flow MRI and magnetic resonance elastography (MRE) for
successive inflation states.
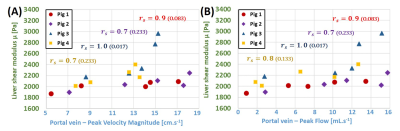
Figure 2. Results showed a
dependence of liver’s shear modulus with portal PVM (A) and PF (B). The
reduction of the portal venous blood flow resulted in a decrease of liver
stiffness. Consequently, portal occlusion implied by portal vein thrombosis may
attenuate the increase in stiffness due to moderate fibrosis and lead to
false-negative diagnosis with elastography. Spearman’s rs rank
correlation coefficients close to 1 indicate individual monotonic relationships
(p-values are indicated).
-
Microvascular Invasion has no Independent Effect on Recurrence in Small Hepatocellular Carcinoma: A Propensity Score Matching Analysis
Huan-Huan Chong1,2, Pei-Yun Zhou3,4, Chun Yang2, and Meng-Su Zeng1,2,5
1Shanghai Institute of Medical Imaging, Shanghai, China, 2Department of Radiology, Zhongshan Hospital, Fudan University, Shanghai, China, 3Department of Liver Surgery, Liver Cancer Institute, Zhongshan Hospital, Fudan University, Shanghai, China, 4Key Laboratory of Carcinogenesis and Cancer Invasion of Ministry of Education, Shanghai, China, 5Department of Medical Imaging, Shanghai Medical College, Fudan University, Shanghai, China
Although MVI independently impaired RFS before balancing the confounder — tumor size, it was ultimately identified as a potential but not an independent risk factor for recurrence in sHCC patients after PSM.
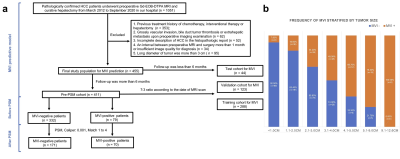
Figure 1. Flowchart of the study population. (a) the workflow of our study population before and after propensity score matching (PSM); (b) the frequency of MVI stratified by tumor size.
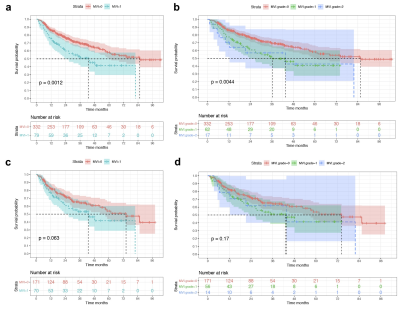
Figure 2. The Kaplan-Meier curves in terms of MVI statuses and grades. (a) and (b) were stratified by MVI statuses and grades in the Pre-PSM subgroup, respectively; (c) and (d) were stratified by MVI statuses and grades in the Post-PSM subgroup , respectively.