-
Feasibility of Free-Breathing Non-contrast Magnetic Resonance Pulmonary Angiography
Jia Liu1, Kai Zhao1, Wei Li1, Zhongxu Bi1, Jinxia Zhu2, Xiaoye Wang3, and Jianxing Qiu1
1Peking University First Hospital, Beijing, China, 2MR Collaboration, Siemens Healthcare Ltd, Beijing, China, 3MR APP, Siemens Healthcare Ltd, Beijing, China
Non-contrast, free-breathing MR pulmonary angiography (MRPA) demonstrates acceptable image quality in healthy volunteers and may be a viable clinical alternative for clinical diagnosis of pulmonary embolism.
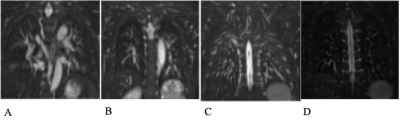
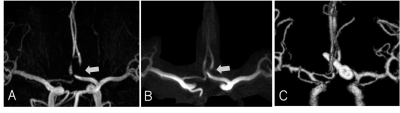
Figure 1. Coronal limited maximum intensity projection images for the different total image quality scores: 2 (A);3 (B);4 (C);5 (D).
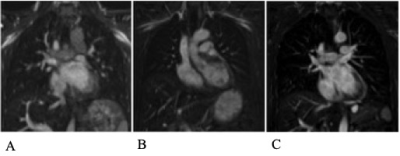
Figure 2.Coronal limited maximum intensity projection images for the different main, right, and left pulmonary arterial trunkscores:2 (A);3 (B);4 (C).
-
MRI for evaluating compliance of aortic graft in a rat model and comparison to native aorta
El-Sayed H Ibrahim1, Xiaolong Wang1, and Bo Wang1
1Medical College of Wisconsin, Milwaukee, WI, United States
This
study showed that the developed graft has biomechanical characteristics similar
to those in native aorta and normal rat, which may represent a potential avenue to construct a
flexible vascular graft that matches the patient-specific dimension.
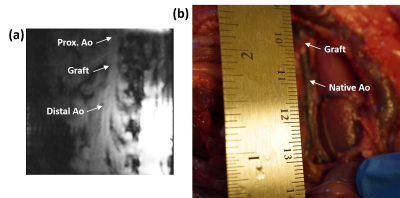
Figure 1. Coronal image showing native aorta and graft region, as well as
corresponding picture. The figure also shows locations where cross-sectional
phase-encoding images were acquired.
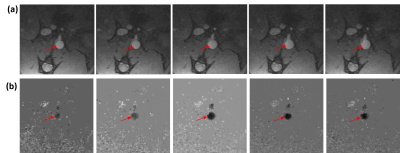
Figure 2. (a) Magnitude images showing a cross-sectional area in the graft region
(arrows), which grows with time during systole. (b) Velocity-encoded
phase-contrast images showing a cross-sectional area in the graft region
(arrows), where flow increases (blacker region) during early systole.
-
Turbulences in a one bifurcation 4mm diameter phantom after inflating a balloon catheter: a 4D flow/cine phase invitro study at systemic pressure.
Cyril Tous, PhD1, Ivan Dimov1, Ning Li, PhD1, Simon Lessard, PhD1, An Tang, MD, MSc1,2, Samuel Kadoury, PhD1,3, and Gilles Soulez, MD,MSc1,2
1Radiology, Centre de recherche du Centre hospitalier de l’Université de Montréal, Montreal, QC, Canada, 2Radiology, Université de Montréal, Montréal, QC, Canada, 3Polytechnique Montréal, Montréal, QC, Canada
Turbulence can be visualized with 0.8mm in plane 4D
flow resolution in one bifurcation phantom, using a partially inflated balloon and a cardiac pump at 1.3ml/s, 60bpm, VENC of 40 cm/s and systemic pressure.
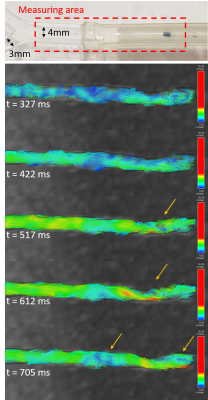
Figure 1) Turbulence (orange
arrows) visualized with 4D flow in a glass phantom (water, 25°C, 1.3ml/s,
VENC=40 cm/s)
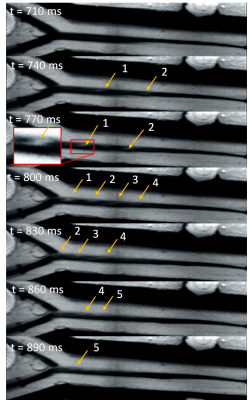
Figure 2) Turbulence (orange
arrows) visualized with injected ink in a PVA phantom by a camera (time frame
top to bottom, 30fps, 320x240, 33% glycerol solution, 25°C, 0.85ml/s).
-
Differentiating cardiac function and hemodynamics in treated and untreated models of aortic coarctation
El-Sayed H Ibrahim1, Jamasp Azarnoosh2, Arash Hassankiadeh1, Pierre Croisille3, Jadranka Stojanovska4, and John LaDisa2
1Medical College of Wisconsin, Milwaukee, WI, United States, 2Marquette University, Milwaukee, WI, United States, 3Jean-Monnet University, Lyon, France, 4University of Michigan, Ann Arbor, MI, United States
Cardiovascular
parameters can normalize in treated CoA compared to untreated cases. Myocardial
strain and aortic blood velocity are sensitive parameters for differentiating
between treated and untreated CoA as well as the severity of coarctation.
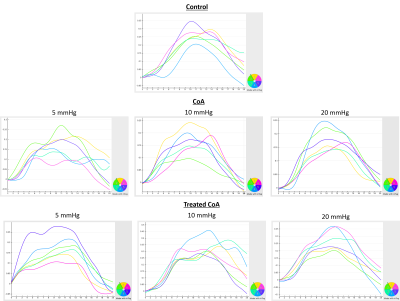
Figure 1. Strain curves in different rabbit models.
Circumferential strain curves throughout the cardiac cycle in different
segments of mid-ventricular short-axis slices. Strain is shown positive as
peripheral gating was used with peak systole during first timeframes. Note
decreased strain values with increased degree of coarctation. Strain values are
larger than those in untreated CoA (scale is different for different panels).
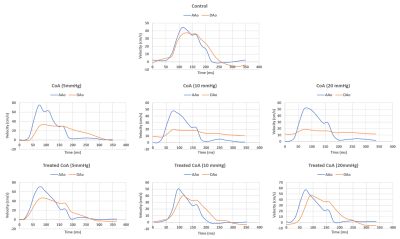
Figure 2. Velocity curves in different rabbit models. Mean velocity
throughout the cardiac cycle in ascending aorta (AAo) and proximal descending
aorta (DAo) in different rabbit models of CoA. The ratio between maximum
velocity in AAo to that in DAo was slightly >1 in control and treated CoA
compared to untreated CoA, where the ratio was always >2 in the latter.
-
Optimization of Ultrashort TE protocol QUTE-CE with ferumoxytol for abdominal MRA
Tianyi Zhou1, Liam Timms1, Valur Olafsson2, Fred Bidmead2, Vishala Mishra3, Ravi T Seethamraju4, Mukesh Harisinghani3, and Srinivas Sridhar1
1Department of Physics, Northeastern University, Boston, MA, United States, 2Northeastern University Biomedical Imaging Center, Boston, MA, United States, 3Department of Radiology, Massachusetts General Hospital, Boston, MA, United States, 4Siemens Medical Solutions, Boston, MA, United States
A
contrast-enhanced MRA protocol with Ultrashort Time-to-Echo was optimized
on phantoms covering a range of ferumoxytol concentrations for abdominal
imaging.
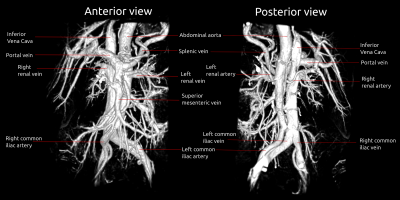
3D
rendering of the QUTE-CE image capturing the abdominal vascular anatomy shown
in anterior and posterior view.
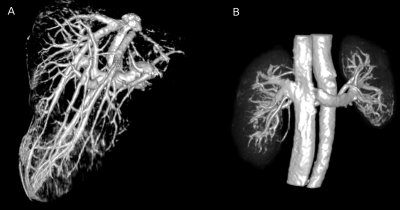
3D
rendering of the vasculature of the liver (A) and the kidneys (B) cropped from
the same QUTE-CE image shown in Figure 2.
-
Accelerated 3D whole-heart angiography using Compressed SENSE in patients with Congenital Heart Disease
Mubeena Abdulkarim1, Munes Fares1, Mohammed Hussain1,2, Gerald Greil1, Tarique Hussain1, and Joshua Greer1
1Pediatric Cardiology, University of Texas Southwestern, Dallas, TX, United States, 2Kafrelsheikh univeristy, Kafr El Sheikh, Egypt
3DWH accelerated by CS-SENSE factor of 3.5 provided visualization of all structures with no degradation in CNR or image quality while reducing scan time by approximately 25% in pediatric congenital heart disease.
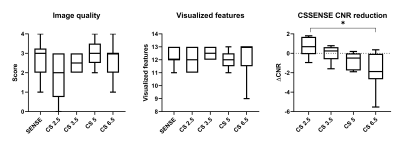
Results of the blinded image quality scores (A,
B) and quantitative change in CNR (C) for each CS-SENSE factor. RCA visibility
and the number of visualized features was not significantly affected by
CS-SENSE acceleration, while CNR was significantly decreased using a CS-SENSE
factor of 6.5 (p<0.05).
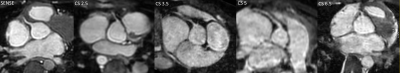
Representative MPRs of the right coronary artery
in 5 patients with SENSE and CS-SENSE factors of 2.5 – 6.5 with progressively
shorter scan times and degraded image quality.
-
3D time of flight MRA using radial-based gradient echo pulse sequence with modified DIXON of the aortic arch bifurcation
Takashi Namiki1, Masami Yoneyama1, Hiroshi Hamano1, Tomohiro Mochizuki1, Yuki Ito1, Mai Nishihara1, and Yasutomo Katsumata2
1Philips Japan, Tokyo, Japan, 2Philips Healthcare, Best, Netherlands
TOF-RADIXON of the aortic arch bifurcation allows for more robust water and fat separation without additional motion compensation. Respiratory artifacts observed by TOF-MRA have been reduced, enabling accurate vascular evaluation.
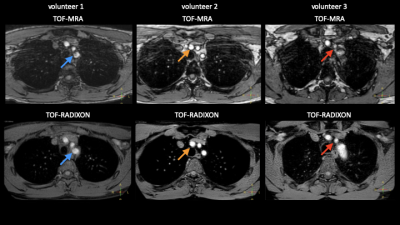
Figure 1. Compared the TOF-MRA and TOF-RADIXON of three healthy volunteers in the source image. Left column, indicates signal loss in the vascular lumen (blue arrow). Mid column, breathing fat motion-artifact shows that the artifacts overlap the blood vessels (orange arrow). Right column, indicates loss of vascular signal due to respiratory motion-artifact (red arrow).
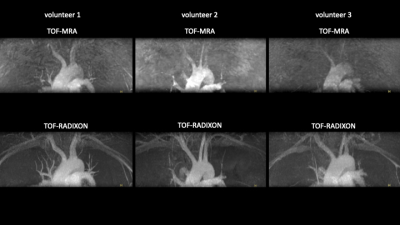
Figure 2. Compared the TOF-MRA and TOF-RADIXON of three healthy volunteers in the MIP images with a background cut by post-processing. In the TOF-MRA, due to the fat in the chest wall, it overlaps the MIP image as a white haze compared to the TOF-RADIXON.
-
Contrast enhancement DISCO magnetic resonance angiography in preoperative assessment of anterolateral thigh flap
yunfeng shen1 and Weiqiang Dou2
1shandong university, Jinan, China, 2GE Healthcare, Beijing, China
Differential Subsampling With Cartesian Ordering (DISCO)contrast enhancement magnetic resonance angiography in preoperative assessment of anterolateral thigh flap
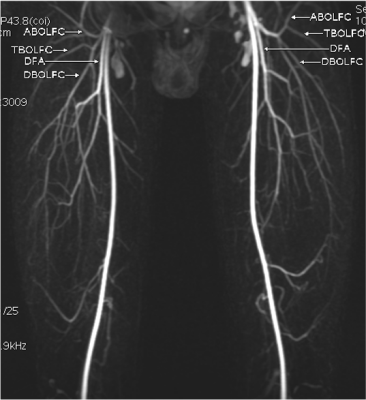
Figure1. The representative image of the origin and distribution of LFCA; ABOLFC, ascending branch of the LFCA; TBOLFC, transverse branch of the LFCA; DBOLFC, descending branch of the LFCA.
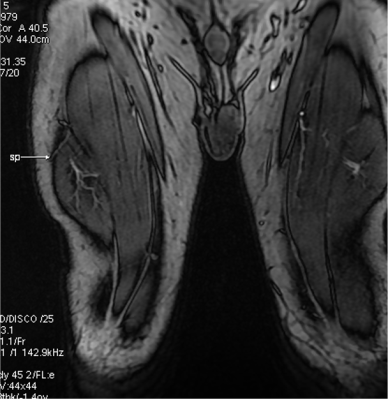
Figure2. the surface measurement signs of the perforator superficial point of the descending branch of the LFCA
-
Non-contrast-enhanced MR venography of lower extremity using balanced-TFE mDIXON with robust water-fat swap correction
Jihun Kwon1, Masami Yoneyama1, Yasuhiro Goto2, Yutaka Hamatani2, Isao Shiina2, Kazuo Kodaira2, Takumi Ogawa2, Michinobu Nagao3, Kayoko Abe3, Takashi Namiki1, and Marc Van Cauteren4
1Philips Japan, Tokyo, Japan, 2Department of Radiological Services, Tokyo Women’s Medical University, Tokyo, Japan, 3Department of Diagnostic Imaging and Nuclear Medicine, Tokyo Women’s Medical University, Tokyo, Japan, 4Philips Healthcare, Best, Netherlands
High SNR MR venography of the lower
extremities was obtained using bTFE DIXON sequence. The water-fat slice swap
artifacts observed in the original bTFE DIXON were well corrected by applying HISSCO,
the proposed post-processing technique.
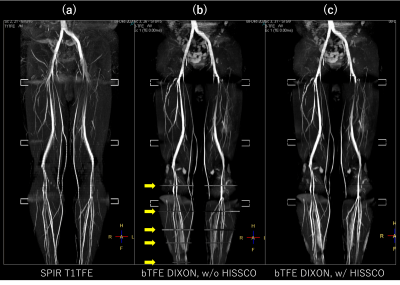
Figure
4. Representative
MIP images of (a) SPIR T1TFE, (b) bTFE DIXON without HISSCO, and (c)
bTFE DIXON with HISSCO applied. Multiple slice swaps observed below the knee in
the original bTFE DIXON (arrow) were all corrected by HISSCO. Note that the most
distal swap in (b) happened only on the right side of the leg but nicely
corrected in (c).
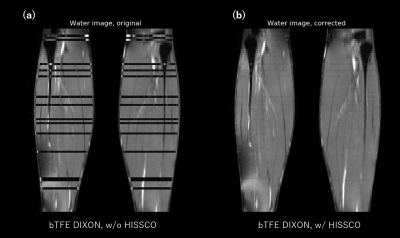
Figure
3. Comparison
of the water images of (a) bTFE DIXON without HISSCO and (b) bTFE
DIXON with HISSCO applied.
-
Peripheral Fresh Blood Imaging with High Spatial Resolution Using Compressed Sensing
Hao Li1, Martin John Graves1,2, Nadeem Shaida2, Akash Prashar2, David John Lomas1,2, and Andrew Nicholas Priest1,2
1Department of Radiology, University of Cambridge, Cambridge, United Kingdom, 2Department of Radiology, Addenbrooke’s Hospital, Cambridge, United Kingdom
A time-efficient
high-resolution 3D fresh-blood imaging
technique based on compressed sensing is developed, which improved overall
vessel sharpness and small vessel depiction for peripheral angiography.
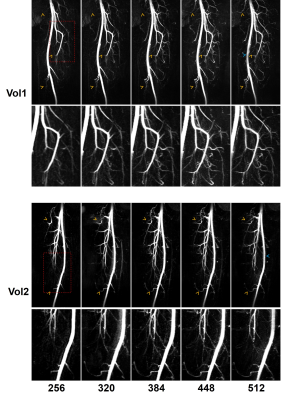
Figure 3. Example MIP images (upper
rows) and their zoomed-in views (lower rows, from the red dashed boxes) with
different resolutions from two healthy volunteers. The yellow arrowheads denote
the improved depiction of small arterial branches, and the blue arrowheads
denote the slight signal loss in the large artery on the image with very high
resolution (512×512).
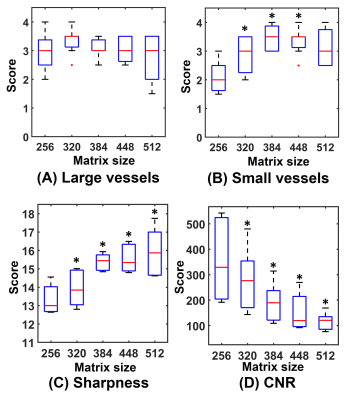
Figure 4. Box-plots of quality scores of
FBI images with different resolutions: (A) subjective evaluation of large
vessel depictions, (B) subjective evaluation of small vessel delineations, (C) objective
evaluation of sharpness and (D) objective evaluation of CNR of
artery-to-background. * denotes statistical significance between the
high-resolution images and the standard-resolution images (256×256). (Wilcoxon
signed-rank tests for A and B; paired t-tests
for C and D. P<0.05).
-
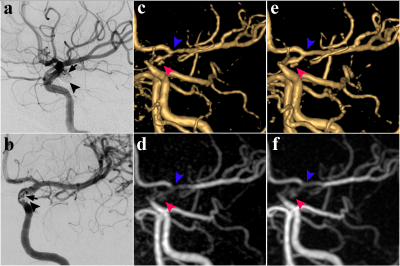
Comparison of 2D and 3D Quiescent Interval Slice-Selective Non-Contrast MR Angiography in Patients with Peripheral Artery Disease
Akos Varga-Szemes1, Pascale Aouad2, U. Joseph Schoepf1, Tilman Emrich1, Basel Yacoub1, Thomas M Todoran3, Ioannis Koktzoglou4, and Robert R Edelman4
1Department of Radiology and Radiological Science, Medical University of South Carolina, Charleston, SC, United States, 2Northwestern University, Chicago, IL, United States, 3Department of Medicine, Medical University of South Carolina, Charleston, SC, United States, 4Department of Radiology, Northshore University HealthSystem, Evanston, IL, United States
Overall
image quality and accuracy were not different between tsSOS-QISS and 2D-QISS,
indicating that 3D tsSOS-QISS provides similar diagnostic value in patients
with PAD to a standard commercially available 2D-QISS technique.
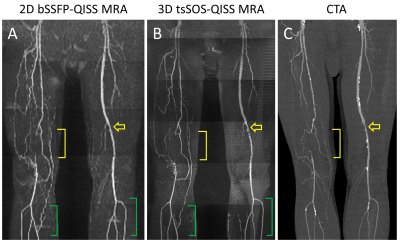
Figure 1 – 69-year-old man with PAD. Corresponding standard 2D-QISS MRA (A), 3D tsSOS-QISS MRA (B), and CTA (C) are shown. Total occlusion in the right distal superficial
femoral artery and popliteal artery (yellow
brackets) and significant stenosis in the left superficial femoral artery (yellow open arrows) are visualized. Stair-step
artifacts can be seen on 2D-QISS (A, green
brackets), which are not present on the corresponding 3D tsSOS-QISS (B, green brackets).
-
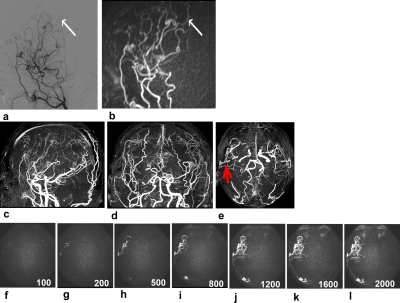
Non-contrast high-resolution 4D-peripheral MRA using Retrospective EPI
Yasuhiro Goto1, Michinobu Nagao1, Masami Yoneyama2, Yasutomo Katsumata2, Isao Shiina1, Kazuo Kodaira1, Yutaka Hamatani1, Takumi Ogawa1, Mamoru Takeyama1, Isao Tanaka1, and Shuji Sakai1
1Women's Medical University Hospital, tokyo, Japan, 2Philips Japan, tokyo, Japan
We investigated whether non-contrast, high resolution PPU-triggered 4D-peripheral MRA using Retrospective EPI (REPI). REPI 4D-peripheral MRA with VENC of 10 cm/s showed higher vascular conspicuity compared with the conventional methods.
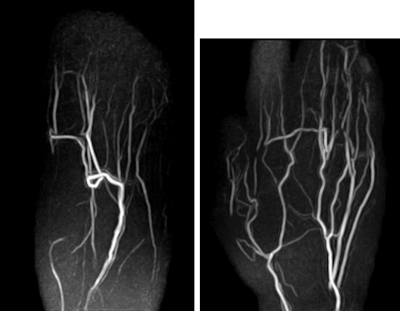
Figure 5. Representative REPI 4D MRA of the foot (left) and the hand (right). REPI 4D MRA could visualize blood vessels from proximal to distal with high
robustness. The optimal VENC for visualizing peripheral blood vessels was 10cm/s.
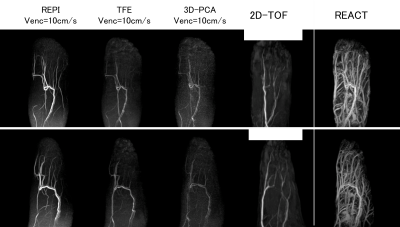
Figure 4. Peripheral vessels of the foot. REPI VENC=10cm/s, TFE VENC=10cm/s, 3D-PCA VENC=10cm/s, 2D-TOF used for comparison. REPI 4D-MRA significantly improves
vascular structure in AREA2,3,4, compared with the other three methods.
Visualized.
-
Planning-less REACT-MD: Fast and simple run-off exam of the total legs with simultaneous non-contrast MRA and black-blood imaging
Yutaka Hamatani1, Kayoko Abe2, Masami Yoneyama3, Christoph Katemann4, Shuo Zhang4, Yasuhiro Goto1, Michinobu Nagao2, Isao Shiina1, Kazuo Kodaira1, Takumi Ogawa1, Mamoru Takeyama1, Isao Tanaka1, and Shuji Sakai2
1Department of Radioligical Services, Tokyo Women's Medical University Hospital, Tokyo, Japan, 2Department of Diagnostic imaging & Nuclear Medicine, Tokyo Women's Medical University Hospital, Tokyo, Japan, 3Philips Japan, Tokyo, Japan, 4Philips Healthcare, Hamburg, Germany
REACT-MD provides
fast run-off exams of the total legs with simultaneous non-contrast MRA and
black-blood imaging. Initial results show promise in offering diagnostic
quality without scout acquisition and planning with simplified workflow for
detection of peripheral vascular diseases.
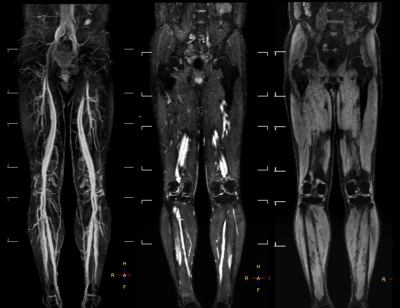
Figure 4.
Representative full MIP (left) partial MIP (center) of
REACT-MRA and MPRAGE (right) images from the same REACT-MD dataset. It is
noteworthy that REACT-MD provided both MRA and MPRAGE images in one single scan
and allowed for imaging over a large FOV at 3.0T.
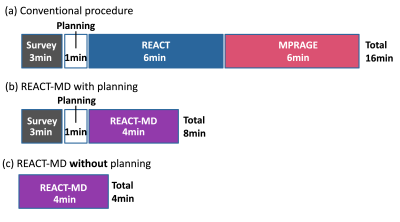
Figure 2.
A
comparison of the procedural time scheme using the proposed approach to the
conventional method in the practice. (a) conventional procedure included
survey, planning and separate scans for REACT and MPRAGE images. REACT-MD can
shorten the scan time for REACT and MPRAGE (b). Furthermore, fast planning-less
approach (c) further reducing the total examination time.
-
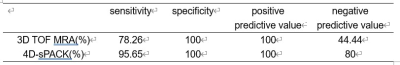
Clinical Ultra-High Field Protocol for Visualization and Quantification of Lesion Components in Peripheral Artery Disease
Kavya Sinha1, Christof Karmonik2, Alan B Lumsden1, and Trisha Roy1
1DeBakey Heart & Vascular Center, Houston Methodist Hospital, Houston, TX, United States, 2Translational Imaging Center, Houston Methodist Research Institute, Houston, TX, United States
Clinical high-field MRI protocol was established for the
visualization and quantification of PAD lesion components. Ex-vivo
imaging supported and confirmed the findings and
initial impression of the 7T images.
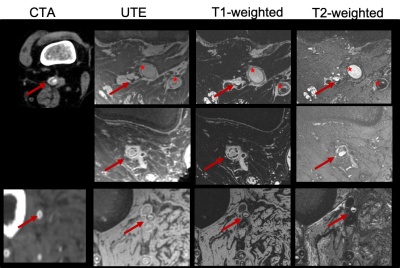
Figure 1: Multi-contrast images (CTA:
computed tomography angiography, UTE: ultra-short TE, T1-weighted, T2-weighted)
demonstrating excellent contrast between PAD lesion components in popliteal
(first and second row, red arrows) and peroneal artery (third row, red
arrows). Circumferential calcifications, as well as occlusions, can be readily appreciated due to the intrinsic high
spatial resolution achievable at the 7T scanner compared to the CTA. No CTA
available, 2nd row. (Red stars: Occluded PTFE grafts)
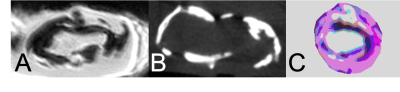
Figure 2: 3D UTE microMRI
(A) and corresponding microCT (B) image of the excised lesion
demonstrating good agreement between hypointense area on the micro MRI and the circumferential calcification
identified with the microCT.
Pseudo-color image (C) created from the 7T images illustrate the
differentiation power of the near in-vivo 7T to differentiate lesion components
also in respect to the ex-vivo microCT.
-
Comparison of femoral artery plaque characteristics between men and women in elderly population using magnetic resonance vessel wall imaging
Lichen Zhang1,2, Yongjun Han3, Maobin Guang4, Zhu Zhu4, Jianming Cai5, and Xihai Zhao6
11Medical School of Chinese PLA, Beijing, China., Beijing, China, 2Department of Radiology, the Fifth Medical Center, Chinese PLA General Hospital, Beijing, China., Beijing, China, 3Department of radiology, Aerospace Center Hospital, Beijing, China., Beijing, China, 4Department of Radiology, The Affiliated Hospital of Yangzhou University, Yangzhou University, Yangzhou, China, Yangzhou, China, 5Department of Radiology, the Fifth Medical Center, Chinese PLA General Hospital, Beijing, China., Beijing, China, Beijing, China, 6Center For Biomedical Imaging Research, Department of Biomedical Engineering, School of Medicine, Tsinghua University, Beijing, China, Beijing, China
Men
had significantly larger area of lumen and wall, but smaller normalized wall
index compared with women. Men and women have similar wall thickness,
eccentricity index, luminal stenosis and presence of plaque.
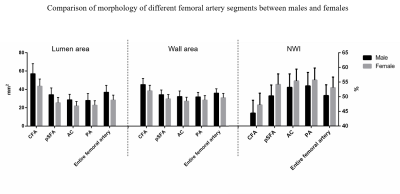
Figure 2: Comparison of morphology of different femoral artery segments between males and females with plaque. CFA: common femoral artery; pSFA: proximal superficial femoral artery AC: adductor canal PA: popliteal artery.
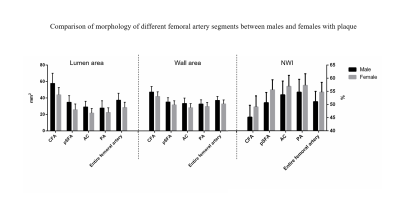
Figure 3. Comparison of morphology of different femoral artery segments between males
and females with plaque with plaque
-
Predicting In Vivo Signal Intensity in Contrast Enhanced MRA Based on Blood Concentration of Gadolinium-Based Contrast Agents
Evan Norris1, Guenther Schneider2, Toshimasa Clark1, Miles Kirchin3, Gregory Wilson4, and Jeffrey Maki1,4
1Radiology, University of Colorado, Aurora, CO, United States, 2University Hospital of Saarland, Homburg, Germany, 3Bracco Imaging, Milan, Italy, 4University of Washington, Seattle, WA, United States
We validate that
the theoretical relationship between gadolinium-based contrast agent (GBCA) concentration and R1, R2* in first pass contrast enhanced MRA (CE-MRA) allows for accurate predictions of CE-MRA
signal intensity for any given blood concentration of three different GBCAs.
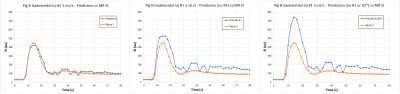
Figure
5: First gadoteridol injection (3 mL/s - left Figure 2) plots predicted (blue)
vs observed (orange) which integrates R1 and R2* effects
with excellent correlation between predicted and observed SI. The middle graph shows
the same predictive model but excludes R1 effects, with decreased
accuracy between predicted and observed SI. The right graph shows the same
predictive model without both R1 and R2* effects, which
is the least accurate construct. This is consistent across all agents and
injections.
Figure
2: Three consecutive injections of gadoteridol at 3 (left), 1 (middle), and 2
(right) mL/s with predicted (blue) versus observed (orange) SI line plots. Relative
gain between observed and predictive SI was adjusted for the first injection
baseline, and held constant for the subsequent two injections. Blood R1 and R2* effects were
integrated into the model, with excellent correlation between predicted and
observed SI across all three injections.
-
Dual-echo 3D-MERGE with Adiabatic Flow Suppression for Large-coverage Carotid Vessel Wall Imaging
Zechen Zhou1, Niranjan Balu2, Holger Eggers3, Peter Börnert3, Thomas S. Hatsukami2, and Chun Yuan2
1Philips Research North America, Cambridge, MA, United States, 2Vascular Imaging Lab, University of Washington, Seattle, WA, United States, 3Philips Research Hamburg, Hamburg, Germany
The developed duel-echo
3D-MERGE with adiabatic flow suppression can achieve improved image quality for
large-coverage carotid vessel wall imaging. In addition, it can provide
quantitative fat fraction and field maps for potential plaque component analysis.
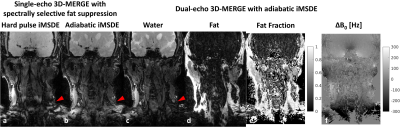
Figure
2: Comparison of different 3D-MERGE scans on a volunteer (coronal view). (a)
single-echo 3D-MERGE with composite hard pulse iMSDE and SPIR fat suppression.
(b) single-echo 3D-MERGE with adiabatic iMSDE and SPIR fat suppression. Water
(c) and fat (d) images as well as fat fraction (e) and field (f) maps are
decomposed from dual-echo 3D-MERGE with adiabatic iMSDE. Note the signal
intensity uniformity and fat suppression difference in those red arrow pointed
regions in (a)-(c).
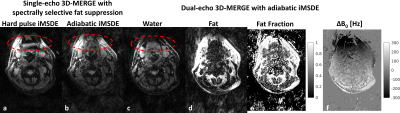
Figure 3: Comparison
of different 3D-MERGE scans on a volunteer (axial view). (a) single-echo
3D-MERGE with composite hard pulse iMSDE and SPIR fat suppression. (b)
single-echo 3D-MERGE with adiabatic iMSDE and SPIR fat suppression. Water (c)
and fat (d) images as well as fat fraction (e) and field (f) maps are
decomposed from dual-echo 3D-MERGE with adiabatic iMSDE. Note the signal
intensity uniformity and fat suppression difference in those red circle regions
in (a)-(c).
-
Quantitative evaluation of signal intensity threshold for carotid plaque components in cardiovascular MR imaging: Validation by histology
Dongye Li1, Huiyu Qiao2, Yongjun Qiao2, Hualu Han2, Dandan Yang2, Jingli Cao3, Huimin Xu4, Tao Wang4, Jun Shen1, and Xihai Zhao2
1Department of Radiology, Sun Yat-Sen Memorial Hospital, Sun Yat-Sen University, Guangzhou, China, 2Department of Biomedical Engineering, Center for Biomedical Imaging Research, Tsinghua University School of Medicine, Beijing, China, 3China National Clinical Research Center for Neurological Diseases, Beijing Tiantan Hospital, Capital Medical University, Beijing, China, 4Peking University Third Hospital, Beijing, China
This study afforded a standard of the signal intensity threshold ratio of carotid plaque components compared to reference tissues on multi-contrast cardiovascular MR imaging, and provides the basis for accurate identification of crucial plaque components.
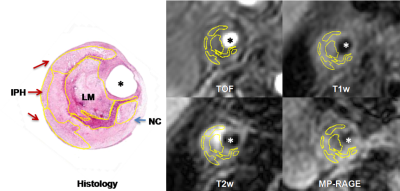
Figure 2. The NC, IPH and LM were identified and quantified on matched histological section and MR imaging
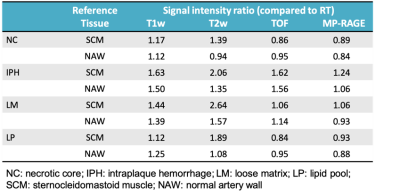
Figure 4. The signal intensity threshold ratio of plaque components referred to reference tissue
-
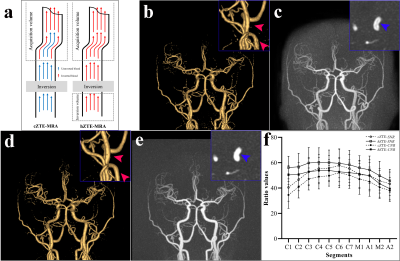
Free-breathing T1-weighted black-blood vessel wall MRI based on radial imaging with motion sensitized driven equilibrium (MSDE) preparation
Takashi Namiki1, Hiroshi Hamano1, Naoki Udo2, Inka Ristow3, Felicia-Marie von Düring3, Alexander Lenz3, Shuo Zhang4, and Masami Yoneyama1
1Philips Japan, Tokyo, Japan, 2Department of Radiological technology , Yuuai Medical Center, Okinawa, Japan, 3Department of Diagnostic and Interventional Radiology and Nuclear Medicine, University Hospital Hamburg-Eppendorf, Hamburg, Germany, 4Philips, Hamburg, Germany
Free-breathing black-blood MRI of the main thoracoabdominal vessels
using MSDE-prepared radial imaging is possible without additional motion
compensation. A uniform blood suppression independent from the contrast agent
T1-shortening effect may permit assessment of wall abnormalities.
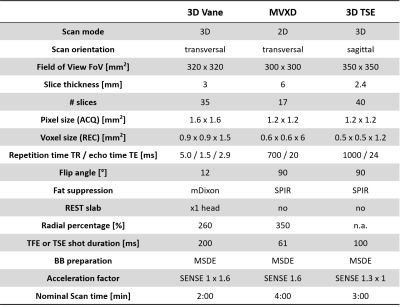
Table 1. Imaging
parameters of free-breathing MSDE-prepared 3D golden-angle radial
stack-of-stars (3D Vane-MSDE) and 2D TSE MultiVane XD (MVXD-MSDE)
used in this study. Conventional
Cartesian 3D TSE with MSDE-preparation and motion compensation was performed
for comparison (3D TSE-MSDE).
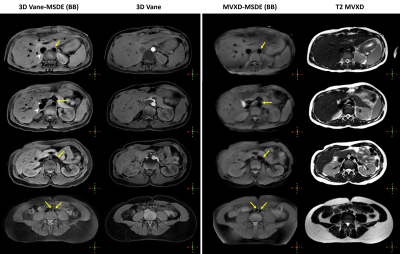
Figure 2. Free-breathing black-blood imaging with
proposed 3D Vane-MSDE and MVXD-MSDE. Homogeneous blood suppression was achieved by
MSDE preparation in both aorta (yellow
arrows) and inferior vena cava (arrow
heads). Images were selected at four different levels from top of the
kidney to aortic bifurcation in a healthy volunteer. Conventional bright-blood
3D Vane and T2 MVXD images at the corresponding slice locations were shown for
comparison.
-
Quantitative MRI to compare vascular health in nonsmokers, smokers, and vapers.
Alessandra Caporale1, Michael Langham1, and Felix W Wehrli1
1Radiology, Laboratory for Structural, Physiologic and Functional Imaging, Perelman School of Medicine, University of Pennsylvania, Philadelphia, PA, United States
MRI metrics of peripheral, cerebrovascular reactivity and aortic stiffness were compared in smokers, vapers and nonsmokers (all<35y). No MRI metrics was significantly different among groups, likely because damage accumulation takes longer to elicit measurable effects on the endothelium.
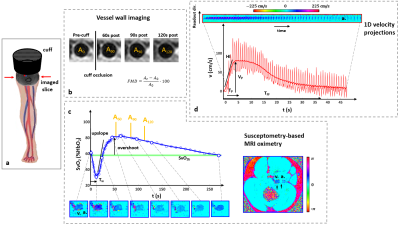
Figure 2 – A. The cuff is proximal to the superficial femoral artery and vein. B. Artery lumen (At) is measured before cuff-occlusion and post-cuff release, to evaluate flow mediated dilation. C. Venous saturation (SvO2) is measured continuously post-cuff release (acquisition is interrupted 3 times to measure At), using the phase difference between vein (v.) and artery (a.) (SvO2b=pre-cuff SvO2; Tw=washout time). D. Arterial blood flow velocity averaged across the artery lumen, plotted vs time. (VP=peak velocity; HI=blood acceleration; TP=time to peak; TFF=hyperemia duration).
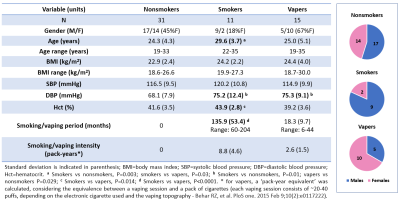
Figure 1 – Demographics, details on smoking/vaping history and exposure, and gender distribution in the three groups.