-
The effect of white matter signal abnormalities on default mode network connectivity in mild cognitive impairment
Zhuonan Wang1, Victoria J Williams2, Kimberly A Stephens3, Chan-Mi Kim3, Ming Zhang4, and David Salat3
1PET/CT Unit, Medical Imaging, The First Affiliated Hospital of Xi'an Jiaotong University, Xi'an, China, 2Alzheimer's Clinical and Translational Research Unit, Department of Neurology, Massachusetts General Hospital, Charlestown, MA, United States, 3Athinoula A. Martinos Center for Biomedical Imaging, Department of Radiology, Massachusetts General Hospital, Charlestown, MA, United States, 4Medical Imaging, The First Affiliated Hospital of Xi'an Jiaotong University, Xi'an, China
Reduced DMN functional connectivity in
those with MCI compared to cognitively healthy controls, the extent to which
was differentially regionally related to white matter lesion volume and may indicate
a vascular etiology to subtle impairment in MCI.
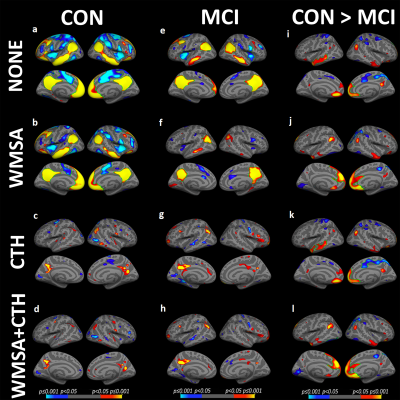
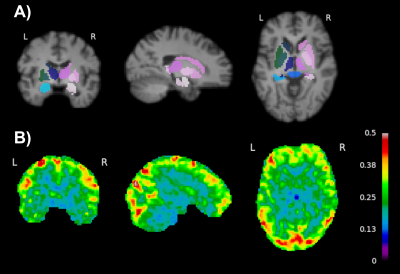
Functional connectivity maps are shown for (1) cognitively healthy controls (CON), (2) Mild cognitive impairment (MCI) group and groups comparison : (a,e,i) without regressors, (b,f,j) regressing out white matter signal abnormalities (WMSA), (c,g,k) regressing out cortical thickness (CTH), and (d,h,l) regressing out both. Warm colors indicate significant regional positive correlations with the precuneus-seed (a-h) and stronger DMN connectivity in CON, and cool colors indicate regions of anticorrelation (a-h) and stronger DMN connectivity in MCI.
-
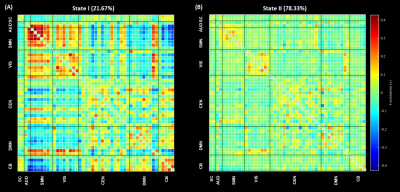
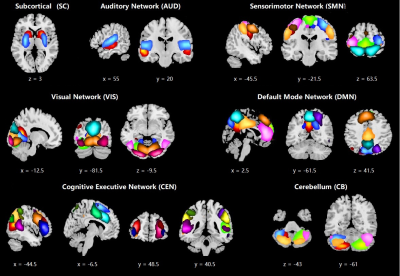
Altered brain networks dynamics in first-episode drug-free schizophrenia
Wanfang You1, Lekai Luo1, Qian Li1, Yuxia Wang1, Qiyong Gong1, and Fei Li1
1Huaxi MR Research Centre (HMRRC), Department of Radiology, West China Hospital of Sichuan University, chengdu, China
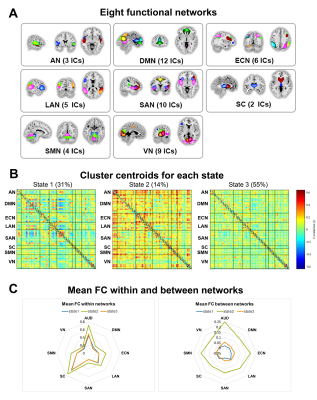
Patients with schizophrenia was mainly manifested as prolonged dwell time in a
state characterized by sparsely connected FCs and increased temporal
variability of centrality in the visual network, which may help to better
interpret mechanisms underlying hallucination in
schizophrenia.
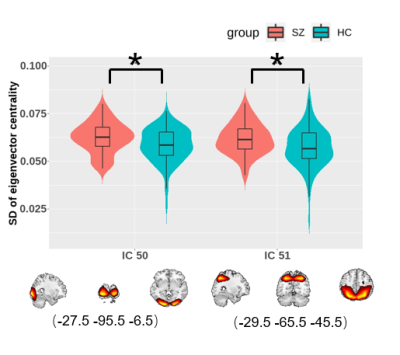
Figure 4. Results map of the independent components (ICs)
showed between-group differences in eigenvector centrality (EC). Patients with
schizophrenia showed increased temporal dynamics of EC in IC50 (P=0.0286) and IC51 (P=0.0286) involved in visual networks compared with controls.
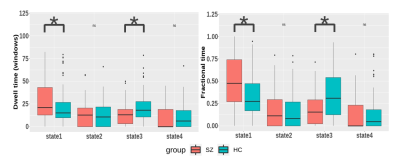
Figure 2. Compared with the controls, patients with
schizophrenia shown altered state transition vectors of mean dwell time and
fractional time in states 1 and 3 (P<0.05, FDR corrected).
-
Investigation of Frontal Alpha Asymmetry EEG Neurofeedback in Major Depression Using Simultaneous fMRI
Vadim Zotev1, Aki Tsuchiyagaito1, and Jerzy Bodurka1,2
1Laureate Institute for Brain Research, Tulsa, OK, United States, 2Stephenson School of Biomedical Engineering, University of Oklahoma, Norman, OK, United States
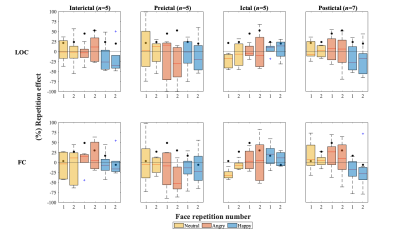
Our study provides evidence using simultaneous EEG-fMRI that EEG neurofeedback training targeting frontal alpha EEG asymmetry can engage and influence the emotional brain circuitry in patients with major depressive disorder.
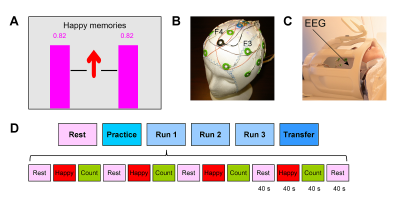
Figure 1. A) EEG neurofeedback GUI screen with variable-height
magenta neurofeedback bars. B) Modified MR-compatible EEG cap for improved
EEG-nf during fMRI. Frontal channels F3 and F4 are used to provide FAA-based EEG-nf.
C) Simultaneous EEG-fMRI. D) Experimental protocol with six EEG-fMRI runs,
abbreviated as RE, PR, R1, R2, R3, and TR. The five task runs consist of 40-s-long
blocks of Rest, Happy Memories, and Count conditions, abbreviated as R, H, and
C.
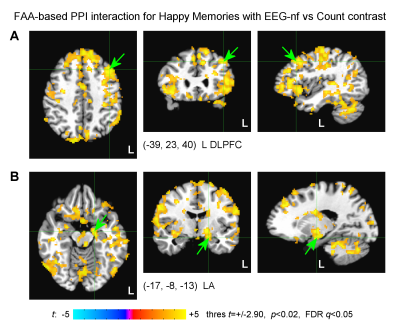
Figure
4.
Statistical maps of the FAA-based PPI interaction effect for the Happy Memories
with EEG-nf vs Count condition contrast for the EG. The individual results were
averaged across the four EEG-nf runs. The maps are shown in the Talairach
space. A positive effect means a stronger temporal correlation between the FAA
time course and BOLD activity during the EEG-nf task compared to the control
task. A) Left dorsolateral prefrontal cortex (L DLPFC) region. B) Left amygdala
(LA) region.
-
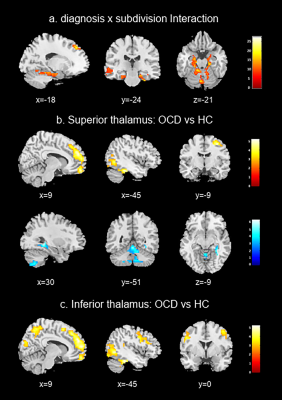
Differential task-induced brain activation and functional connectivity patterns between OCD and GAD: Preliminary study on verbal memory
Shin-Eui Park1, Gwang-Won Kim2, Yun-Hyeon Kim3, and Gwang-Woo Jeong3
11Advanced Institute of Aging Science, Chonnam National University, Gwangju, Korea, Republic of, 2Department of Psychiatry, Massachusetts General Hospital and Harvard Medical School, Boston, MA, United States, 3Department of Radiology, Chonnam National University Medical School, Gwangju, Korea, Republic of
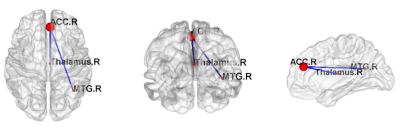
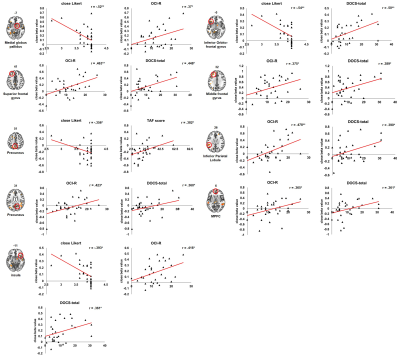
Our findings indicate abnormal connection with superior temporal cortex and inferior parietal cortex caused by obsessive-compulsive symptom.
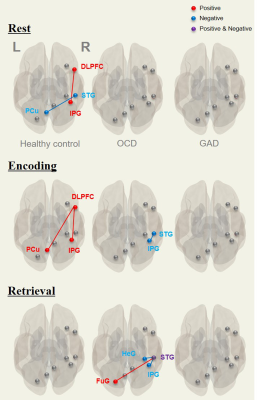
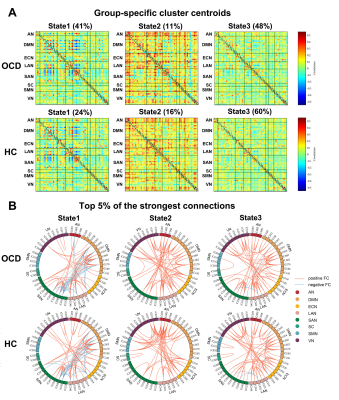
Different brain functional connectivity patterns in patients with OCD and
GAD and in healthy control participants during memory tasks. Red lines
represent positive connectivity and blue lines indicate negative connectivity. None
of the functional connectivity patterns were observed in patients with GAD. Details
are shown in Table 4. DLPFC, dorsolateral prefrontal cortex; STG, superior
temporal gyrus; IPG, inferior parietal gyrus; PCu, precuneus; HeG, Heschl
gyrus; FuG, fusiform gyrus. L=left; R=right.
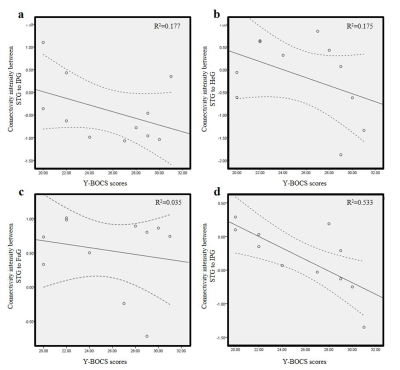
Correlations between Y-BOCS scores and functional connectivity(FC) during explicit, verbal memory tasks: in encoding period, STG-IPG(r=-0.421,p=0.011)(a); in retrieval period, STG-HeG(r=-0.418,p=0.200)(b), STG-FuG(r=-0.189,p=0.581)(c), and STG-IPG(r=-0.421,p=0.011)(d). Note
that only FC of STG-IPG was negatively correlated with
Y-BOCS scores. Curved dotted line bands indicate 95% confidence intervals.
Y-BOCS, Yale-Brown Obsessive Compulsive Scale; STG,
superior temporal gyrus; IPG, inferior parietal gyrus; HeG, Heschl gyrus; FuG,
fusiform gyrus.
-
Functional and structural brain network features in Borderline Personality Disorder
Giovanni Sighinolfi1, Stefania Evangelisti2, Micaela Mitolo3, Claudio Bianchini2, Laura Ludovica Gramegna2,3, David Neil Manners2, Caterina Tonon2,3, Raffaele Lodi2,3, Francesca D'Adda2, Luca Pellegrini2, Marco Menchetti2, Domenico Berardi2, and Claudia Testa1
1Dipartimento di Fisica e Astronomia, Università di Bologna, Bologna, Italy, 2Dipartimento di Scienze Biomediche e Neuromotorie, Università di Bologna, Bologna, Italy, 3IRCCS Istituto delle Scienze Neurologiche di Bologna, Bologna, Italy
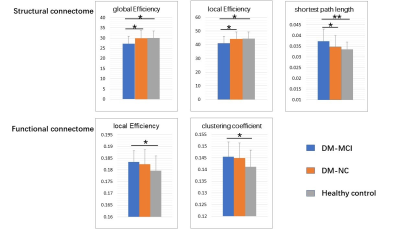
Graph
analysis of brain networks in early-stage Borderline Personality Disorder
patients showed functional alterations of global efficiency and modularity, and
of centrality and efficiency mainly for limbic regions involved in emotional
regulation.
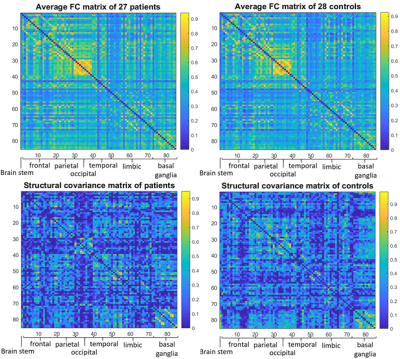
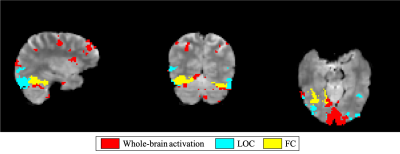
Figure 1: Average FCN (top) and SCN (bottom) of patients
(left) and controls (right). The 85 nodes, on both axes, are arranged according
to the anatomical system they belong to: frontal, parietal, occipital, temporal
and limbic, with the addition of the basal ganglia and the brainstem. The
existence of a modular structure is evident.
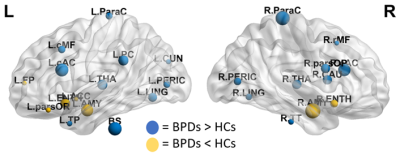
Figure 3: ROIs whose strength in the FCNs resulted to
be significantly altered between BPDs and HCs. Blue: strength higher in BPDs; yellow:
strength higher in HCs; size of the node: statistical significance of the
alteration. Bilateral amygdala (AMY) and caudal anterior cingulate cortex (CAC)
presented amongst the lowest p-Values.
-
Static and dynamic functional connectivity in medication-free patients with obsessive compulsive disorder
Jing Liu1, Hailong Li1, Lingxiao Cao1, Xue Li2, Suming Zhang1, and Xiaoqi Huang1
1Huaxi MR Research Center (HMRRC), Functional and molecular imaging Key Laboratory of Sichuan Province, Department of Radiology, West China Hospital, Sichuan University, Chengdu, China, 2Sichuan University, Chengdu, China
The BNST demonstrated different connected regions in sFC and dFC in OCD,
indicating their combination can provide more comprehensive information by
considering both the static and time-varying aspects.
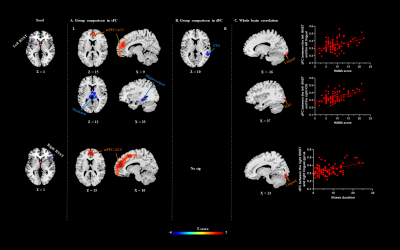
Figure
2. Brain regions with significant group difference
between OCD and HC in sFC (A) and dFC (B). Warm/cool colors indicate regions
showing higher/lower sFC/dFC value in the OCD group comparing with HC. The HAMA score positively correlated with dFC
between the left BNST and the left lingual gyrus, and the right IOG. The
illness duration positively correlated with dFC between the right BNST and
right lingual gyrus (C). The warm colors indicate regions showing positive
correlation with clinical scores. IOG, inferior occipital gyrus; HAMA, Hamilton
Anxiety Rating Scale.
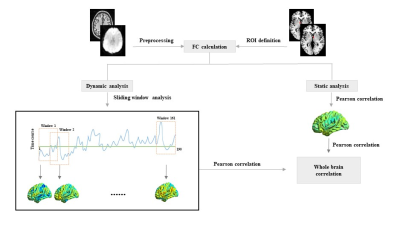
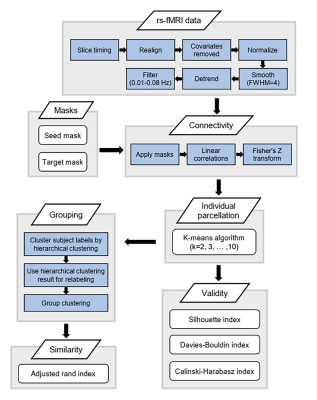
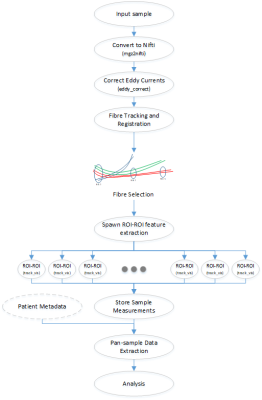
Figure 1. Flowchart
illustrating analytic procedures of present study. ROI, region of interest.
-
Meta-analytic investigation and funtional decoding on neural correlates of high familial risk for mood disorders
Kun Qin1, Nanfang Pan1, Ziyu Zhu1, Feifei Zhang1, Jing Yang1, Xueling Suo1, and Qiyong Gong1
1West China Hospital of Sichuan University, Chengdu, China
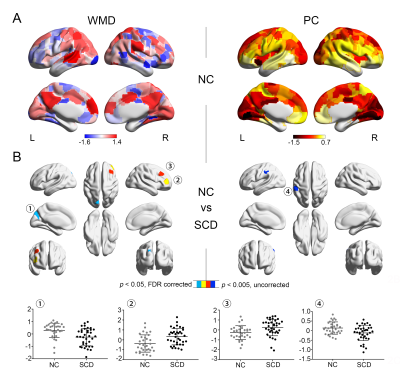
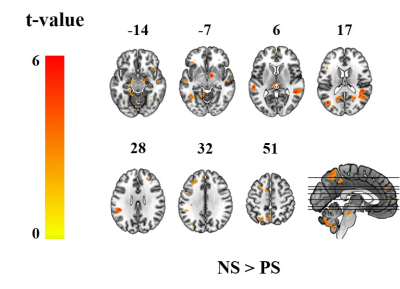
Abnormal activation in the precuneus, insula and parietal cortex was related to genetic vulnerability in high-risk relatives of patients with mood disorders. The most affected behavioral domian associated with the funtional abnormalities in high-risk relatives was emotion.
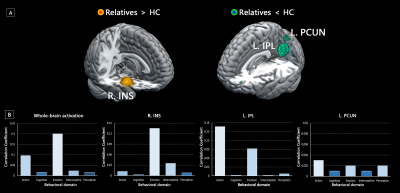
Figure 1. Transdiagnostic clusters with abnormal functional activation in high-risk relatives of patients with mood disorders. (A) Transdiagnostic meta-analysis identified three clusters of hyper- or hypo-activation in the insula, IPL and precuneus. Hyper-activated cluster was drawn in yellow or red, while hypo-activated clusters were drawn in green or blue. (B) Correlation coefficients of each behavioral domain with abnormal activation map in high-risk relatives at the whole-brain or ROI level.
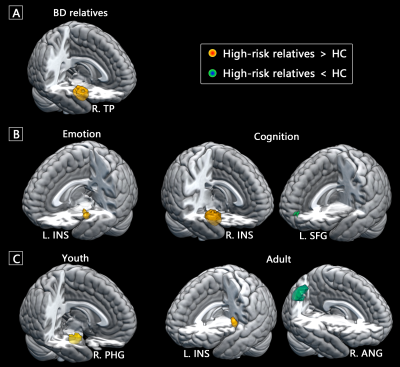
Figure 2. Subgroup analysis of abnormal functional activation pattern in high-risk relatives of patients with mood disorders. (A) Significant clusters identified in relatives of patients with BD; (B) Significant cluster identified in cognition-related experiments and emotional-related experiments; (C) Significant clusters identified in young and adult relatives.
-
Aberrant Cerebellar Functional Connectivity and its Association with Motor and Non-motor Functions in de novo Drug Naïve Parkinson’s Disease
Li Jiang1,2, Brenda Hanna-Pladdy1,2, Jiachen Zhuo1,2, Paul Fishman3, and Rao Gullapalli1,2
1Center for Advanced Imaging Research, University of Maryland Baltimore, Baltimore, MD, United States, 2Department of Diagnostic Radiology & Nuclear Medicine, University of Maryland Baltimore, Baltimore, MD, United States, 3Department of Neurology, University of Maryland Baltimore, Baltimore, MD, United States
Our findings showed that multimodal disruption of cerebellar connectivity while reflective of
early symptoms of PD, also may suggest a possible compensatory mechanism prior
to clinical presentation of non-motor features of the disease.
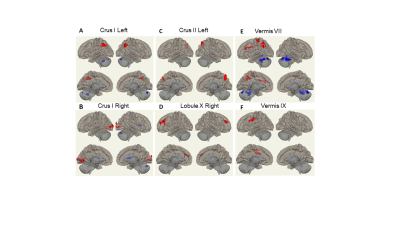
Figure
2: FC
difference map between the PD patients and HCs of non-motor cerebellum seeds
of (A) left Crus I; (B) right Crus I; ©
left Crus II; (D) right Lobule X; (E) vermis VII; (F) Vermis IX.
Two-sided two sample t-test was performed with
significant level of voxel uncorrected p < 0.005 and cluster FDR-corrected p < 0.05. Blue color
represents FC of PD less than FC of HCs. Red
color represents FC of PD greater than FC of HCs.
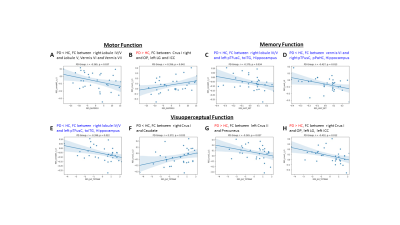
Figure
3:
Association between FC within significant clusters and neurophysiological
assessments in PD group. Correlation between UPDRS III and FC
of (A) right lobule IV/V FC to lobule V, vermis VI, and vermis VII; (B)
right Crus I to OP, left LG, ICC. Correlation between HVLT retention
and FC of (C) right lobule IV/V FC to left pTFusC,
left toITG, and
hippocampus; (D)
vermis VI to right pTFusC, left toITG, and
hippocampus. Correlation between BJLO total raw score and FC of (E) right
lobule IV/V to left pTFusC, toITG, and
Hippocampus; (F) right Crus I to caudate; (G)
left Crus II to Precuneus.
-
Locus coeruleus degeneration is associated with disorganized functional topology in Parkinson’s disease
Cheng Zhou1, Tao Guo1, Jingjing Wu1, Xueqin Bai1, Xiaojun Guan1, and Minming Zhang1
1Zhejiang University, Hangzhou, China
This study demonstrated that, in addition to dopamine
deficiency, the degeneration of LC is another important pathway for PD clinical
manifestation through associating with the disorganization of functional
topology.
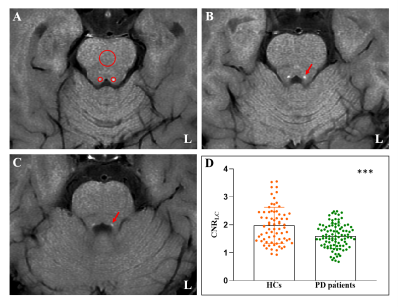
Figure 1. Comparison of CNRLC between the HC and
PD groups.
(A) Signal
intensity measurements of the LC (two small red circles) and pontine (a big red
circles) from a HC; (B) and (C) The location of LC in continuous layers (red arrow);
(D) Significantly decreased CNRLC was found in PD group when
compared with HC group.
CNRLC:
Contrast-to-noise ratio of the locus coeruleus; HC: Healthy control; PD: Parkinson's
disease; L: Left; ***: P < 0.001.
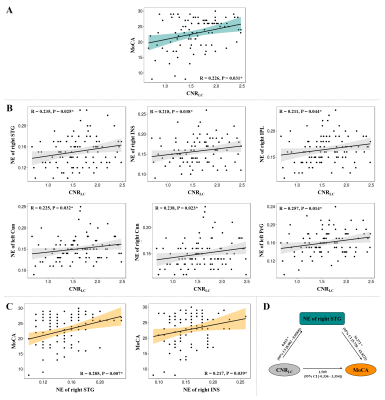
Figure 3. Correlation analysis among CNRLC,
network attributes, and MoCA score in PD group.
(A)
CNRLC was significantly correlated
with MoCA score in PD group; (B) CNRLC was significantly
correlated with the network attributes of cognitive
and motor related regions in PD group; (C) Network attributes of
two cognitive related regions were associated with MoCA score in PD group;
(D) Mediation analysis showed that damaged NE of STG was
a mediator between LC degeneration and cognitive decline.
-
Reorganization of functional network topology in Parkinson’s disease patients with and without freezing of gait.
Karthik R Sreenivasan1, Xiaowei Zhuang1, Zhengshi Yang1, Dietmar Cordes1, Aaron Ritter1, Jessica Caldwell1, Zoltan Mari1, and Virendra Mishra1
1Cleveland Clinic Lou Ruvo Center for Brain Health, Las Vegas, NV, United States
The results of our study demonstrate that despite not observing overall
global or local network differences Parkinson’s disease patients with and without
freezing of gait exhibit a clear shift in the topological organization when
compared to the controls.
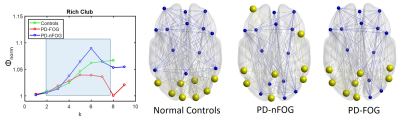
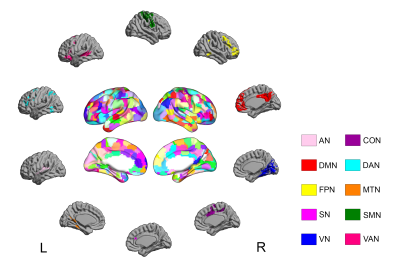
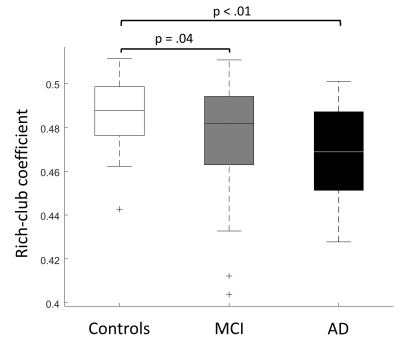
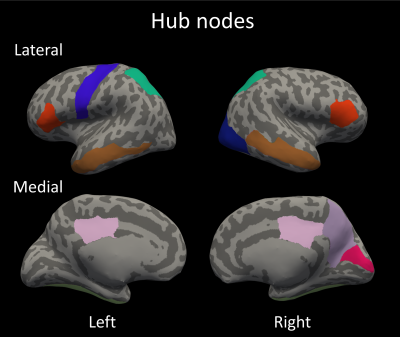
Figure 3. Rich-clubs are reorganized in the PD groups when compared to
controls. (A) The Rich-club regime for NC, PD-nFOG, and PD-FOG are shown in the blue-shaded
box. (B) Rich-club nodes are indicated in yellow color and non-rich-club nodes
are shown in blue color for NC, PD-nFOG, and PD-FOG. Red circle – default mode
network; purple circle – frontoparietal network; green circle – visual network.
‘k’ is the nodal degree. Visualized using BrainNet Viewer10
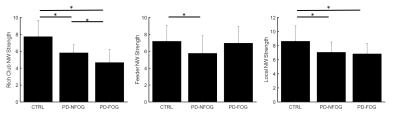
Figure 4. The difference in rich-club connectivity. Rich-club network strength,
feeder network strength, and local network strength are plotted as bar plots
for NC, PD-nFOG, and PD-FOG groups. Rich-club network – edges between rich-club
nodes; feeder network – edges connecting non-rich-club nodes and rich club
nodes; local network – edges between non-rich-club nodes. * indicates
statistical significance (pcorr<0.05)
-
Altered Amplitude of Low Frequency Fluctuation in Language Eloquent Areas in Patients with Medically-refractory Temporal Lobe Epilepsy
Li Jiang1,2, Stephanie Chen3, Lorenna Vidal4, Jiachen Zhuo1,2, Rao Gullapalli1,2, and Prashant Raghavan2
1Center for Advanced Imaging Research, University of Maryland Baltimore, Baltimore, MD, United States, 2Department of Diagnostic Radiology & Nuclear Medicine, University of Maryland Baltimore, Baltimore, MD, United States, 3Department of Neurology, University of Maryland Baltimore, Baltimore, MD, United States, 4Department of Radiology, Children's Hospital of Philadelphia, Philadelphia, PA, United States
TLE patients showed decreased mALFF in right STG and right
AG compared to HCs.
Left TLE patients showed a greater decrease in mALFF in the
left AG compared to right TLE patients.
Significant positive correlation between averaged mALFF in
right STG and clinical comprehension language score.
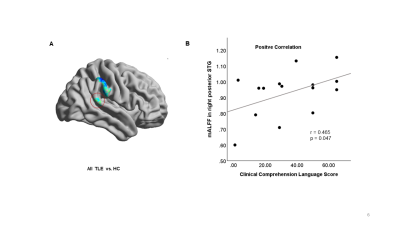
The Pearson
correlation between the language test scores and the mALFF in
the sub-regions within the language eloquent areas. (A) Significant clusters by
comparing all TLE patients and healthy controls. The regions of right superior
temporal gyrus (pSTG) was circled out. (B) Correlation
between the composite percentile scores and mALFF in the
right pSTG.
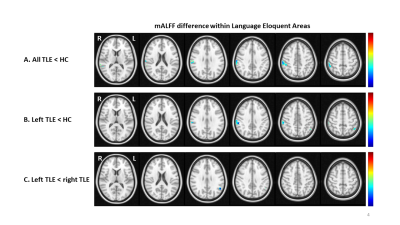
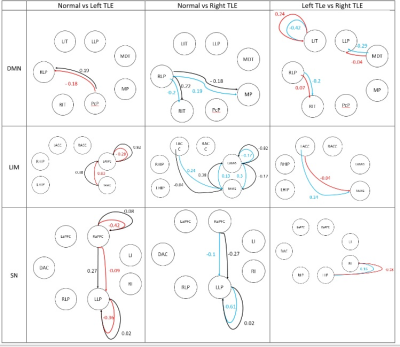
Figure
1: The mALFF difference within language eloquent areas among
groups (A) all TLE
patients and HCs. (B) left TLE and HCs; (C) left TLE
and right TLE patients. The significant difference was defined as
voxel-wise uncorrected p < 0.008, cluster-wise corrected p < 0.05 and
cluster-size > 73 voxels. L:
left hemisphere; R: right hemisphere. Hot color refers to increased mALFF and
cold color refers to decreased mALFF.
-
Volumetric and connectivity profile of regional thalamic abnormality in amyotrophic lateral sclerosis
Sicong Tu1, Marion Sourty2, Fernando Calamante1, Manojkumar Saranathan3, Ricarda Menke4, Kevin Talbot4, Matthew Kiernan1, and Martin Turner4
1The University of Sydney, Sydney, Australia, 2Université de Strasbourg, Strasbourg, France, 3University of Arizona, Tucson, AZ, United States, 4University of Oxford, Oxford, United Kingdom
In ALS, thalamic
volume is reduced in medial, ventral, and posterior regions, while connectivity
was altered in the anterior region. Connectivity of the mediodorsal nuclei correlated
with disease duration and progression rate, and ventral lateral nuclei with
upper motor neuron dysfunction.
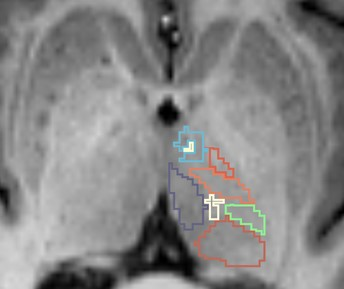
Figure 1. Representative thalamic nuclei segmentation using the
THOMAS pipeline on an individual T1 image.
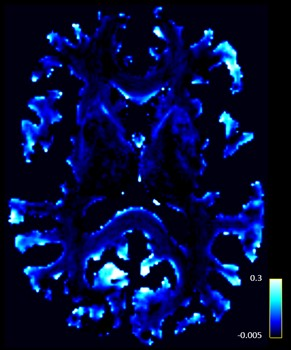
Figure 2. Representative
track-weighted static functional connectivity map for an individual
participant.
-
Brain amplitude of low frequency fluctuation alterations in optic neuritis patients: a 3-year follow-up study
Jing Huang1, Juan Wei2, and Jie Lu1
1Xuanwu Hospital, Capital Medical University, Beijng, China, 2GE Healthcare, MR Research, Beijng, China
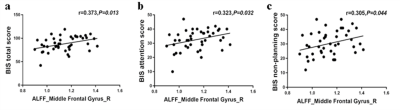
The amplitude of low frequency fluctuation
(ALFF) in middle temporal gyrus and middle frontal gyrus
might play important role in the prognosis of visual acuity in optic neuritis, which
might be used as a potential imaging marker
to predict the outcome of visual acuity.
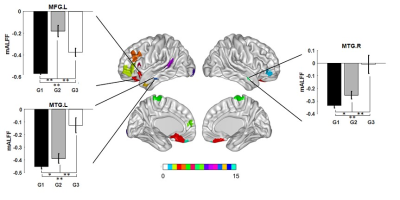
The differences in
ALFF among three groups. G1: healthy control group, G2: ON patients with good visual outcome,
G3: ON patients with poor visual outcome. Significantly
decreased mALFF were observed in left cuneus and left middle occipital gyrus,
right paracentral lobule,
right anterior cingulate cortex, and
bilateral middle temporal gyrus, left middle frontal gyrus in ON
patients than HCs. While increased mALFF
were occurred in several
regions in the frontal and temporal lobes (P< 0.001, FDR corrected).
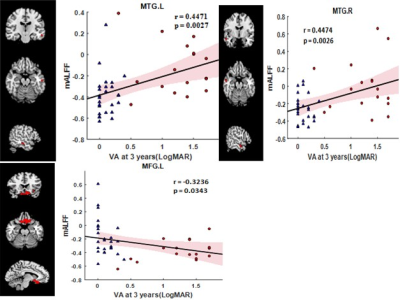
The correlations between the VA and ALFF in ON. The positive correlations were found
in bilateral
middle temporal gyrus and significantly negatively
related to ALFF in left middle frontal gyrus.
-
Altered Resting State Dynamic Functional Connectivity of the Precuneus Contributes to Cognition and Depression in Neuromyelitis Optica
Paola Valsasina1, Laura Cacciaguerra1,2,3, Damiano Mistri1, Vittorio Martinelli2, Massimo Filippi1,2,3,4,5, and Maria A. Rocca1,2,3
1Neuroimaging Research Unit, Division of Neuroscience, IRCCS San Raffaele Scientific Institute, Milan, Italy, 2Neurology Unit, IRCCS San Raffaele Scientific Institute, Milan, Italy, 3Vita-Salute San Raffaele University, Milan, Italy, 4Neurorehabilitation Unit, IRCCS San Raffaele Scientific Institute, Milan, Italy, 5Neurophysiology Service, IRCCS San Raffaele Scientific Institute, Milan, Italy
In neuromyelitis optica
spectrum disorders, abnormal dynamic functional connectivity of the precuneus
with several cortico-subcortical regions was observed. Increased dynamic
functional connectivity correlated with depression and cognitive deficits.
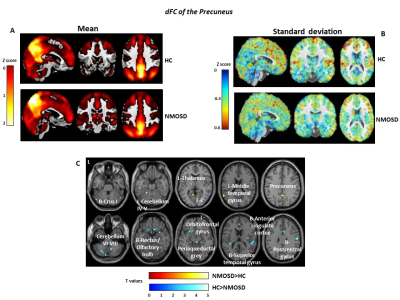
Figure
1. Mean (A) and
standard deviation (B) of precuneus dyamic functional connectivity (dFC) across
windows in healthy controls (HC) and neuromyelitis optica spectrum disorder
(NMOSD) patients. Voxel-wise comparisons of standard deviation (C) between HC
and NMOSD (age- and sex-adjusted full factorial models). Significant results
are shown in red-yellow (NMOSD>HC) and blue-light blue (HC>NMOSD).
B=bilateral; L=left; R=right.
-
Pathological changes in subcortex disrupt cortical synchronization and metastability affecting cognitive function in Parkinson’s disease
Cheng Zhou1 and Minming Zhang1
1Zhejiang University, Hangzhou, China
Diminished dopaminergic function and the pathological changes in thalamus related structures responsible for decreased cortical synchronization and metastability, further affect cognitive function in Parkinson’s disease.
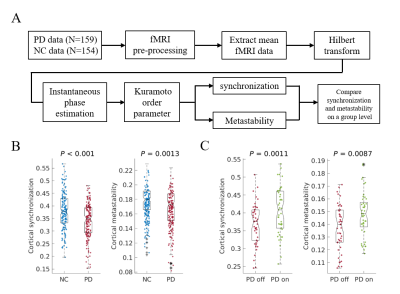
Procedure
Flowchart illustrating the different steps of analysis with the fMRI data and
its results. (A)
An overview of the adapted analysis
paradigm in this study. (B) Cortical synchronization and metastability in
normal controls (NC) and Parkinson’s disease patients (PD). (C) Cortical
synchronization and metastability in Parkinson’s disease in both the OFF and ON
states.
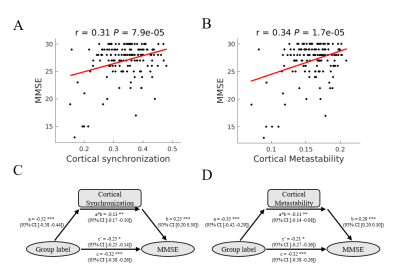
Relationship between cortical synchronization and metastability and MMSE score. (A) Relationship between cortical synchronization of fMRI BOLD signal and MMSE score. (B) Relationship between cortical metastability of fMRI BOLD signal and MMSE score. Mediation model using group label as the predictor, cortical synchronization (C) and metastability (D) as the mediators, and MMSE score as the dependent variable. Group labels are categorical label of normal controls (NC) and PD, where NC were set as 0, PD were set as 1. ** P < 0.05, ** P <.01, *** P < 0.001.
-
Aberrant spontaneous low-frequency brain activity in patients with subjective cognitive decline: A resting-state fMRI study
Yin Tang1, Ling Zhang1, Yi Zhu2, Hongyuan Ding1, Yaxin Gao2, Long Qian3, Weiqiang Dou3, and Ming Qi1
1Radiology department, The First Affiliated Hospital of Nanjing Medical University, Nanjing, China, 2Rehabilitation Department, The First Affiliated Hospital of Nanjing Medical University, Nanjing, China, 3MR Research China, GE Healthcare, Beijing, China
In this study ALFF changes have been investigated for patients with SCD ,MCI and HCs. Lower ALFF values have been found at the right supramarginal gyrus, left precuneus and right supplementary motor area for SCD and MCI patients than HCs and the ALFFs also showed correlations with clinical scales.
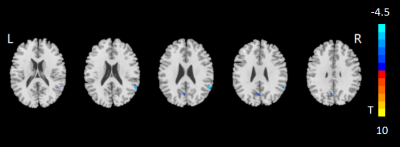
Figure 1. Lower ALFF values at the right supramarginal gyrus and left precuneus
region in MCI than HC.
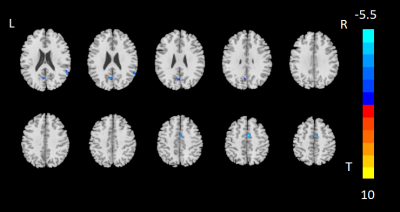
Figure 2. The ALFF values in SCD group were significantly lower than those in HC group for the right supramarginal gyrus, left precuneus and right supplementary motor area.
-
The changes of regional homogeneity and voxel-mirrored homotopic connectivity in Preschool Children with sensorineural hearing loss: a resting-state fMRI
Yi Yin1, Houyu Zhao2, Guiquan Shen1, Mingming Huang1, Xiaoxu Zhang1, Yawen Liu1, Lisha Nie3, and Hui Yu1
1Department of Imaging, Affiliated Hospital of Guizhou Medical University, Gui yang, China, 2Department of Otorhinolaryngology, Affiliated Hospital of Guizhou Medical University, Gui yang, China, 3GE Healthcare, MR Research, Beijing, China
The
purpose of this study is to investigate the abnormal changes of cerebral
functional connections in preschool deafness by using the methods of regional homogeneity(ReHo) and voxel
mirror homology connectivity(VMHC). ReHo and VMHC were used to evaluate the
changes of effective functional connections of the brain from local and global
perspectives respectively.
It provides a reliable method for study and understand the neuropathological
mechanism of SNHL cortical reorganization.
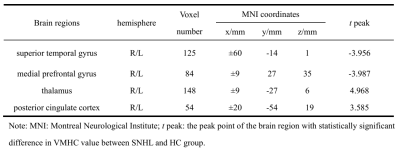
Table 2 Statistical table of brain regions with VMHC
differences between patients with SNHL(n=42) and HC group(n=32).
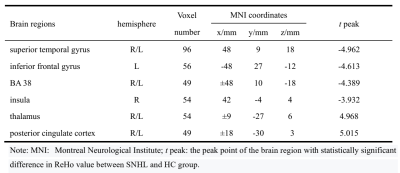
Table 1 The statistical
table of brain regions with ReHo differences between patients with SNHL(n=42)
and HC group(n=32).
-
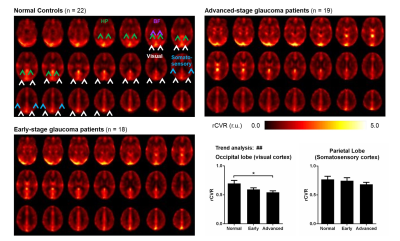
Alterations of the sleep-regulating systems in glaucoma
Ji Won Bang1, Carlos Parra1, Gadi Wollstein1, Joel S Schuman1, and Kevin C Chan1,2
1Department of Ophthalmology, New York University Grossman School of Medicine, New York, NY, United States, 2Department of Radiology, New York University Grossman School of Medicine, New York, NY, United States
Glaucoma patients exhibited altered functional connectivity between the subcortical sleep-inducing hub, the subcortical arousal system, and the occipital cortex. The occipital cortex also showed reduced GABA, suggestive of impaired inhibitory function.
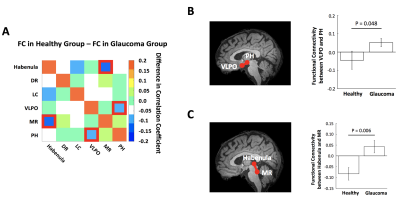
Figure 2. (A) Heatmap showing differences in functional connectivity (FC) (healthy – glaucoma). Red boxes indicate changes in FC that reach significance (P<0.05). FC of VLPO and PH and that of habenula and MR are greater in glaucoma patients than healthy controls. (B) FC between VLPO and PH in healthy vs. glaucoma. (C) FC between habenula and MR in healthy vs. glaucoma. Error bars indicate SEM. (Healthy group: N=22; Glaucoma group: N=38)
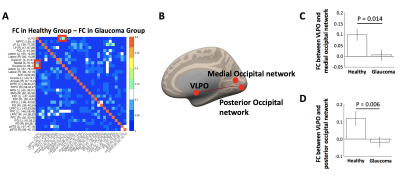
Figure 3. (A) Heatmap showing differences in functional connectivity (FC) (healthy – glaucoma). Red boxes indicate changes in FC that reach significance (P<0.05). FC between VLPO and medial or posterior occipital network is greater in healthy controls than glaucoma patients. (B) Sagittal view showing VLPO, medial and posterior occipital networks. (C) FC between VLPO and medial occipital network in healthy vs. glaucoma. (D) FC between VLPO and posterior occipital network in healthy vs. glaucoma. Error bars indicate SEM. (Healthy group: N=22; Glaucoma group: N=38)
-
Multi-scale sex difference of brain function in Alzheimer’s disease
Zhengshi Yang1,2, Cieri Filippo1, Xiaowei Zhuang1,2, Marwan Sabbagh1, Jefferson W. Kinney2, Jeffrey L. Cummings2, Dietmar Cordes1,2,3, and Jessica Z.K. Caldwell1
1Cleveland Clinic Lou Ruvo Center for Brain Health, Las Vegas, NV, United States, 2University of Nevada Las Vegas, Las Vegas, NV, United States, 3University of Colorado Boulder, Boulder, CO, United States
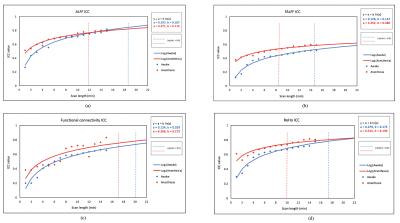
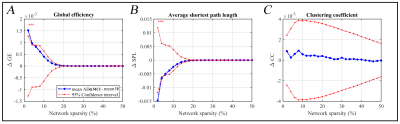
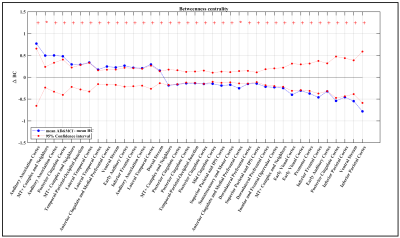
Opposite network topological changes were observed from cognitively normal to MCI, and more rapid progression occurred in women than men from MCI to AD. The occipital lobe contributed more in men but frontal lobe contributed more in women in disease progression.
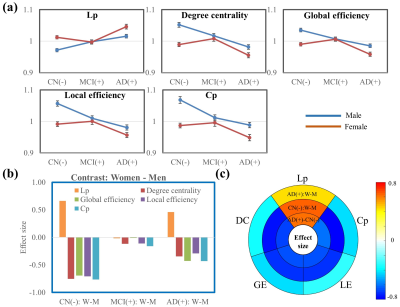
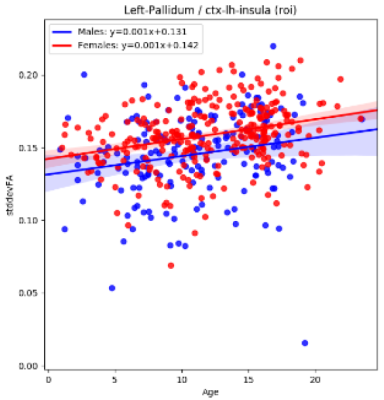
Figure 1. Graph
theory analysis at the global level. (a). Curves of the five global network
metrics from CN to MCI towards AD dementia. (b). Sex difference in CN, MCI, and
AD groups. (c). Effect size of the five global network metrics for the
contrasts AD dementia – CN (both women and men together), CN: Women – Men, and
AD dementia: Women – Men. The sex differences in both CN and AD dementia groups
are observed to be similar to the group differences between the AD dementia and
CN groups.
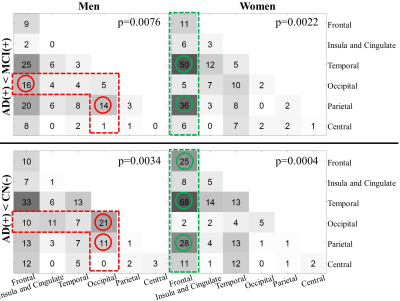
Figure
3. Summary of the edges in the significant clusters of contrast AD dementia
< MCI (top panel) and AD dementia < CN (bottom panel). Men and women
subjects are analyzed separately. The circles are used to mark the location
where women and men, for the same between-group contrast, have the difference
of the number of edges more than 10 (red: men>women; green: women>men).
-
Resting-State Functional Connectivity Predicts Cognitive Impairment Related to Type 2 Diabetes Mellitus
An ping Shi1 and Xi yang Tang2
1Department of Radiology & Functional and Molecular Imaging Key Lab of Shaanxi Province, Department of Radiology & Functional and Molecular Imaging Key Lab of Shaanxi Province, Tangdu Hospital, Fourth Military Medical University (Air Force Medical University), Xi'an, Shaanxi, China, 2Department of thoracic surgery, Tangdu Hospital, Air Force Medical University., Xi'an, China
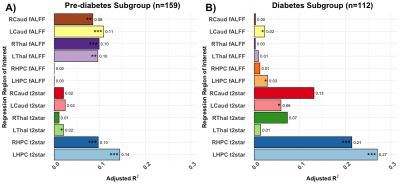
We find that, the identified
connectome-based predictive model, based on whole-brain RSFC patterns, are
strong for predicting the MoCA scores in T2DM. The application of CPM to predict
neurocognitive abilities can bring significant clinical benefits to patient
management.
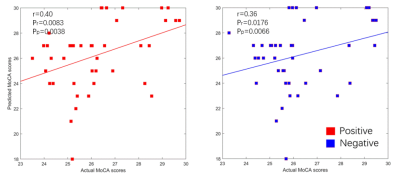
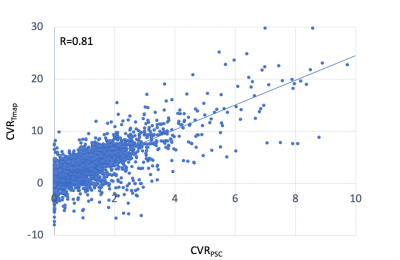
Figure 1. CPM predicts the MoCA scores from
T2DM. Scatterplot of predicted MoCA scores vs actual MoCA scores. Predicted
scores were generated using edges positively correlated with prediction
(positive network) and negatively correlated with prediction (negative network).
r, r value of Pearson's correlation between predicted MoCA scores and actual MoCA
scores. Pr, P values of Pearson's correlation between predicted MoCA scores and
actual MoCA scores. Pp: p values obtained from
permutation tests (5000 times).