-
Quadrupole moment splittings observed in 7T deuterium magnetic resonance spectra of skeletal muscle
Ayhan Gursan1, Martijn Froeling1, Arjan D. Hendriks1, Dimitri Welting1, Dennis W.J. Klomp1, and Jeanine J. Prompers1
1Department of Radiology, University Medical Center Utrecht, Utrecht, Netherlands
Anisotropic
motional averaging in skeletal muscle leads to deuterium quadrupole moment
splittings of the HDO signal, the size of which depends on the angle between
the muscle fibers and B0.
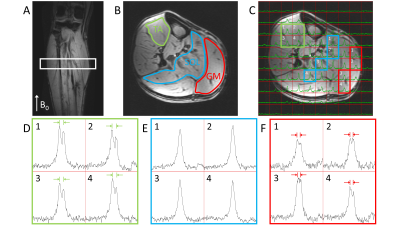
Figure 1. Natural abundance DMRSI data in the right lower leg positioned
parallel with B0. (A) Coronal T1w image. The white rectangle
indicates the slice shown in panels B and C. Transversal T1w image with (B)
segmentation of Tibialis Anterior (TA), Soleus (SOL) and Gastrocnemius Medialis
(GM) muscles, and (C) overlaid with DMRSI data. Spectra from selected voxels in
TA (D), SOL (E) and GM (F), as indicated in panel C, showing the signal from
HDO at 4.7 ppm (x-axis range: 0-10 ppm = 457 Hz).
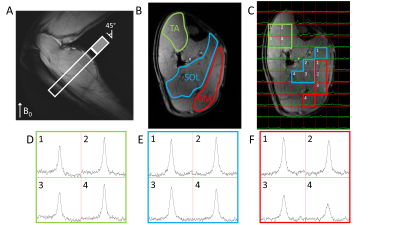
Figure 3. Natural abundance DMRSI data in the right lower leg positioned at an angle of approximately 45° with respect to B0. (A) Sagittal T1w image. The white rectangle indicates the slice shown in panels B and C (cropped in AP direction to size of open part of rectangle). Transversal T1w image with (B) segmentation of TA, SOL and GM muscles, and (C) overlaid with DMRSI data. Spectra from selected voxels in TA (D), SOL (E) and GM (F), as indicated in panel C, showing the signal from HDO at 4.7 ppm (x-axis range: 0-10 ppm = 457 Hz).
-
Brain Metabolic Heterogeneity Revealed by Inorganic Phosphate (Pi): The Puzzling Line Broadening and Splitting of Pi Magnetic Resonance at 7T
Jimin Ren1,2, Craig R Malloy1,2, and Dean Sherry1,2
1Advanced Imaging Research Center, UT Southwestern Medical Center, Dallas, TX, United States, 2Department of Radiology, UT Southwestern Medical Center, Dallas, TX, United States
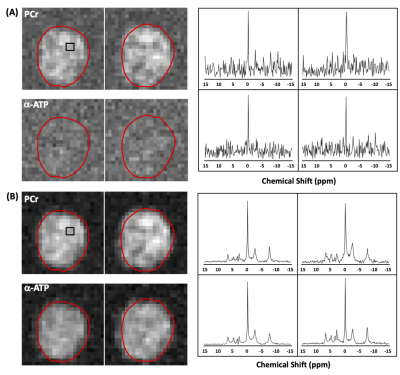
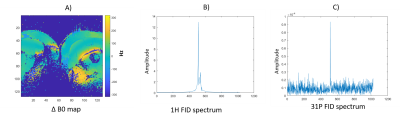
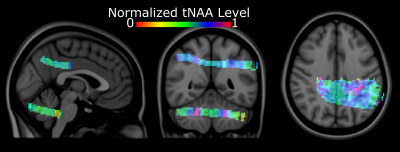
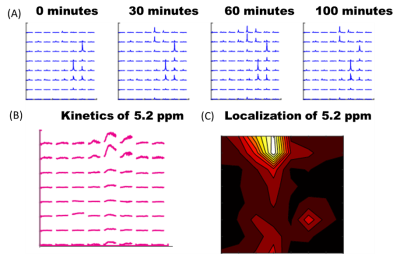
We presented solid evidence of large Pi line-broadening and splitting observed in human brain by 31P MRS at 7T. The effect may reflect pH heterogeneity in different brain tissues and/or cell types with distinct metabolism.
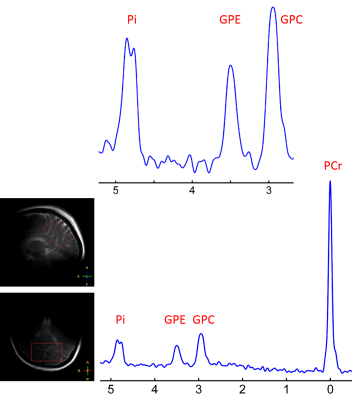
Fig1. 7T 31P MR spectrum acquired from the occipital-parietal region of a 30 years old female using a partial volume coil. Note that the intracellular Pi signal is split into two separate peaks with 0.1 ppm difference in chemical shift.
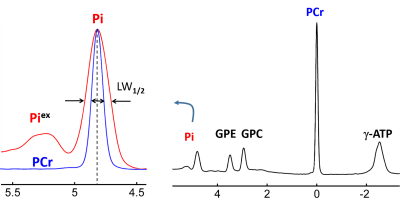
Fig 3. 7T 31P MR spectrum averaged over eight healthy subjects. The data were acquired from the posterior brain using a partial volume coil. Note that the nearly symmetric line-broadening at Pi in reference to PCr (blue trace).
-
Monitoring liver glucose uptake and metabolism with dynamic 3D deuterium metabolic imaging at 7T
Ayhan Gursan1, Arjan D. Hendriks1, Dimitri Welting1, Dennis W.J. Klomp1, and Jeanine J. Prompers1
1Department of Radiology, University Medical Center Utrecht, Utrecht, Netherlands
Dynamic 3D
deuterium metabolic imaging with oral administration of deuterated glucose allows
non-invasive and spatially resolved assessment of the dynamics of hepatic
glucose uptake and metabolism.
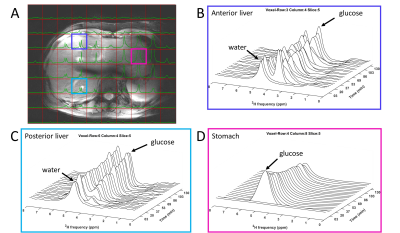
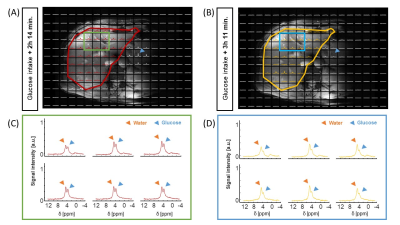
Figure 1. 3D
DMI measurements at baseline and 0-130 min after oral administration of [6,6’-2H2]glucose (scan
1). (A) Overlay of last DMI data
set (130 min) on transversal Dixon water image, with equal scaling of all
spectra. (B-D) DMI spectra at baseline and up to 130 min after intake of
deuterated glucose from voxels in the anterior (B) and posterior (C) side of
the liver and the stomach (D).
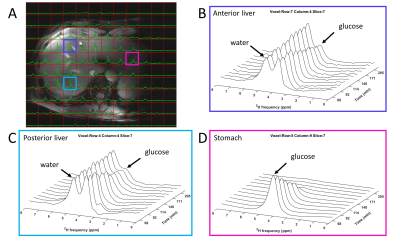
Figure 3. 3D DMI measurements 68-205 min after oral administration of [6,6’-2H2]glucose (scan
2). (A) Overlay
of a DMI data set (160 min after intake) on transversal Dixon water image, with
equal scaling of all spectra. (B-D) DMI spectra recorded from 68-205 min after
intake of deuterated glucose from voxels in the anterior (B) and posterior (C) side
of the liver and the stomach (D).
-
Precision and Reliability of Metabolite Quantification of 31P MRS at 7T
Jia Xu1, Rolf F. Schulte2, William R. Kearney1, and Vincent A. Magnotta1,3,4
1Radiology, University of Iowa, Iowa City, IA, United States, 2GE Global Research, Munich, Germany, 3Psychiatry, University of Iowa, Iowa City, IA, United States, 4Biomedical Engineering, University of Iowa, Iowa City, IA, United States
The peak integration by
simple summation of the magnitude spectrum is the most sensitive and robust 31P
MRS quantification method to detect small ATP concentration changes. The
test-retest repeatability of in-vivo ATP quantification is less than 3%.
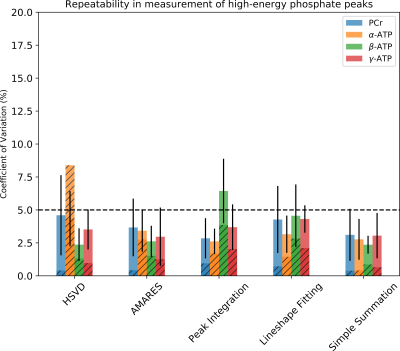
Figure 3. Interscan test-retest repeatability of PCr, α-ATP, β-ATP, and γ-ATP
peaks from quantitative, non-localized 31P MRS of 7 human subjects.
The corresponding CVs estimated by Monte Carlo Simulation are shown in hatched
bars. The dashed horizon line represents a 5% threshold.
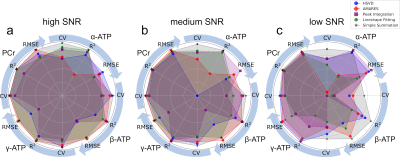
Figure 2. Comparison of Trueness
(RMSE), linearity (R2), and relative uncertainty (CV) of α-ATP,
β-ATP, γ-ATP, and PCr peaks quantified by HSVD, AMARES, conventional peak
integration, lineshape fitting, and simple summation. The RMSE, R2, and CV values
are normalized to (0, 1) range so that the reference point (center) represents
the worst performance (0) and the circle represents the best performance (1).
The normalized RMSE, R2, and CV values of α-ATP, β-ATP, γ-ATP, and
PCr peaks are distributed evenly along the angular axes (circle).
-
31P dual-band pulse for selective refocusing of phosphomonoesters and phosphodiesters at low B1+ and low SAR
Zahra Shams1, Evita C. Wiegers1, Wybe J.M. van der Kemp1, Dennis W.J. Klomp1, and Jannie P. Wijnen1
1Department of radiology, University Medical Center Utrecht, Utrecht, Netherlands
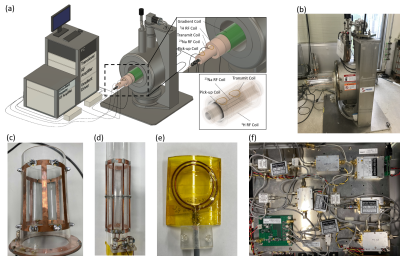
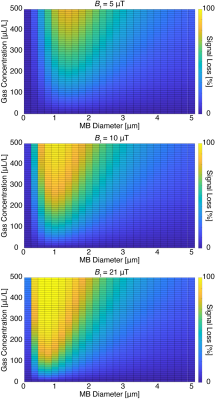
We designed a dual-band pulse to selectively
refocus PME and PDE spins. The dual band pulse, with B1+ <
15µT, uses almost 3 times less power compared
to a single band pulse, making this an attractive option for multi-echo 31P
body MRSI in cancer.
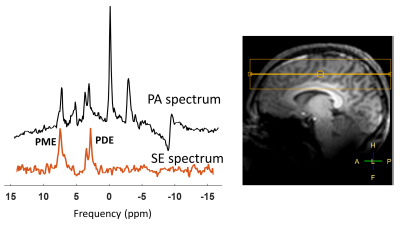
Figure 3. The spectra acquired in vivo from a pulse acquire and
a spin echo acquisition with the dual band pulse aimed to hit the PDE and PME
spin groups from the entire head, where B0 shimming is optimized over the
yellow box. All MR spectra were displayed using a 10‐Hz Lorentzian
line‐broadening filter. Note the well refocused signals of PME and PDE.
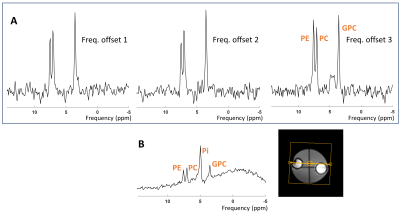
Figure 2. Spectra acquired from a phantom with a spin echo (A)
and a pulse acquire (B) acquisition. The dual band pulse at the frequency
offset 3 resulted in a full refocusing of the three peaks of PE, PC and GPC.
All MR spectra were displayed using a 10‐Hz Lorentzian line‐broadening filter.
The yellow box is the shim box.
-
Multi-Centre patients receiving lithium treatment for bipolar disorder: 7Li-MRI optimization using a physiologically representative phantom
Karthik Chary1, Franck Mauconduit2, Fiona Smith1, Marie Chupin3, Emmanuelle Gourieux2,3, Laura Pelizzari4, Karen Kettless5, Kristoffer Brendstrup-Brix6, Eva Mezger7, Daniel Keeser7, Olaf Dietrich8, Tim Wesemann9, Philipp Ritter10, Annett Werner9, Letizia Squarcina11, Paolo Brambilla11,12, Frank Bellivier13, Fawzi Boumezbeur2, David Cousins1,14, and Pete Thelwall1
1Translational and Clinical Research Institute, Newcastle Magnetic Resonance Centre, Newcastle University, Newcastle upon Tyne, United Kingdom, 2NeuroSpin, CEA, CNRS, Paris-Saclay University, Gif-sur-Yvette, France, 3CATI, Institut du Cerveau et de la Moëlle Epinière, Paris, France, 4IRCCS, Fondazione Don Carlo Gnocchi ONLUS, Milan, Italy, 5Siemens Healthcare A/S & Siemens Healthcare GmbH, Copenhagen, Denmark, 6Neurobiology Research Unit (NRU) at Copenhagen University Hospital Rigshospitalet, Copenhagen, Denmark, 7Department of Psychiatry and Psychotherapy, University Hospital, LMU University, Munich, Germany, 8Department of Radiology, University Hospital, LMU Munich, Munich, Germany, 9Institute and Clinic of Diagnostic and Interventional Neuroradiology, University Hospital, Carl Gustav Carus, Dresden, Germany, 10Department of Psychiatry, University Hospital Carl Gustav Carus, Technische Universität Dresden, Dresden, Germany, 11Department of Pathophysiology and Transplantation, University of Milan, Milan, Italy, 12Department of Neurosciences and Mental Health, Fondazione IRCCS Ca' Granda Ospedale Maggiore Policlinico, Milan, Italy, 13INSERM UMRS-1144, AP-HP, Saint-Louis - Lariboisière – F. Widal Hospitals, Paris, France, 14Regional Affective Disorders Service, Cumbria, Northumberland, Tyne and Wear NHS Foundation Trust, Newcastle Upon Tyne, United Kingdom
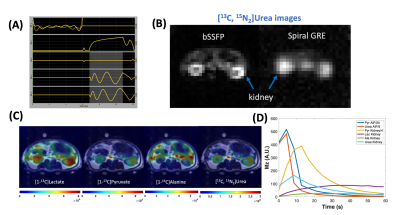
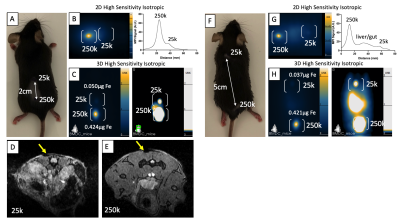
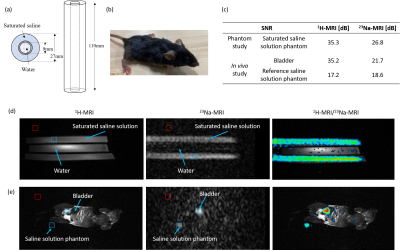
We demonstrated good agreement between modelling and phantom acquisitions
to maximize 7Li-MRI signal amplitude which showed minimal inter-site
variation in signal-to-noise to facilitate multi-centre studies of lithium
treatment in bipolar disorder.
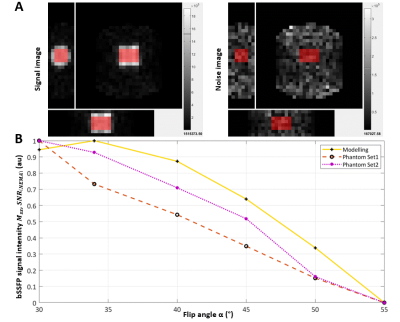
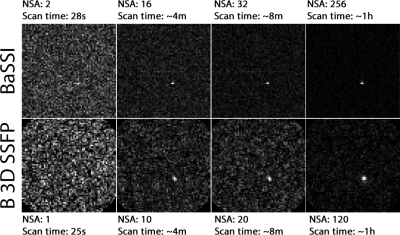
Figure 2. Modelling vs phantom validation. A) SNR was computed on magnitude images using an identically positioned ROI (red block) on a signal and pure noise image according to the NEMA standard method. Parameters: TR=6.5 ms, TE=3.0 ms, NSA=217, recon matrix=32x32x7, recon voxel size=21.88x21.88x25 mm3, acquisition time=5 min. The Philips bSFFP sequence incorporated an elliptical shutter. B) Slight variation in the profile of the bSSFP signal amplitude versus flip angle was observed when comparing the theoretical modelling to the phantom tests.
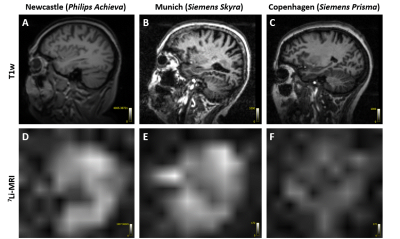
Figure 3. Pilot in vivo acquisitions. T1w images displayed for anatomical reference (A-C),
7Li-MRI images showing the 7Li distribution in the brain (D-F).
The 7Li-MRI in vivo images acquired from three different test
patients showed signal variations across multiple sites. The Philips data was
interpolated to 21.88x21.88x25 mm3.
-
Simultaneous acquisition of 1H/19F/23Na/31P MR imaging in Phantom at 3T using a quadruple-nuclear RF coil system
Nan Li1,2, Xing Yang1,2, Feng Du1,2, Kang Yan3, Bei Liu3, Yiping Du3, Chunsheng Yang4,5, Zhi Zhang4,5, Li Chen4,5, Fang Chen4,5, Xiaoliang Zhang6, Xin Liu1,2, Hairong Zheng1,2, and Ye Li1,2
1Lauterbur Imaging Research Center, Shenzhen Institutes of Advanced Technology, Chinese Academy of Sciences, Shenzhen, China;, shenzhen, China, 2Key Laboratory for Magnetic Resonance and Multimodality Imaging of Guangdong Province, Shenzhen, China, Shenzhen, China, 3Institute for Medical Imaging Technology, School of Biomedical Engineering, Shanghai Jiao Tong University, Shanghai, China., Shanghai, China, 4State Key Laboratory of Magnetic Resonance and Atomic and Molecular Physics, Wuhan Center for Magnetic Resonance, Innovation Academy for Precision Measurement Science and Technology, the Chinese Academy of Sciences, Wuhan 430071, China;, Wuhan, China, 5University of Chinese Academy of Science, Beijing 100049, China, Wuhan, China, 6Department of Biomedical Engineering, State University of New York at Buffalo, NY, United States, Buffalo, NY, United States
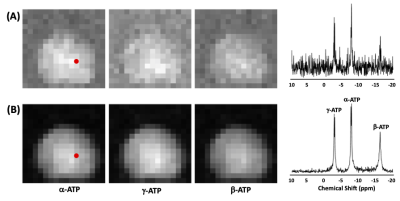
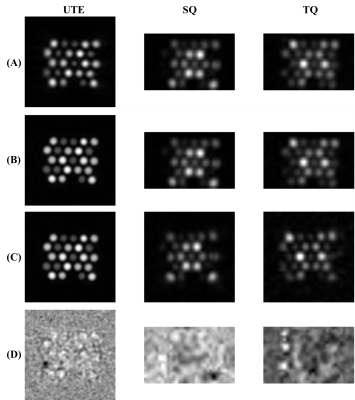
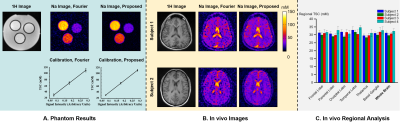
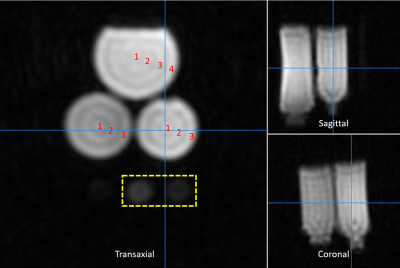
Imaging tests were performed to demonstrate the
feasibility of synchronized 1H / 19F / 23Na/ 31P MR imaging at 3T by
using developed quadruple-nuclear RF coil. The imaging approach combined with
triple-tuned 19F / 23Na/
31P receive coil also
indicated the improved SNR.
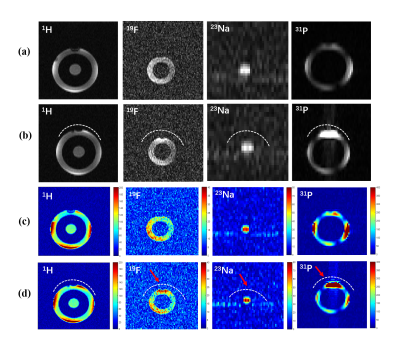
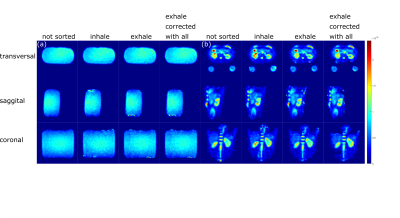
Fig. 3.
(a)-(b): The 1H/19F/23Na/31P MR
measured images obtained with the specific phantom. (a) only
scanned by using the quadruple-nuclear RF coil. (b) Combined the
quadruple-nuclear coil and triple tuned local 19F/23Na/31P
receive coil. (c)-(d): SNR maps for the 1H/19F/23Na/31P
imaging. (c) Without the local triple-tuned RF coils. (d) Combined with the local triple-tuned 19F/23Na/31P
receive RF coils. The position of the local
receive RF coil was indicated by the white dotted-line, and the SNR of the
region indicated by the red arrow is significantly improved.
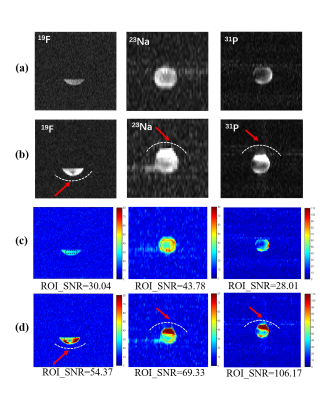
Fig. 4.
(a)-(b): The 1H/19F/23Na/31P MR
measured images obtained with the independent
nuclide test phantom. (a) only
scanned by using the quadruple-nuclear RF coil. (b) Combined the
quadruple-nuclear coil and triple tuned local 19F/23Na/31P
receive coil. (c)-(d): SNR maps for the 1H/19F/23Na/31P
imaging. (c) Without the local triple-tuned RF coils. (d) Combined with the local triple-tuned 19F/23Na/31P
receive RF coils. The position of the local
receive RF coil was indicated by the white dotted-line, and the SNR of the
region indicated by the red arrow is significantly improved.
-
Sodium NMR relaxation times of human skin as potential biomarkers for Type 2 Diabetes Mellitus
Daria V Fomina1,2, Elnur G Sadykhov3, Petra Hanson4,5, Christopher J Philp1, Harpal S Randeva4,5, J Paul O'Hare4,5, Olga S Pavlova3,6, Nikolay V Anisimov6, Alexander M Makurenkov3, Yury A Pirogov3, Thomas M Barber4,5, Thomas Meersmann1, and Galina E Pavlovskaya1,2
1SPMIC, School of Medicine, University of Nottingham, Nottingham, United Kingdom, 2NIHR Nottingham Biomedical Research Centre, University of Nottingham, Nottingham, United Kingdom, 3Faculty of Physics, Lomonosov Moscow State University, Moscow, Russian Federation, 4Warwick Medical School, University of Warwick, Coventry, United Kingdom, 5Warwickshire Institute for the Study of Diabetes Endocrinology and Metabolism, University Hospitals Coventry and Warwickshire, Coventry, United Kingdom, 6Faculty of Fundamental Medicine, Lomonosov Moscow State University, Moscow, Russian Federation
Investigation of 23Na NMR relaxation times, T2short and T2long, in human skin samples from control and T2DM patients using 23Na MRS at 9.4T has shown a significant elongation of T2long in T2DM patients that might indicate to disease specific skin structure changes.
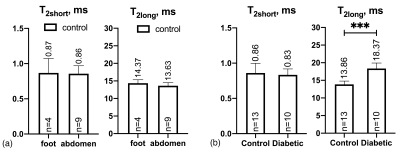
Figure 2. Sodium T2short and T2long obtained from bi-exponential fitting of CPMG (a) for samples collected from the foot/leg and abdomen from control patients and (b) for all samples from control and diabetic patients (samples from foot/leg and abdomen from control patients are presented together in one control group). ***P-value<0.001.
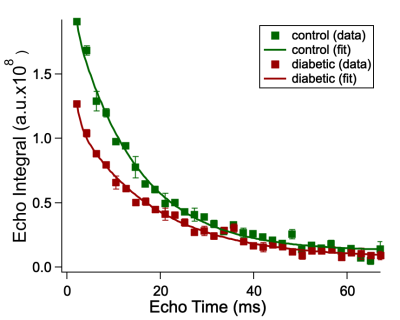
Figure 1. Sodium CPMG echo integrals of the foot/leg skin samples from control (green) and diabetic (red) patients as a function of echo time (TE). Squares represent experimental data; solid lines correspond to the calculated fitting function.
-
Accuracy of quantified 23Na MRI in ischemic Stroke with varying undersampling Factors and CNN Postprocessing
Anne Adlung1, Nadia Karina Paschke1, Alena-Kathrin Golla1,2, Dominik Bauer1,2, Sherif Mohamed3, Melina Samartzi4, Marc Fatar4, Eva Neumaier Probst3, Frank Gerrit Zöllner1,2, and Lothar Rudi Schad1
1Computer Assisted Clinical Medicine, Medical Faculty Mannheim, Heidelberg University, Mannheim, Germany, 2Mannheim Institute for Intelligent System in Medicine, Medical Faculty Mannheim, Heidelberg University, Mannheim, Germany, 3Department of Neuroradiology, Medical Faculty Mannheim, Heidelberg University, Mannheim, Germany, 4Department of Neurology, Medical Faculty Mannheim, Heidelberg University, Mannheim, Germany
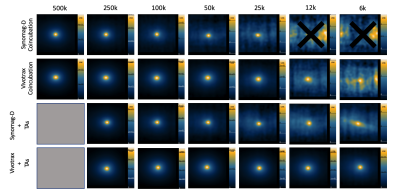
This
study investigates factors of k-space undersampling for which CNN
postprocessing is able to improve 23Na MRI data and results indicate
that it could enable the significant reduction of 23Na MRI data
acquisition time.
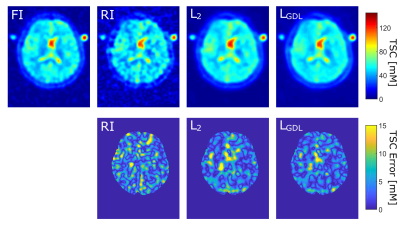
Figure 2: One representative image slice of one
test case
Top: Quantified FI, RI (S = 5) and the CNN output
image with L2 and LGDL.
Bottom: Corresponding TSC error maps within the
whole brain.
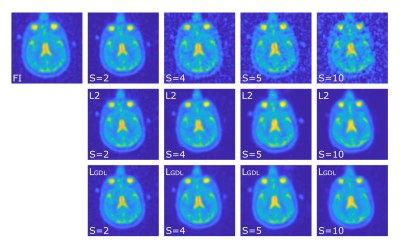
Figure 1:
Representative image slice of one patient in its different versions. Full image
(FI) and reduced images (RI) with varying factors S (2, 4, 5 10), and the
corresponding CNN out images for L2 and LGDL.
-
23Na MRI of mild traumatic brain injury: linear regression analysis reveals decreased total sodium concentration
TERESA GERHALTER1, Anna M. Chen1, Seena Dehkharghani1, Rosermary Peralta1, Fatemeh Adlparvar1, James S. Babb1, Tamara Bushnik2, Jonathan M. Silver3, Brian S. Im2, Stephen P. Wall4, Ryan Brown1, Guillaume Madelin1, and Ivan Kirov1
1Center for Biomedical Imaging, Department of Radiology, New York University Grossman School of Medicine, NEW YORK, NY, United States, 2Department of Rehabilitation Medicine, New York University Grossman School of Medicine, NEW YORK, NY, United States, 3Department of Psychiatry, New York University Grossman School of Medicine, NEW YORK, NY, United States, 4Ronald O. Perelman Department of Emergency Medicine, New York University Grossman School of Medicine, NEW YORK, NY, United States
Using linear regression analysis, total sodium concentrations
(TSC) in global white and grey matter were reduced in mild traumatic brain
injury patients (at one month after injury) compared to healthy controls. TSC
correlated with cognitive testing.
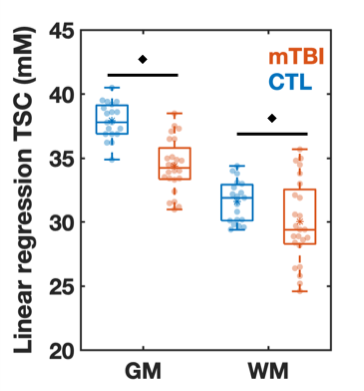
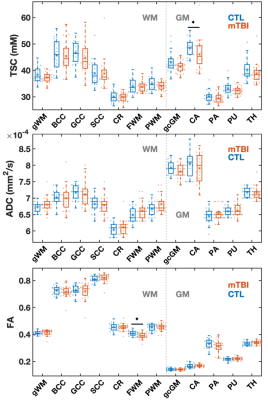
Figure
2: Boxplots of TSC in mTBI and control (CTL) from linear regression
analysis. Boxplots show the 1st, 2nd (median),
and 3rd quartiles (box), ±95% (whiskers), and means (*) of the TSC
distributions of the controls and mTBI patients for global grey and white
matter (GM, WM, respectively) using linear regression. The boxplots excluded
the three elder mTBI patients who lacked an age-matched control. Note that TSC
in the GM and WM was decreased in mTBI when compared to controls (age-adjusted
analysis of covariance, ♦: p<0.05).
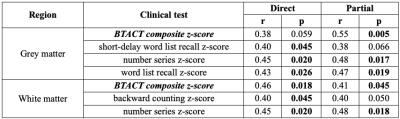
Table 2: Correlations between clinical and TSC measures. Direct and partial
Spearman correlations (r) and p-values are presented for the association of TSC
with the scores from the Brief Test of Adult Cognition by Telephone (BTACT) and
Rivermead Post-Concussion Symptoms Questionnaire (RPQ) without (direct) and
with (partial) adjustment for the elapsed time from injury to imaging,
respectively. Only statistically
significant correlations are shown (p<0.05).
-
Evaluation of different References for the Quantification of Tissue Sodium Concentration in Patients with ischemic Stroke
Anne Adlung1, Sherif Mohamed2, Nadia Karina Paschke1, Mara Berger1, Melina Samartzi3, Marc Fatar3, Achim Gass4, Eva Neumaier Probst2, and Lothar Rudi Schad1
1Computer Assisted Clinical Medicine, Medical Faculty Mannheim, Heidelberg University, Mannheim, Germany, 2Department of Neuroradiology, Medical Faculty Mannheim, Heidelberg University, Mannheim, Germany, 3Department of Neurology, Medical Faculty Mannheim, Heidelberg University, Mannheim, Germany, 4Heidelberg University, Mannheim, Germany
Aim was to evaluate the reliability of internal vs. external references for quantification of tissue sodium concentration. 49 patients with
ischemic stroke were examined. Results indicated high similarity between both reference types.
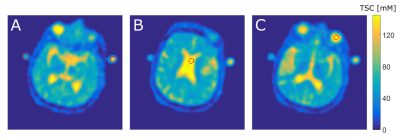
Figure 2: One representative 23Na MRi slice from one patient with the ROI segmentation for the different quantification methods A: vials,
B: CSF, and C: VH.
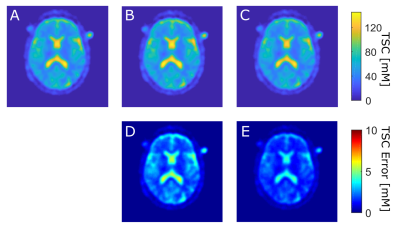
Figure 3: Top row: TSC map from 23Na
MRI of one patient and one exemplary slice with quantification based on A:
reference vials, B: cerebral spinal fluid, C: vitreous humor.
Bottom row: corresponding error
maps of D: absolute TSC difference between A and B and E: absolute TSC difference
between A and C
-
Sodium TQ signal of amino acids and α-lactalbumin in comparison to bovine serum albumin
Dennis Kleimaier1, Simon Reichert1, Victor Schepkin2, and Lothar R. Schad1
1Computer Assisted Clinical Medicine, Heidelberg University, Mannheim, Germany, 2National High Magnetic Field Laboratory, Florida State University, Tallahassee, FL, United States
Glutamic acid, arginine, and lysine as well as the small sized protein α-LA
resulted only in a significant reduction in the sodium relaxation times without
a detectable sodium TQ signal. In contrast, a BSA concentration of 3% w/v was
already sufficient to yield a well detected sodium TQ signal.
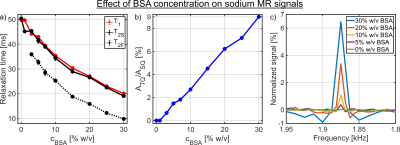
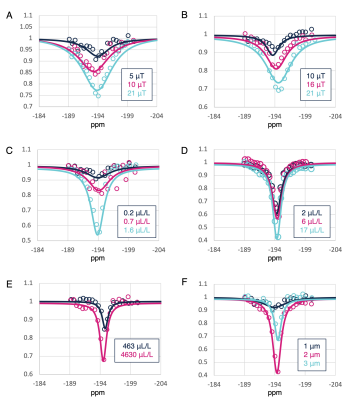
Fig.4: a) Dependence of the longitudinal and the transverse relaxation times on
the BSA concentration. In the samples with a BSA concentration of 0% and 1%
w/v, no sodium TQ signal was observed. Consequently, the TQTPPI FID was only fitted by
a mono-exponential SQ signal decay. B) Dependence of the sodium TQ signal on
the BSA concentration. The sodium TQ signal increased almost linearly with the
BSA concentration. c) Zoomed TQTPPI spectra for different BSA concentrations.
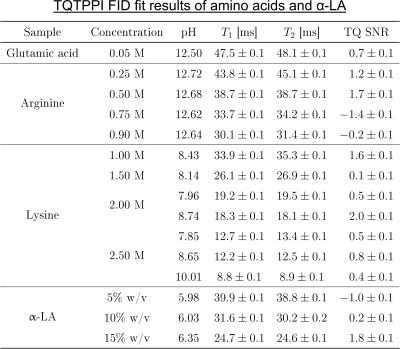
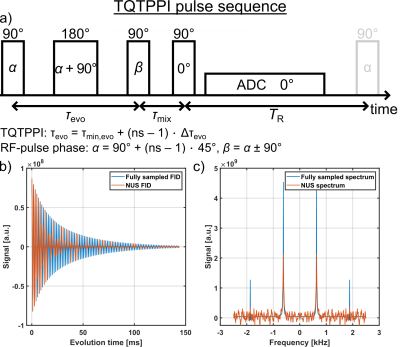
Fig.2: TQTPPI FID fit results of the
samples containing amino acids or α-LA.
The TQ SNR of each sample was less than three and thus the TQ term in the
TQTPPI FID fit function was omitted. Hence, the TQTPPI FID fit function
consisted only of a mono-exponential SQ signal decay. Exemplary TQTPPI spectra
of these samples are shown in Fig.3.
-
Measuring CMRO2 in Brain Subcortical Structures Using Dynamic 17O-MRI
Hao Song1, Burak Akin1, Johannes Fischer1, Ali Caglar Özen1,2, Stefan Schumann3, and Michael Bock1,2
1Dept. of Radiology, Medical Physics, Medical Center University of Freiburg, Faculty of Medicine, University of Freiburg, Freiburg, Germany, 2German Consortium for Translational Cancer Research (DKTK), Partner Site Freiburg, Freiburg, Germany, 3Dept. of Anesthesiology and Critical Care, Medical Center University of Freiburg, Faculty of Medicine, University of Freiburg, Freiburg, Germany
The CMRO2 values were determined in brain
subcortical structures including thalamus, dorsal striatum, caudate nucleus and
insula cortex using dynamic 17O-MRI.
Our
results show the feasibility of measuring local CMRO2 in brain subcortical
structures using 17O-MRI at 3T.
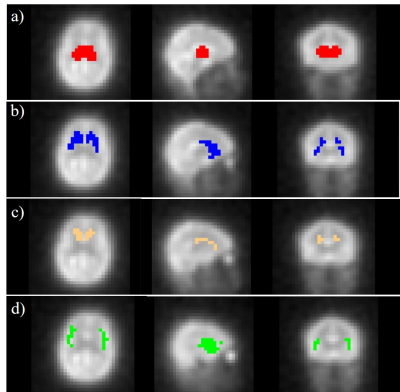
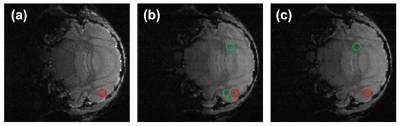
Figure 1. Co-registered masks of ROIs including thalamus (a), dorsal striatum (b), caudate nucleus (c) and
insula (d) superimposed on the averaged 17O MR images.
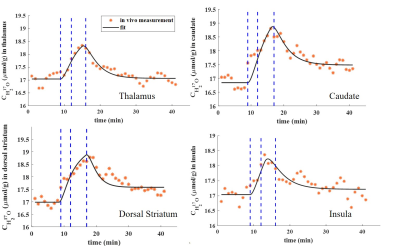
Figure 2. Dynamic H217O concentration (CH217O) in all examined ROIs. Blue dashed lines indicate the 17O2 inhalation time period.
-
MRI visualization of neurogenesis with ferritin and eGFP gene reporters in the intact and post-ischemic rat brain
Marina Y Khodanovich1, Andrey E Akulov2, Tatyana V Anan’ina1, Elena P Krutenkova1, and Anna V Naumova3
1Research Institute of Biology and Biophysics, Tomsk State University, Tomsk, Russian Federation, 2Institute of Cytology and Genetics, Novosibirsk, Russian Federation, 3Radiology, University of Washington, Seattle, WA, United States
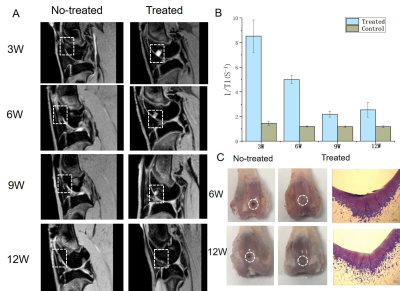
Ferritin
and eGFP expression under doublecortin promoter caused 20% decrease in T2* intensity
in the neurogenic (signal comes from the mature and young neurons) and ischemic
(signal from macrophages) zones in the rat brain.
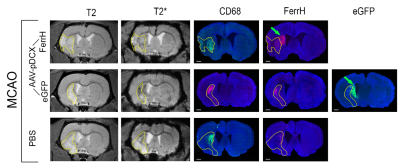
Figure
2. Representative
T2 and T2*-weighted images of the rat brain after MCAO surgery in the day 28
after injection of viral vectors or PBS. Immunofluorescent staining was done for
ferritin (FerrH) and activated microglia/macrophages (CD68). eGFP signal was read at the fluorescent
microscope with a wavelength of 488 nm. Areas of ischemic lesion
were delineated on T2-weighted and propagated to T2*-weighed and to the
histological images. Green arrows point to areas of the transgene expression
near SVZ outside of ischemic lesion.
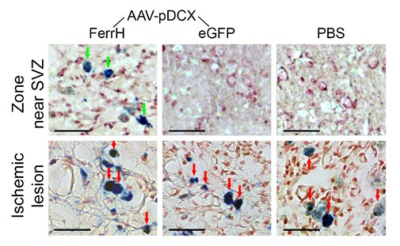
Figure 3. Prussian Blue histological staining
for detection of iron accumulation in the zone near lateral ventricle and SVZ
(top row) and in the ischemic lesion zone (bottom row). Green arrows point to
the cells with iron accumulation in the zone near the SVZ; red arrows point to
the cells with iron accumulation in the ischemic lesion. Scale bar corresponds
to 50 µm.
-
Treatment-induced changes in 2H-labeled lactate measured by 2H magnetic resonance spectroscopy are associated with apoptotic cell death
Josephine L Tan1,2, Daniel Djayakarsana1,2, Hanzhi Wang1,2, Rachel W Chan2, Colleen Bailey1,2, and Angus Z Lau1,2
1Medical Biophysics, University of Toronto, Toronto, ON, Canada, 2Physical Sciences, Sunnybrook Research Institute, Toronto, ON, Canada
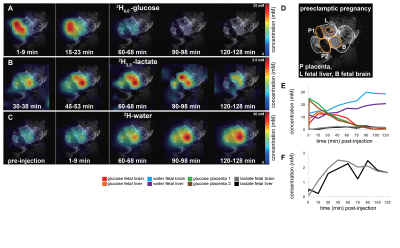
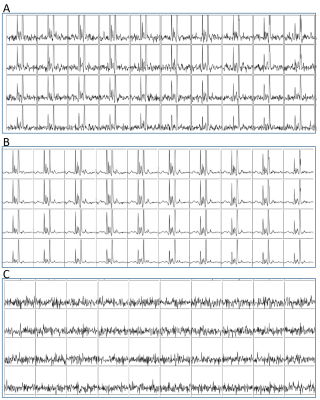
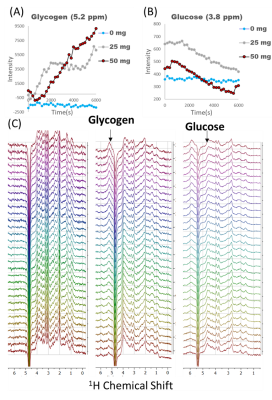
Significant decreases in 2H-labeled lactate signal were detected by deuterium magnetic resonance spectroscopy in acute myeloid leukemia cells 48 hours after cisplatin treatment, and significantly correlated with apoptotic cell death and extracellular lactate concentration.
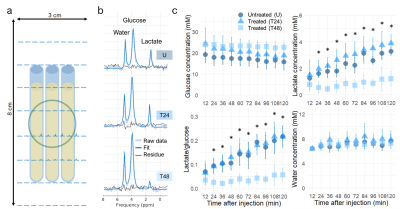
(a) Experimental setup consisting of three AML sample tubes lying on top of the 2H coil (green circle), with overlaid 2H spectra. (b) Single voxel 2H spectra for the untreated (U) and cisplatin-treated samples (T24 and T48) two hours after injection of [6,6’-2H2]glucose. (c) Time course of 2H-labeled species 10 minutes after injection of [6,6’-2H2]glucose. Error bars are the standard deviation across 6 samples. Stars indicate a statistically significance difference between T48 and U, and T48 and T24 (p<0.05)
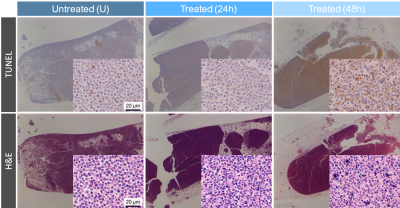
Representative TUNEL and H&E stained sections (10x and 200x magnification) from untreated and cisplatin-treated cell pellets, which were fixed in formalin for at least 96 hours after scanning. Formalin fixation may have caused pellet size shrinkage.
-
Three-compartment modeling for dynamic theragnostic agent enhanced MRI for Quantitative Analysis of NASH progression
Asaduddin Muhammad1, Wonsik Jung2, Sangyong Jon2, and Sung-Hong Park1
1Bio and Brain Engineering, Korea Advanced Institute of Science and Technology, Daejeon, Korea, Republic of, 2Biological science, Korea Advanced Institute of Science and Technology, Daejeon, Korea, Republic of
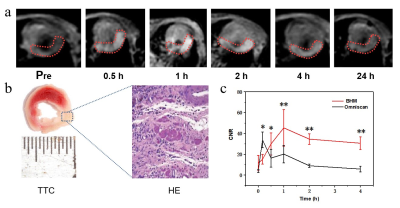
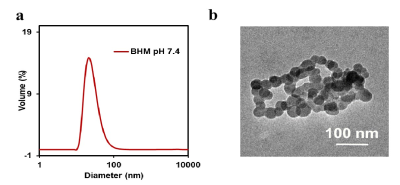
We developed three compartment model to quantify NASH progression through the use of theragnostic drugs and proper kinetic modelling. In particular, parameter k22 linearly correlates with NASH progression. This can be used to prevent further progression into liver disease such as cirrhosis.
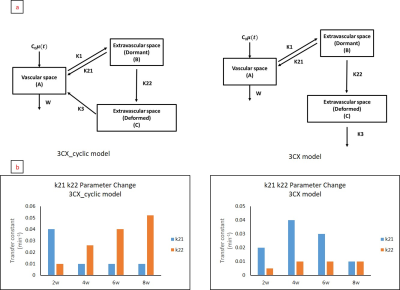
Figure 1. Two
different models tested (Top row) accounting for different circulation
characteristic. Result of fitting (bottom row) using the two different models
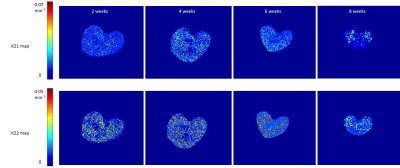
Figure 3
representative k21 and k22 parameter maps from each mice group. all maps from
respective parameter shares the same colorbar range.
-
Dynamic Oxygen-17 MRI with Model-Based Approach for Mapping Cerebral Metabolic Rate of Oxygen in Mouse Brain at 9.4 T
Yuning Gu1, Huiyun Gao2, Kihwan Kim1, Yunmei Wang2, and Xin Yu1,3
1Biomedical Engineering, Case Western Reserve University, Cleveland, OH, United States, 2Medicine, Case Western Reserve University, Cleveland, OH, United States, 3Radiology, Case Western Reserve University, Cleveland, OH, United States
We developed a model-based
approach for CMRO2 mapping in the post-stroke mouse brain with 1.6-mm nominal
resolution at 9.4 T. The method showed
~50% reduced CMRO2 in the infarct core.
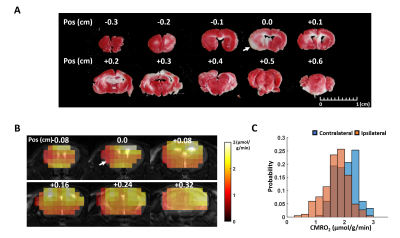
Figure 3. In vivo results. A. TTC staining of the post-stroke mouse
brain. B. CMRO2 maps
overlayed on T2-weighted image.
C. Histogram of CMRO2 values in the ipsilateral and
contralateral hemisphere.
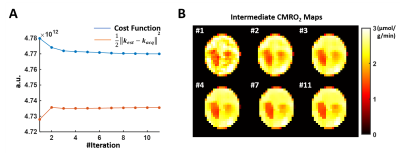
Figure 1. Intermediate results in the
simulation study at high SNR. A. The
entire cost function (blue line) and the error from data consistency term (red
line) in each iteration. B. Intermediate
CMRO2 mapping results in each iteration.
-
Liver parenchymal change after stereotactic radiotherapy for hepatocellular carcinoma using DWI and MRE
Yoshie Omiya1, Utaroh Motosugi2, Hiroyuki Morisaka1, and Hiroshi Onishi1
1University of Yamanashi, Yamanashi, Japan, 2Kofu-Kyoritsu Hospital, Yamanashi, Japan
Stereotactic body radiotherapy (SBRT) is a treatment option for patients with hepatocellular carcinoma (HCC). We evaluated the liver parenchymal changes after SBRT using liver stiffness with MRE and the apparent diffusion coefficient values with DWI. They were significantly elevated.
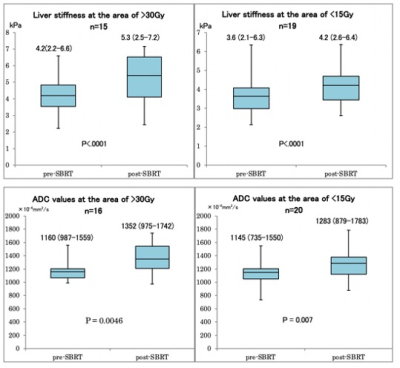
Figure2. Box plots show of the liver stiffness and ADC values in the area receiving high dose and low dose of stereotactic body radiotherapy (SBRT). Liver stiffness and ADC values were significantly increased in both areas after SBRT. Exclude cases where ROI cannot be obtained sufficiently.
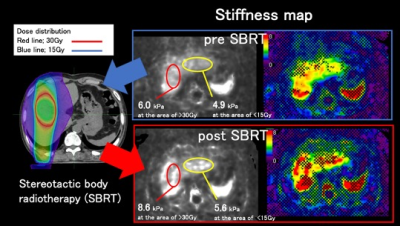
Figure3. Case1: 79-year-old man with HCC at S6. The dose of SBRT was 50Gy/25Fr (PTV-95). The liver stiffnesses after SBRT were higher than those before SBRT in both area receiving >30Gy and area receiving <15Gy.
-
Deuterium Metabolic Imaging of the human brain at 9.4 T: Coil design and dynamic glucose uptake
Loreen Ruhm1,2, Nikolai Avdievitch1, Theresia Ziegs1,2, Armin M. Nagel3,4, Henk M. De Feyter5, Robin A. de Graaf5, and Anke Henning1,6
1High-Field MR Center, Max Planck Institute for Biological Cybernetics, Tuebingen, Germany, 2IMPRS for Cognitive and Systems Neuroscience, Eberhard-Karls University, Tuebingen, Germany, 3Institute of Radiology, University Hospital Erlangen, Erlangen, Germany, 4Division of Medical Physics in Radiology, German Cancer Research Center (DKFZ), Heidelberg, Germany, 5Radiology and Biomedical Imaging, Yale University, New Haven, CT, United States, 6Advanced Imaging Research Center, UT Southwestern Medical Center, Dallas, TX, United States
We present first DMI data of the
human brain at B0 = 9.4T with a high spatial resolution acquired at
a Siemens whole body scanner with a dedicated coil design. We investigated the
dynamic uptake of [6,6’-2H]-glucose after oral administration in
different brain areas.
Fig. 5: 2H images for different times of one volunteer for
water, glucose and Glx with and without referencing to a baseline water
measurement (A). Zero-filling to twice the original resolution was
applied. In (B), signals for different
voxels are shown for water, glucose and Glx for the same volunteer. The colors
of the frame label the corresponding metabolic images in (A). (C) shows data
from four different volunteers (different colors) for water, glucose, Glx and
lipid/lactate for summed voxels over different regions of the head.
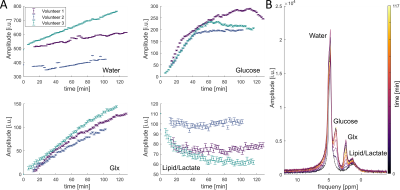
Fig. 2: The
results for three volunteers of a whole brain FID measurement after the oral
administration of deuterated glucose for four resonances (A). The temporal
resolution of the measurement is 2 minutes. In (B), several spectra from
volunteer 3 are shown at different time points. The time points are labeled with
different colors.
-
Low field 19F imaging of perfluoroctylbromide: eliminating chemical shift effects and minimizing scalar coupling signal loss
Javad Parsa1 and Andrew Webb1
1Leiden University Medical Center, Leiden, Netherlands
Low field MRI can be used to acquire 19F images with very high efficiency even for contrast agents with multiple resonances and scalar coupling, achieving very close to the theoretical SNR limit.
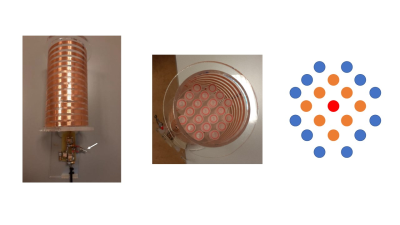
Figure 1.
(left) Photograph of the solenoid coil which can be switched between 1H
and 19F using a mechanical switch (arrow). (centre) Photograph of
the phantom placed in the centre of the coil. (right) Schematic of the phantom
with vials filled with water (blue), fomblin (orange) and a single tube of PFOB
(red).
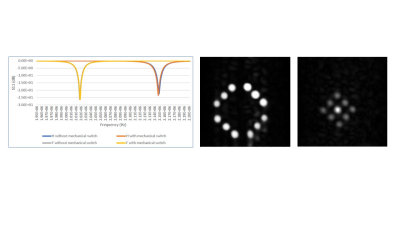
Figure 2. (left) S11
plots of the 1H and 19F switched-mode RF coil. (center)
Spin-echo 1H image from the
phantom, (right) Corrsponding spin-echo 19F image.