-
Simultaneous Oxygenation and Metabolic Imaging Relates Oxygen and Neuronal Metabolism in Acute Stroke
Tianxiao Zhang1, Rong Guo2,3, Tianyao Wang4, Zengping Lin1, Yudu Li2,3, Yibo Zhao2,3, Jun Liu4, Danhong Wu5, Zheng Jin6, Xin Yu7, Zhi-Pei Liang2,3, and Yao Li1
1School of Biomedical Engineering, Shanghai Jiao Tong University, Shanghai, China, 2Beckman Institute for Advanced Science and Technology, University of Illinois at Urbana-Champaign, Urbana, IL, United States, 3Department of Electrical and Computer Engineering, University of Illinois at Urbana-Champaign, Urbana, IL, United States, 4Radiology Department, The Fifth People's Hospital of Shanghai, Fudan University, Shanghai, China, 5Neurology Department, The Fifth People's Hospital of Shanghai, Fudan University, Shanghai, China, 6Shanghai Minhang Hospital of Integrated Traditional Chinese and Western Medicine Hospital, Shanghai, China, 7Department of Biomedical Engineering, Case Western Reserve University, Cleveland, OH, United States
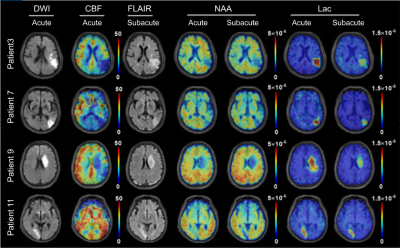
We performed high-resolution simultaneous measurements
of brain oxygenation and metabolism in acute stroke. Our results showed not
only the expected changes in the markers of oxygenation and neurometabolites
individually, but also their concurrent coupling.
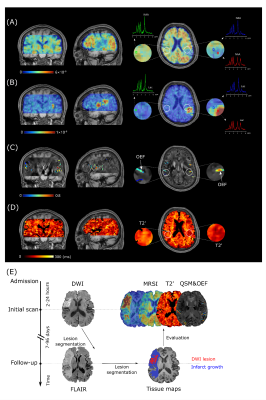
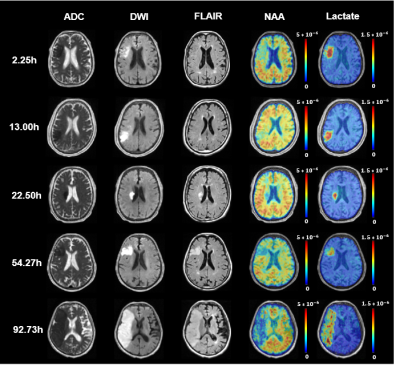
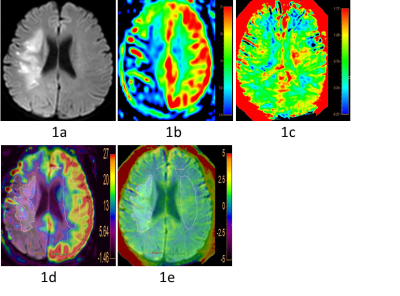
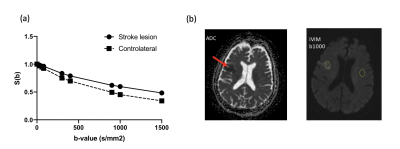
Figure 1. Simultaneous 3D brain neurometabolites and OEF
mapping for an acute ischemic stroke patient. (A, B) 3D NAA and Lac map in
triplanar views overlaid on T1-weighted images. The representative spectra were
from the DWI lesion (red), infarct growth (blue) and contralateral normal
(light green) regions, respectively. (C) 3D venous OEF map in triplanar views
overlaid on QSM images. (D) 3D quantitative
map in triplanar views. (E)
Timeline of the experimental study.

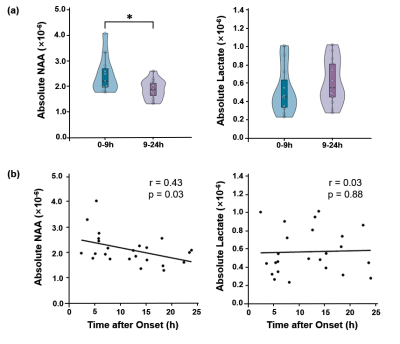
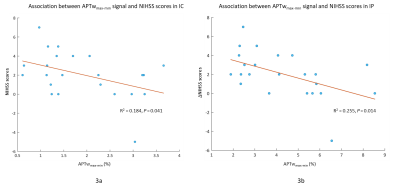
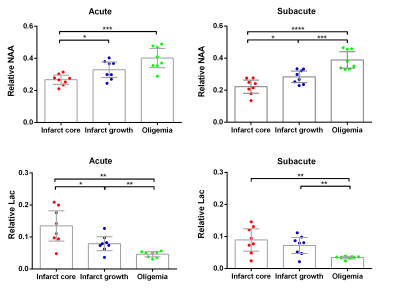
Figure 4. Significant correlations between
values and lactate or lactate to NAA ratio
concurrently detected in infarct growth area (A) but not in infarct core (B) of
acute ischemic stroke patients.
-
A Shearlet-based whole brain vein segmentation algorithm and its application for the detection of regional differences in venous oxygenation
Sina Straub1, Janis Stiegeler1,2, Edris El-Sanosy3, and Till M. Schneider4
1Division of Medical Physics in Radiology, German Cancer Research Center (DKFZ), Heidelberg, Germany, 2Faculty of Physics and Astronomy, University of Heidelberg, Heidelberg, Germany, 3Division of Radiology, German Cancer Research Center (DKFZ), Heidelberg, Germany, 44Department of Neuroradiology, University of Heidelberg, Heidelberg, Germany
Compared
with a ground truth, the proposed vein segmentation algorithm can accurately
segment venous vasculature and allows for a susceptibility-based differentiation
of deep and superficial vascular territories.
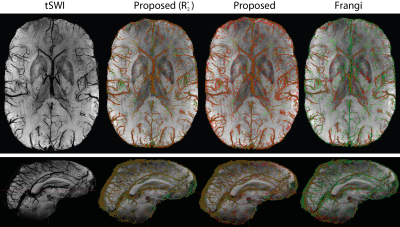
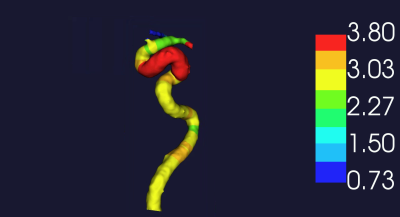
Figure 3: Representative axial and sagittal slices of 16-slices minimum intensity
projections of tSWI data and segmentations. The manually segmented ground truth
is shown in green, overlaid with (from left to right) the segmentation from the
proposed algorithms for a multi-echo acquisition when R2* is available, without
R2*, and for the Frangi method, respectively. These segmentations are shown in
red so that true positives appear orange, false positives red, and false
negatives green.
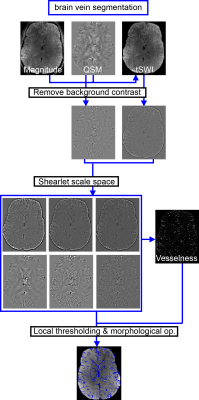
Figure 1: Algorithm flowchart summarizing the main steps 1-6 of the algorithm (the
use of R2* data is omitted).
-
A Flexible Computational Framework for Characterization of Dynamic Cerebrovascular Response to Global Hemodynamic Stimuli
Siddhant Dogra1, Xiuyuan Wang2, Jelle Veraart3, Alejandro Gupta3, Koto Ishida3, Deqiang Qiu4, and Seena Dehkharghani3
1Radiology, New York University Langone Health, New York, NY, United States, 2Weill Cornell, New York, NY, United States, 3New York University Langone Health, New York, NY, United States, 4Emory University, Atlanta, GA, United States
A custom pipeline employing spatial and temporal denoising permits for enhanced dynamic CVR analysis in patients with chronic steno-occlusive disease to uncover otherwise concealed dynamic features of the ACZ-augmented BOLD cerebrovascular response.
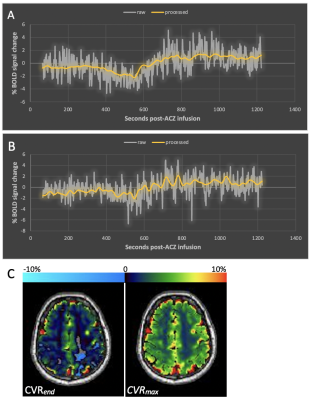
Sample BOLD signal (A, B) and representative CVRend and CVRmax maps (C) from a patient with right hemisphere disease. % BOLD-signal changes of a right hemispheric voxel with 30-second temporal delay with respect to the straight sinus time series shown from raw (gray) and processed signals (orange) demonstrating non-monotonic post-ACZ effects. Panel B demonstrates a case with CVRmax greater than CVRend. Panel C demonstrates challenges with CVRend evaluation confounding essentially preserved, symmetric CVRmax augmentation in a patient remaining stable during serial follow-up.
Sample BOLD signal (A, B) and representative CVRend and CVRmax maps (C) from a patient with right hemisphere disease. % BOLD-signal changes of a right hemispheric voxel with 30-second temporal delay with respect to the straight sinus time series shown from raw (gray) and processed signals (orange) demonstrating non-monotonic post-ACZ effects. Panel B demonstrates a case with CVRmax greater than CVRend. Panel C demonstrates challenges with CVRend evaluation confounding essentially preserved, symmetric CVRmax augmentation in a patient remaining stable during serial follow-up.
-
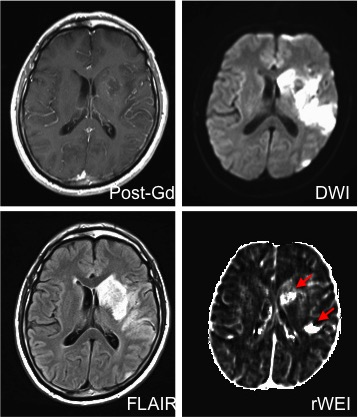
Relationship of FLIAR vascular hyperintensity territory with APCVs and venous oxygen saturation in patients with cerebral infarction
Pei-pei chang1, Yan-wei Miao1, Yu-han Jiang1, Yi-wei Che1, Bing-bing Gao1, Li-hua Chen1, Qing-wei Song1, Ren-wang Pu1, Ai-lian Liu1, Liang-jie Lin2, and Jia-zheng Wang2
1The First Affiliated Hospital of Dalian Medical University, Da Lian, China, 2Philips Healthcare, Bei Jing, China
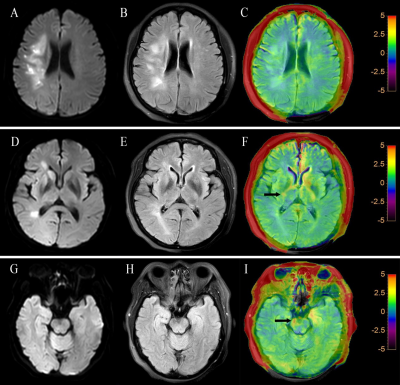
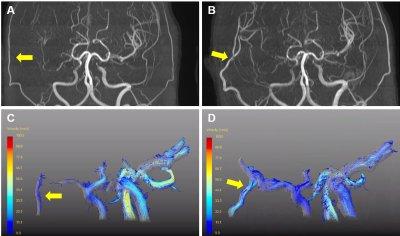
Patients with severe-occlusion were associated with higher FVH and APCVs scores than those with mild-to-moderate stenosis. The FVH territory was observed to be positively correlated with APCVs territory, oxygen extraction in patients with cerebral infarction.
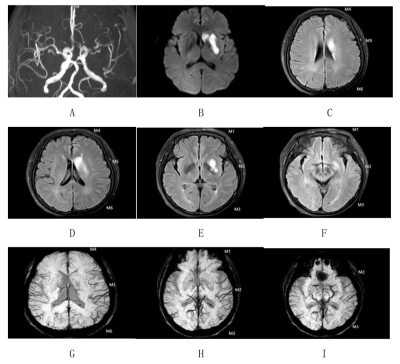
Figure.4 MRI images of a 63-years-old man. A: the MR angiography shows the occur of occlusion in left middle cerebral artery. B: DWI shows the hyperintense region in left basal ganglia. C~F: The modified ASPECT score of FVH shows that the FVH score was 6. G~I: APCVs score is 5.
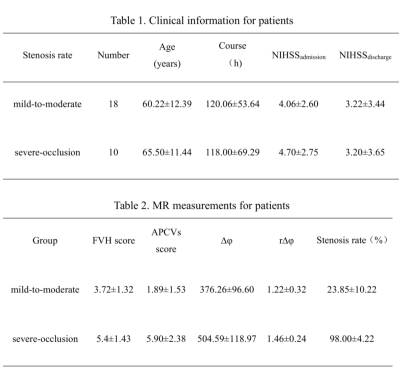
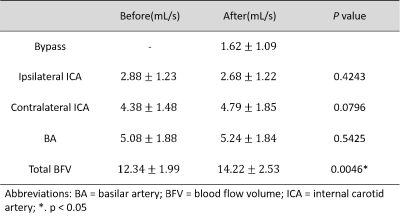
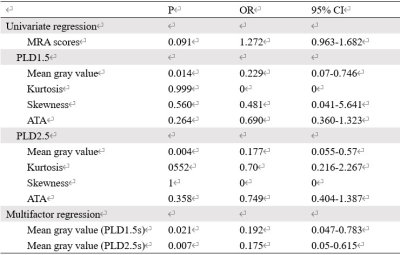
Tables Clinical information and MR measurements for patients
-
A Local Linear Regression Algorithm for Partial Volume Correction in Brain Oxygen Extraction Fraction Estimation
Yasheng Chen1, Chunwei Ying2, Peter Kang1, Slim Fellah1, Amy Mirro3, Melanie Fields3, Kristin Guilliams1, Jin-Moo Lee1, Andria Ford1, and Hongyu An4
1Neurology, Washington University School of Medicine, St. Louis, MO, United States, 2Biomedical Engineering, Washington University in St. Louis, St. Louis, MO, United States, 3Pediatrics Hematology, Washington University School of Medicine, St. Louis, MO, United States, 4Washington University School of Medicine, St. Louis, MO, United States
We developed
a local linear regression based partial volume correction (PVC) method for OEF
estimation. The PVC OEF method reduced model fitting errors and signal
contamination of CSF, and it improved the association between OEF and WMH
lesion burden.
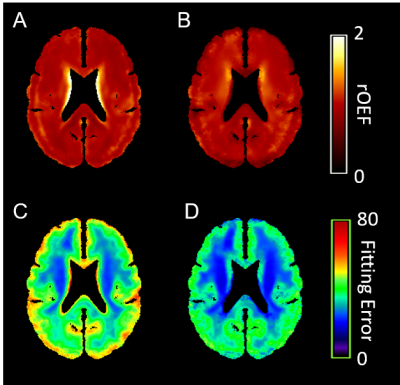
Figure 2. The group average rOEF maps
without (A)
and with (B)
PVC, and the
group average fitting
error maps
without (C)
and with (D) PVC.
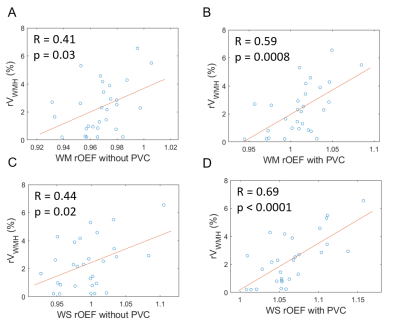
Figure 3. Correlation between WM rOEF and
rVWMH with and without PVC (A, B), and correlation between watershed
rOEF
and rVWMH with and without PVC (C, D).
-
Predicting the Neurodegeneration after Stroke using Disconnectivity Map
Takayuki YAMAMOTO1, Hikaru FUKUTOMI1, Vincent DOUSSET1,2, Igor SIBON3, and Thomas TOURDIAS1,2
1Institut de Bio-imagerie IBIO, Université de Bordeaux, Bordeaux, France, 2Neuroimagerie diagnostique et thérapeutique, CHU de Bordeaux, Bordeaux, France, 3Unité de soins intensifs neurovasculaires, CHU de Bordeaux, Bordeaux, France
We investigated the relation between stroke and remote consequences
using probability maps of damaged tractograms. We demonstrated that such
disconnectivity approach can successfully predict regions that will degenerate
and show long term iron accumulation.
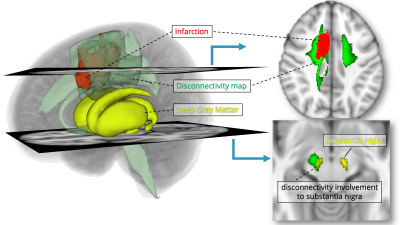
Figure 1. Overview of a
representative disconnectivity map. Disconnectivity map (green) is calculated
using the lesion mask of the infarction (red), based on the tractograms of
healthy subjects. The degree of overlap of the disconnectivity map and masks of
deep nuclei was used to estimate the remote effect of the infarction.
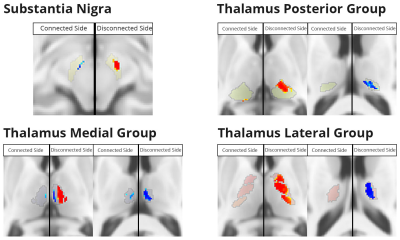
Figure 3. Voxel-based morphometry analysis for the R2* value
in the substantia nigra and the thalamus. The red area means a significant
increase of the R2* value at 1-year follow-up compared with that at baseline.
The blue area means a significant decrease at 1-year follow-up.
-
Revisit on the cerebrovascular responses to end-tidal CO2 fluctuations during spontaneous breathing as a surrogate of regional cerebrovascular reactivity assessment under hypercapnic challenge
Suk-tak Chan1, Karleyton C. Evans2, Tian-yue Song1, Andre van der Kouwe1, Bruce R. Rosen1, Yong-ping Zheng3, and Kenneth K. Kwong1
1Athinoula A. Martinos Center for Biomedical Imaging, Department of Radiology, Massachusetts General Hospital, Charlestown, MA, United States, 2Biogen, Inc., Cambridge, MA, United States, 3Department of Biomedical Engineering, Hong Kong Polytechnic University, Kowloon, Hong Kong
CVR to endogenous CO2 at
rest showed significant inter-subject variability and was substantially
different from CVR to external CO2 challenge. Such inter-subject
variability, not reduced by correction of respiratory effects, also showed up
less prominently in CVR to endogenous O2 at rest.
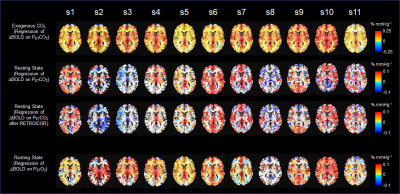
Fig
1. Individual CVR maps show significant
CVR changes under external CO2 challenges (n=11) (1st
row). Individual CVR maps to endogenous
maps showed significant inter-subject variability (2nd row). Such inter-subject variability was not
reduced by correction of respiratory effects using RETROICOR (3rd
row). CVR maps to endogenous O2 show less inter-subject variability
than CVR maps to endogenous CO2 (4th row).
-
Distinct Effects on Cognition Caused by the Side of Asymptomatic Carotid Artery Stenosis
Jyun-Ru Chen1, Chun-Jen Lin2,3, I-Hui Lee2,3,4, and Chia-Feng Lu1
1National Yang-Ming University, Taipei, Taiwan, 2School of Medicine, National Yang-Ming University, Taipei, Taiwan, 3Neurological Institute, Taipei Veterans General Hospital, Taipei, Taiwan, 4Institute of Brain Science, National Yang-Ming University, Taipei, Taiwan
The correlation between the side of asymptomatic internal carotid stenosis (aICS) and cognitive impairment was less explored. In this study, significant difference of functional connectivity (FC) and correlations between FC and cognitive symptoms were found between the two aICS groups.
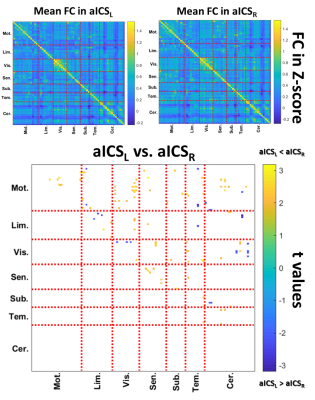
Figure 2 The mean FC matrices for the aICSL (upper-left matrix) and aICSR (upper-right matrix) groups during the resting state. The significant differences between two groups are displayed in the lower matrix. A positive t value (yellow) represents a higher FC in the aICSR group compared to that in the aICSL group. Mot.: Motor; Lim.: Limbic; Vis.: Visual; Sen.: Sensory; Sub.: Subcortical; Tem.: Temporal; Cer.: Cerebellum.
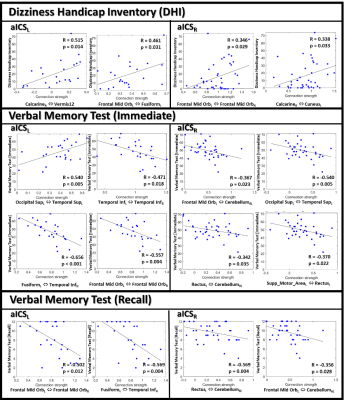
Figure 3 Scatter plots for the significant correlations between functional connectivity and neuropsychological assessments during the resting state.
-
Agreement of CVR maps acquired using hypocapnic and hypercapnic breathing tasks
Kristina M. Zvolanek1,2, Rachael C. Stickland2, Stefano Moia3,4, Apoorva Ayyagari1,2, César Caballero-Gaudes3, and Molly G. Bright1,2
1Biomedical Engineering, Northwestern University, Evanston, IL, United States, 2Physical Therapy and Human Movement Sciences, Northwestern University, Chicago, IL, United States, 3Basque Center on Cognition, Brain and Language, Donostia, [Gipuzkoa], Spain, 4University of the Basque Country EHU/UPV, Donostia, [Gipuzkoa], Spain
Our results demonstrate comparable BOLD cerebrovascular reactivity (CVR) and hemodynamic lag measurements between breath-hold and deep breathing tasks, suggesting that the two tasks can be used interchangeably in healthy participants.
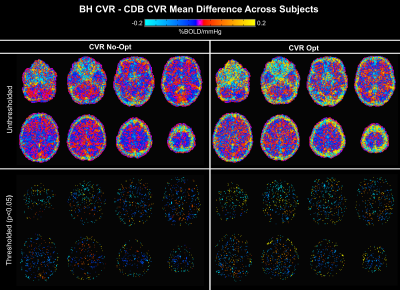
Voxelwise maps of the Bland-Altman analysis showing mean difference between breath-hold (BH) and cued deep breathing (CDB) cerebrovascular reactivity (CVR) across all subjects. Differences in non-optimized CVR (No-Opt) are shown on the left, lag-optimized on the right, with thresholded maps for each in the bottom row (p<0.05). Negative values represent voxels with greater BH CVR than CDB CVR, and vice versa. Significant differences appear primarily at brain edges and in white matter.
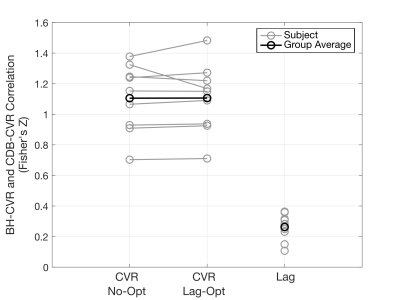
Voxelwise correlations between breath-hold (BH) and cued deep breathing (CDB) cerebrovascular reactivity (CVR) before lag optimization (No-Opt), lag-optimized CVR (Lag-Opt), and lag. A Fisher's Z transform was performed on individual subject correlations to calculate a group average. All single subject Fisher’s Z values are significantly different from 0 at an alpha-level of 0.05 (Z>0.0232).
-
Effect of Myelin Content on Cognitive Outcomes in Cerebral Small Vessel Disease
Elizabeth Dao1, Roger Tam1, Ging-Yuek R Hsiung1, Lisanne ten Brinke1, Rachel Crockett1, Cindy K Barha1, Youngjin Yoo1, Walid al Keridy2, Stephanie H Doherty1, Alex L MacKay1, Cornelia Laule1, and Teresa Liu-Ambrose1
1University of British Columbia, Vancouver, BC, Canada, 2King Saud University, Riyadh, Saudi Arabia
Lower normal appearing white matter myelin water fraction was associated with slower processing speed and poorer working memory in people with cerebral small vessel disease, after accounting for age, education, and white matter hyperintensity volume.
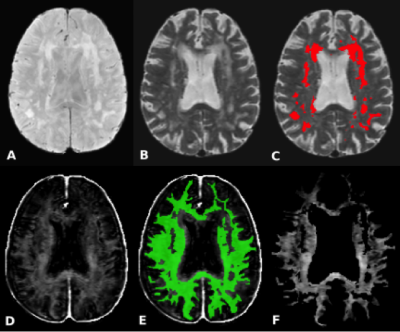
Figure 1 A) PD-weighted scan for WMH segmentation; B) T2-weighted scan for white matter hyperintensity segmentation; C) white matter hyperintensity mask; D) myelin water fraction map; E) normal appearing white matter myelin water fraction mask; F) normal appearing white matter myelin water fraction map
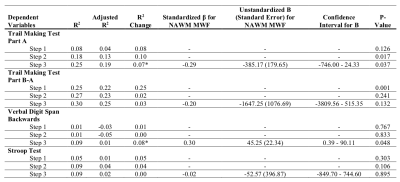
Table 2 Multiple Linear Regression Results
Independent Variables in Step 1 = age and education; Independent Variables in Step 2 = age, education, and white matter hyperintensity volume; Independent Variables in Step 3 = age, education, white matter hyperintensity volume, and normal appearing white matter (NAWM) myelin water fraction (MWF)
*Significant at p ≤ 0.05
-
Impaired cerebrovascular reactivity in patients with Huntington's disease
Suk-tak Chan1, Nathaniel Mercaldo2, Kenneth K. Kwong1, Steven M. Hersch3, and Herminia D. Rosas3
1Athinoula A. Martinos Center for Biomedical Imaging, Department of Radiology, Massachusetts General Hospital, Charlestown, MA, United States, 2Department of Radiology, Massachusetts General Hospital, Boston, MA, United States, 3Department of Neurology, Massachusetts General Hospital, Boston, MA, United States
Alterations in
cerebrovascular function was found in HD and the dominance of such alterations in
white matter further suggests the signs of small vessel
disease. The impaired cerebrovascular
reactivity may be an important, not as yet considered, contributor to early
neuropathology in HD.
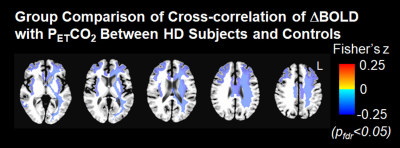
Figure 1. Group comparison of cross-correlation of ΔBOLD
with PETCO2 between HD subjects and healthy controls
after adjusting for age, corrected at pfdr<0.05. Cold colors represent weaker
cross-correlation in HD subjects when compared with controls.
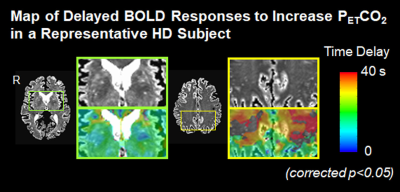
Figure 2. Map of delayed BOLD responses to increased PETCO2
in a representative HD subject. The
magnitude of time delay in BOLD responses relative to PETCO2
increases from cold colors to warm colors.
-
Quantification of Relative Blood Volume in Squirrel Monkey Brain in vivo using an MRI-based template
Zhangyan yang1,2, Feng Wang1,3, Chaohui Tang1, Li Min Chen1,3, and Gore C. John1,2,3
1Institute of Imaging Science, Vanderbilt University, Nashiville, TN, United States, 2Biomedical Engineering, Vanderbilt University, Nashiville, TN, United States, 3Department of Radiology and Radiological Science, Vanderbilt University, Nashiville, TN, United States
High resolution maps of rCBV provide information for studies of brain function and changes in brain. In this study, by using a contrast agent in non-human primates, we quantified rCBV maps, identified alterations of rCBV across regions, and created an rCBV atlas using a brain template.
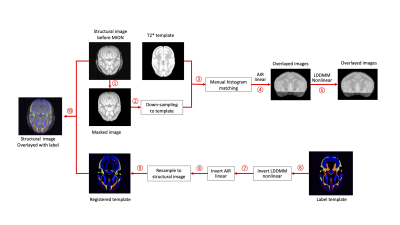
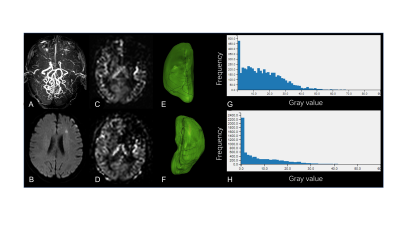
Figure 1. Registration pipeline of VALiDATe29 squirrel monkey atlas labels (template space) to structural images before MION (subject space). T2* weighted image before MION administration were first skull stripped and down sampled to template size. Then the template image was transformed into subject space by performing affine linear automatic image registration (AIR) followed by non-linear LDDMM registration. Inverse transformation matrices were subsequently applied to the template labels. Labels are transformed to subject space and checked visually using MRICroN.
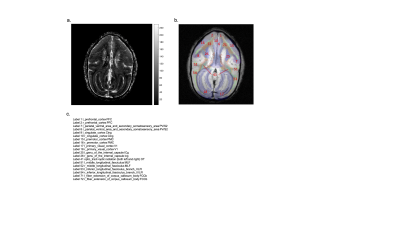
Figure 2. (a) Characteristic rCBV map of one subject. The 13th slice is shown. (b) structural T2* image before MION overlayed with transformed labels in subject space for the same slice. Structural image is in gray scale and labels are indicated in different color. (c) label names, the label numbers are consistent with numbers in b.
-
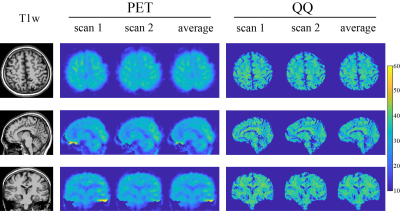
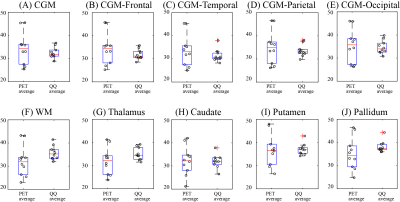
Test–Retest Repeatability of Brain Oxygen Metabolism Measurement using MRI
Chunwei Ying1, Michael M. Binkley2, Peter Kang2, Yasheng Chen2, Jin-Moo Lee2,3, Andria L. Ford2, and Hongyu An3
1Department of Biomedical Engineering, Washington University in St. Louis, St. Louis, MO, United States, 2Department of Neurology, Washington University School of Medicine, St. Louis, MO, United States, 3Mallinckrodt Institute of Radiology, Washington University School of Medicine, St. Louis, MO, United States
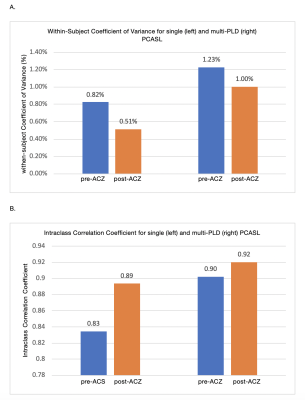
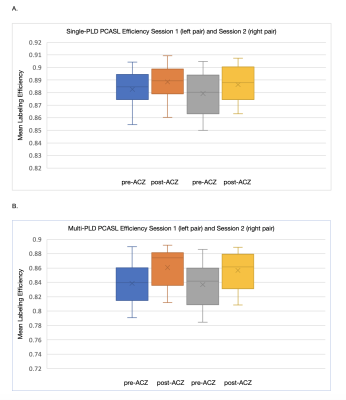
Background
suppressed 3D pCASL had better test-retest repeatability than 2D pCASL,
especially in watershed region. OEF measured with ASE had better repeatability than
CBF measured with pCASL. CMRO2
had similar test-retest repeatability to CBF.
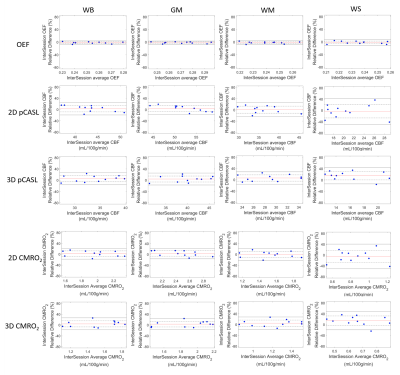
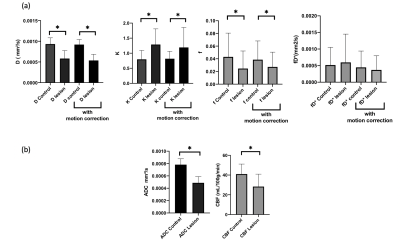
Figure 4. Inter-session repeatability of
OEF, CBF and CMRO2 in WB, GM, WM and WS regions. The red
horizontal line, dotted black horizontal lines, and solid black horizontal
lines represent the mean, ± SD, and ± 1.96xSD of
inter-session measurement differences, respectively.
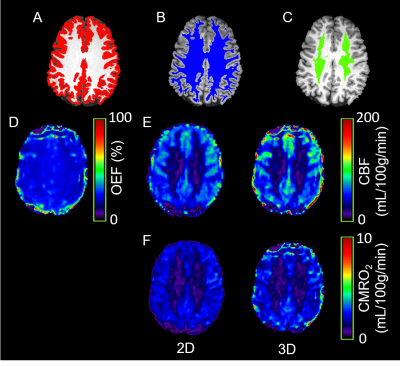
Figure 2. Gray matter (A), white matter
(B) and watershed region mask (C), OEF map (D), CBF maps (E) and corresponding CMRO2 maps (F) from a representative
subject.
-
Detecting Magnetic Resonance Changes in Brain Structure and Function During Stroke Rehabilitation
Jonathan Taylor1, Oun Al-iedani2,3, Saadallah Ramadan3,4, Neil Spratt1, and Sarah Valkenborghs5
1School of Biomedical Sciences and Pharmacy, University of Newcastle, Newcastle, Australia, 2School of Health Sciences, University of Newcastle, Newcastle, Australia, 3Hunter Medical Research Institute, Newcastle, Australia, 4Faculty of Health and Medicine, University of Newcastle, Newcastle, Australia, 5University of Newcastle, Newcastle, Australia
Using Magnetic Resonance (MR) data acquired as part of a feasibility
study in stroke rehabilitation, a novel post-processing pipeline was designed
and implemented to explore metabolic factors with MR Spectroscopy (MRS).
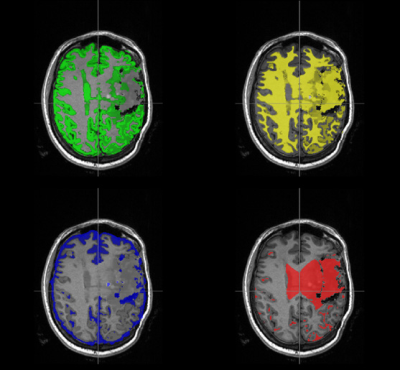
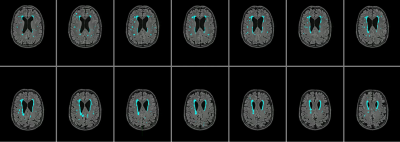
Figure 3: Whole brain
segmentation at baseline clockwise from top left, GM, WM,
lesion, and CSF. Lesion segmentation processed in SPM software; others
processed by FSL-FAST. Two-dimensional transverse view of a three-dimensional
binary mask. Lesion segmentation algorithm tends to categorise large CSF
volumes as lesion, visible at first and second ventricles.
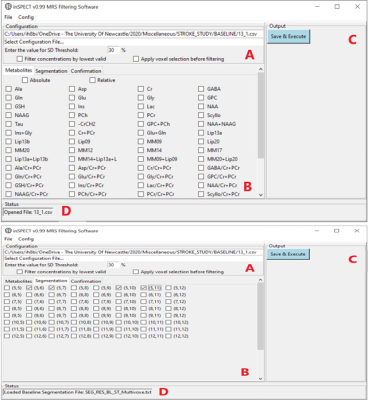
Figure 1i: inSPECT GUI
displaying list of selectable metabolites (B), the
configuration panel (A) Cramer-Rao lower bounds SD% threshold. Output panel (C) contains the button to execute processing
of data, the lower edge (D) is the status bar, indicating a
single CSV file has been opened.
Figure 1ii: inSPECT
GUI with voxel selection tab active (B) with voxels checked for filtering. (A) is selected file information and
checkboxes for inputting the concentration filter method. Panel (C) is the Save
& Execute button, panel (D) is current status, a Baseline Segmentation file
has been loaded.
-
Processing cerebrovascular reactivity data using shift-invariant dictionary learning
Emilie Sleight1,2, Michael S Stringer1,2, Ian Marshall1,2, Joanna M Wardlaw1,2, Sotirios A Tsaftaris3, and Michael J Thrippleton1,2
1Centre for Clinical Brain Sciences, University of Edinburgh, Edinburgh, United Kingdom, 2UK Dementia Research Institute, Edinburgh, United Kingdom, 3Institute for Digital Communications, University of Edinburgh, Edinburgh, United Kingdom
We introduce a new processing method for
cerebrovascular reactivity (CVR) data known as shift-invariant dictionary
learning (SIDL). We show that measurements of CVR magnitude and CVR delay
obtained with SIDL are comparable to standard processing.
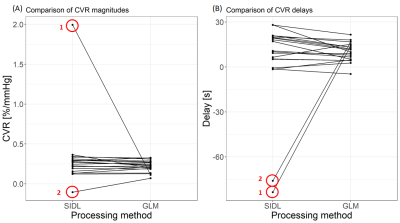
Figure 2.
Comparison of CVR magnitudes (A) and delays (B) obtained with SIDL and GLM. The
outliers are labelled as outlier 1 and 2.
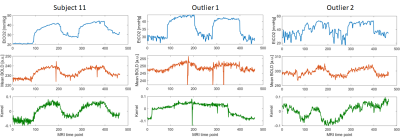
Figure 3.
EtCO2, mean BOLD in deep grey matter and kernel of a subject with comparable
estimates to GLM and of the two outliers.
-
Cerebral circulation time related DMN connectivity in intracranial dural arteriovenous fistula before and after treatment
Bejoy Thomas1, Jithin S S1, Sabarish S Sekar1, Santhosh Kannath1, and Ramshekhar N Menon2
1Imaging Sciences and Interventional Radiology, Sree Chitra Tirunal Institute for Medical Sciences and Technology, Thiruvananthapuram, India, 2Neurology, Sree Chitra Tirunal Institute for Medical Sciences and Technology, Thiruvananthapuram, India
This study explores the relationship between cerebral circulation time and rsfMRI network alterations related to cognitive decline in dural arteriovenous fistula patients and their reversibility after embolisation therapy.
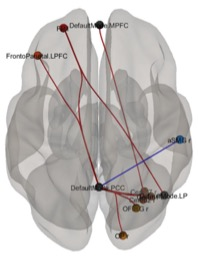
Connectivity analysis: ROI to ROI, Low circulation time > Healthy control
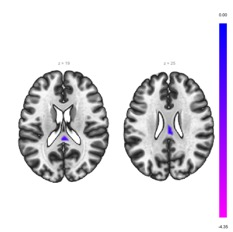
Connectivity analysis: ICA, Low circulation time > Healthy control
-
fMRI based evaluation of yoga-induced changes in ischemic post-stroke patients
Rama Jayasundar1, Dushyant Kumar1, Rajesh Mishra1, Priyanka Jain2, Jaideep Sachdeva3, Chahat Kumar1, Priyanka Bhagat4, and Padma Srivastava4
1Department of NMR, All India Institute of Medical Sciences, New Delhi, India, 2Centre for Development of Advanced Computing, New Delhi, India, 3Manipal University, Jaipur, India, 4Department of Neurology, All India Institute of Medical Sciences, New Delhi, India
Stroke is a debilitating disease with long term effects. With
increasing interest in use of yoga in post-stroke recovery, this fMRI study has
demonstrated increase in the BOLD activity in the left pre-central gyrus region in ischemic stroke patients, 3
and 6 months post-yoga intervention.
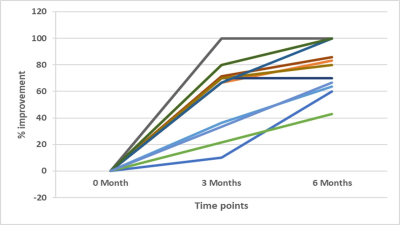
Figure 1: Longitudinal changes in the National Institutes of
Health Stroke Scale (NIHSS) scores in ischemic stroke
patients subjected to yoga intervention.
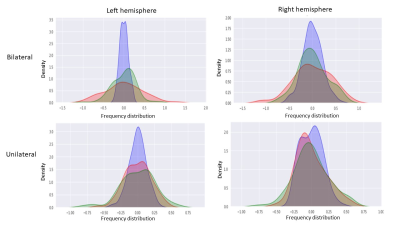
Figure 2: Representative frequency distribution of the BOLD activity from a left hemisphere
ischemic stroke patient. The purple peak corresponds the zero time point
(pre-intervention), the red to 3 months post-intervention and green to 6 months
post-intervention.
-
Clinical Phenotype Polymorphism of Ischemic Stroke Underpinned by Inter-network Functional Connectivity
Lijuan Zhang1, Siqi Cai1,2, Chunxiang Jiang1,2, Shihui Zhou1,2, and Li Yi3
1Shenzhen Institutes of Advanced Technology, Chinese Academy of Sciences, Shenzhen, China, 2University of Chinese Academy of Sciences, Beijing, China, 3Peking University Shenzhen Hospital, Shenzhen, China
Divergent inter-network connectivity patterns were identified in stroke patients with unilateral motor deficit, indicating a polymorphism of the clinical phenotype of stroke. This study provides new insight into better itemization of the disease
dynamic and management of ischemic stroke.
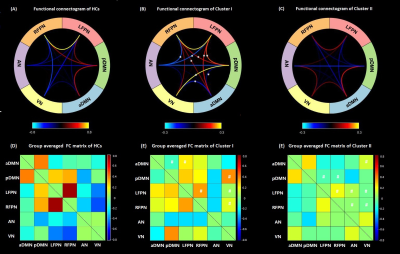
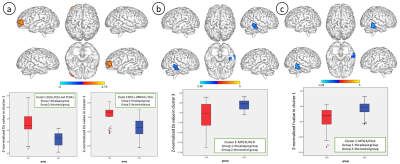
Functional connectogram (A-C) and group averaged
functional connectivity (FC) matrix (D-F) of healthy controls (HC) and two
clusters of subjects with stroke. Asterisk (*) indicates significant
differences between the patient clusters (Two-sample t-test,
p<0.05, FDR correction). Comment sign (#) indicates significant
difference between either cluster and HCs (Two-sample t-test, p<0.05, FDR
correction).
-
Monte Carlo Simulation Study of Asymmetric Spin Echo and Preliminary Estimation of Vessel Size Index
Jian Shen1 and John Wood1,2
1University of Southern California, Los Angeles, CA, United States, 2Children's Hospital Los Angeles, Los Angeles, CA, United States
The OEF estimated by ASE method might be affected by the diffusion effect and it mainly applies to bigger vessels. We also demostrate the feasibility to generate the VSI map from ASE data.
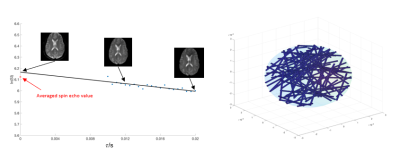
Figure
1. Representative signal decay curve (left) and Monte Carlo simulation system
(right).
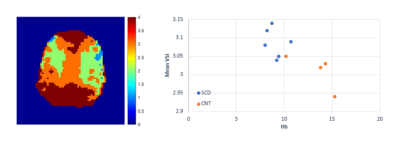
Figure 3. Typical VSI map for a SCD
patient (left) and mean VSI for all the subjects (right).