Multiple Sclerosis
Neuro Wednesday, 19 May 2021
Oral
483 - 492

Oral Session - Multiple Sclerosis
Neuro
Wednesday, 19 May 2021 12:00 - 14:00
  • Differential Changes in Brain Viscoelastic Properties Observed with MR Elastography in MS and NMOSDs
    Ling Fang1, Matthew C. Murphy2, Qiuxia Luo1, Xiaodong Chen3, Linqi Zhang1, Bingjun He1, Jun Chen2, Jonathan M. Scott2, Meng Yin2, Kevin J. Glaser2, Richard L. Ehman2, Wei Qiu3, and Jin Wang1
    1Department of Radiology, The Third Affiliated Hospital of Sun Yat-sen University, Guangzhou, China, 2Department of Radiology, Mayo Clinic, Rochester, MN, United States, 3Department of Neurology, The Third Affiliated Hospital of Sun Yat-sen University, Guangzhou, China
    This study showed that MRE-measured damping radio and loss modulus stiffness are biomarkers that show promise for characterizing tissue damage in autoimmune disease of the central nervous system.
    Figure 1. A 27-year-old female (EDSS score = 3, top row) with MS and a 52-year-old female (EDSS score = 4, bottom row) with NMOSD. (a,f) T2-weighted image. (b,g) A 60-Hz MRE magnitude image. (c,h) Stiffness. (d,i) Storage modulus. (e,j) Loss modulus.
    Figure 3. Correlation of MRE parameters and clinical data (EDSS and disease course) in MS and NMOSDs patients.
  • Correlations of serum neurofilament with myelin, axonal and volumetric imaging in multiple sclerosis
    Jackie Yik1,2, Pierre Becquart3, Jasmine Gill3, Shannon H. Kolind1,2,4,5, Virginia Devonshire5, Ana-Luiza Sayao5, Alice Schabas5, Robert Carruthers5, Anthony Traboulsee5, G.R. Wayne Moore2,3, David K.B. Li4,5, Sophie Stukas3, Cheryl Wellington3, Jacqueline A. Quandt3, Irene M. Vavasour2,4, and Cornelia Laule1,2,3,4
    1Physics and Astronomy, University of British Columbia, Vancouver, BC, Canada, 2International Collaboration on Repair Discoveries, Vancouver, BC, Canada, 3Pathology and Laboratory Medicine, University of British Columbia, Vancouver, BC, Canada, 4Radiology, University of British Columbia, Vancouver, BC, Canada, 5Medicine, University of British Columbia, Vancouver, BC, Canada
    Multiple sclerosis serum neurofilament light chain levels correlated with myelin water fraction, axial and radial diffusivity, and fractional anisotropy in whole brain and normal appearing white matter but only with myelin water fraction in lesions.
    Regression plots for the normal appearing white matter region showing the relationship between logarithmically transformed serum neurofilament light (NfL) chain and measures for myelin content (myelin water fraction (A) r=-0.54, p=0.016; radial diffusivity (C) r=0.58, p=0.0004) or axon integrity (axial diffusivity (B) r=0.54, p=0.029; fractional anisotropy (D) r=-0.56, p=0.004). 95% confidence interval is shaded.
    Regression plots for the relationship between logarithmically transformed serum neurofilament light chain (NfL) and volumetric imaging measures (normalized brain volume (A) r=-0.56, p=0.008; cube root lesion volume (B) r=0.59, p=0.0002; deep grey matter volume (C) r=-0.57, p=0.002; thalamus volume (D) r=-0.56, p=0.006; cortical thickness (E) r=-0.56, p=0.004). 95% confidence interval is shaded.
  • Disseminated brain pathology detected with high-resolution MRSI correlates with clinical disability in multiple sclerosis
    Eva Heckova1, Alexandra Lipka1, Assunta Dal-Bianco2, Bernhard Strasser1, Gilbert Hangel1,3, Paulus Rommer2, Petra Hnilicová4, Ema Kantorová5, Lukas Hingerl1, Stanislav Motyka1, Fritz Leutmezer2, Stephan Gruber1, Siegfried Trattnig1,6, and Wolfgang Bogner1
    1High Field MR Centre, Department of Biomedical Imaging and Image-guided Therapy, Medical University of Vienna, Vienna, Austria, 2Department of Neurology, Medical University of Vienna, Vienna, Austria, 3Department of Neurosurgery, Medical University of Vienna, Vienna, Austria, 4Biomedical Center Martin, Jessenius Faculty of Medicine in Martin, Comenius University in Bratislava, Martin, Slovakia, 5Clinic of Neurology, Jessenius Faculty of Medicine in Martin, Comenius University in Bratislava, Martin, Slovakia, 6Christian Doppler Laboratory for Clinical Molecular MR Imaging, Vienna, Austria
    High-resolution MRSI at 7T can visualize MS pathology not visible on clinical MRI. Metabolic abnormalities in normal-appearing white matter and cortical gray matter, reflecting loss of axonal integrity and neuroinflammation-induced astrogliosis, correlate with clinical disability.
    Figure 2: Abnormal metabolic images of mI, NAA, and mI/NAA together with clinical MRI in patients with MS. Small subcortical/juxtacortical lesions (A), which appear inconspicuous on high-resolution MRI (indicated with blue arrows), are well depicted on mI/NAA maps. In (B), red arrows indicate regions in the NAWM with increased mI only, and yellow arrows indicate regions with increased mI and decreased NAA, where no, or only diffuse changes are visible on clinical MRI. Green arrows indicate white matter lesions, where elevated mI appears beyond T2-visible pathology.
    Figure 3: Examples of metabolic ratio images and clinical MRI from healthy controls and MS patients with various levels of clinical disability. mI/tCr and mI/NAA tended to be increased in the NAWM of all patient subgroups, while NAA/tCr was decreased only in subgroups of patients with mild and more severe clinical disability.
  • Neurometabolic changes in RRMS: comparison between fingolimod and injectables therapies
    Oun Al-iedani1,2, Saadallah Ramadan2,3, Karen Ribbons2, Rodney Lea2, and Jeannette Lechner-Scott2,4,5
    1School of Health Sciences, University of Newcastle, Newcastle, Australia, 2Hunter Medical Research Institute, Newcastle, Australia, 3Faculty of Health and Medicine, University of Newcastle, Newcastle, Australia, 4Department of Neurology, John Hunter Hospital, Newcastle, Australia, 5School of Medicine and Public Health, University of Newcastle, Newcastle, Australia

    Clinical parameters, MR-volumetrics and neurometabolic concentrations showed no statistically significant differences between fingolimod and injectable cohorts. MRI metrics and neurometabolites from PCG and PFC, showed moderate correlations with cognition, fatigue and memory.


    Figure 2. (A):Brain tissue volume, normalised for subject head size, was estimated with SIENAX. Final SIENAX segmentation results of whole brain (top row) and peripheral cortex masked segmentation (bottom row). (B):Partial volume segmentation of the MS lesions using T2-FLAIR and filled T1-MPRAGE structural image was segmented using FSLFAST.
    Figure 3. (A)PCG neurometabolite/tCr ratio (tNAA and Glx) in HCs and RRMS fingolimod and injectables (INJ: GA+interferon) disease modifying therapies. (B) PFC neurometabolite/tCr ratio (NAA and m-Ins) in HCs and RRMS fingolimod and injectable (INJ: GA+interferon) DMTs.
  • Grey Matter Cerebrovascular Reactivity in Multiple Sclerosis and its Changes with Immunomodulation: a Breath-Hold BOLD-MRI Study
    Antonio Maria Chiarelli1, Daniele Mascali1, Nikolaos Petsas2, Carlo Pozzilli2, Richard Geoffrey Wise1, and Valentina Tomassini1
    1Department of Neuroscience, Imaging and Clinical Sciences, University G. D'Annunzio of Chieti Pescara, Chieti Scalo, Italy, 2Department of Neurology and Psychiatry, Sapienza University, Rome, Italy
    BOLD-CVR in MS increased, and the identified association with GM volume was lost, with immunomodulatory therapy.  Cerebrovascular alteration in MS is modifiable by immunomodulation. If persistent, it  may contribute to neurodegeneration.
    Figure 3: Maps of change in CVR with immunomodulation in MS patients: (a) map in absolute units; (b) Statistical Parametric (t-score) map; (c) thresholded (p<0.05) map of null-hypothesis probability, corrected for multiple comparison using the threshold free cluster enhancement (TFCE) approach. Coordinates (in mm) refers to the MNI152 template.
    Figure 2: (a) Global CVRs in GM; Left: Average and associated standard error of the mean; Right: Violin plots. (b) Change in CVR with treatment as a function of the pre-treatment CVR in GM. (** p<0.01)
  • Toward Fully Automated Assessment of the Central Vein Sign Using Deep Learning
    Till Huelnhagen1,2,3, Omar Al Louzi4, Mário João Fartaria1,2,3, Lynn Daboul4, Pietro Maggi5,6, Cristina Granziera7,8,9, Meritxell Bach Cuadra2,3,10, Jonas Richiardi2, Daniel S Reich4, Tobias Kober1,2,3, and Pascal Sati4,11
    1Advanced Clinical Imaging Technology, Siemens Healthcare AG, Lausanne, Switzerland, 2Department of Radiology, Lausanne University Hospital and University of Lausanne, Lausanne, Switzerland, 3Signal Processing Laboratory (LTS 5), Ecole Polytechnique Fédérale de Lausanne (EPFL), Lausanne, Switzerland, 4Translational Neuroradiology Section, National Institute of Neurological Disorders and Stroke, National Institutes of Health (NIH), Bethesda, MD, United States, 5Department of Neurology, Lausanne University Hospital and University of Lausanne, Lausanne, Switzerland, 6Cliniques universitaires Saint-Luc, Université catholique de Louvain, Brussels, Belgium, 7Neurologic Clinic and Policlinic, Departments of Medicine, Clinical Research and Biomedical Engineering, University Hospital Basel and University of Basel, Basel, Switzerland, 8Translational Imaging in Neurology (ThINk) Basel, Department of Medicine and Biomedical Engineering, University Hospital Basel and University of Basel, Basel, Switzerland, 9Research Center for Clinical Neuroimmunology and Neuroscience (RC2NB) Basel, University Hospital Basel and University of Basel, Basel, Switzerland, 10Medical Image Analysis Laboratory (MIAL), Centre d'Imagerie BioMédicale (CIBM), University of Lausanne, Lausanne, Switzerland, 11Department of Neurology, Cedars-Sinai Medical Center, Los Angeles, CA, United States
    This work proposes an improved version of a convolutional neural network for the automated assessment of the central vein sign in brain MRI that can accurately classify lesions of all central vein sign types without requiring manual preselection.
    Figure 2: CNN architecture: An ensemble of 10 parallel networks was used for classifying lesion patches as either CVS+, CVS−, or CVSe. With regard to the previous CVSNet implementation, a third output class for CVSe was added, and different combinations of input channels were tested to investigate their impact on the classification performance.
    Figure 4: Lesion-wise performance comparison of the different models in the pure testing set for each class. Overall performance was rather similar across the models but increased slightly with the number of used input channels, except for model E, which showed comparable performance to model D despite having three additional input channels. Accuracy levels are highlighted, as this is regarded the most relevant metric with respect to a clinical application. With accuracies of 75% to 80% in the best models, the network performance is approaching levels of human inter-rater agreement.
  • Damage of Different CNS Compartments Contributes to Explain Multiple Sclerosis Disability Milestones: A Multicenter Study
    Paola Valsasina1, Milagros Hidalgo de la Cruz1, Alessandro Meani1, Claudio Gobbi2,3, Antonio Gallo4, Chiara Zecca2,3, Alvino Bisecco4, Maria A. Rocca1,5,6, and Massimo Filippi1,5,6,7,8
    1Neuroimaging Research Unit, Division of Neuroscience, IRCCS San Raffaele Scientific Institute, Milan, Italy, 2Multiple Sclerosis Center, Department of Neurology, Neurocenter of Southern Switzerland, Civic Hospital, Lugano, Switzerland, 3Faculty of Biomedical Sciences, Università della Svizzera Italiana, Lugano, Switzerland, 4Department of Advanced Medical and Surgical Sciences, and 3T MRI Center, University of Campania “Luigi Vanvitelli”, Naples, Italy, 5Neurology Unit, IRCCS San Raffaele Scientific Institute, Milan, Italy, 6Vita-Salute San Raffaele University, Milan, Italy, 7Neurorehabilitation Unit, IRCCS San Raffaele Scientific Institute, Milan, Italy, 8Neurophysiology Service, IRCCS San Raffaele Scientific Institute, Milan, Italy
    In multiple sclerosis, random forest identified brain lesion volume, grey matter and thalamic atrophy as the main determinants of low clinical disability (EDSS=3.0 and 4.0), while cervical cord damage was the major contributor to EDSS=6.0.
    Figure 1. Calculation of the different CNS compartments in a study subject. A) Global brain volumetry (FSL SIENAx); B) Cortical thickness (Freesurfer) and related cortical parcellation using Desikan atlas; C) Deep grey matter volume (FSL FIRST); D) Cerebellar volumes (SPM12 SUIT); and E) Cervical cord segmentation (Jim software, active surface method). Each colour represents a different compartment for each subgroup of images. Abbreviations: CTh=cortical thickness; GM=grey matter; AS=active surface; A=anterior; P=posterior; S=superior; I=inferior; L=left; R=right.
    Figure 2. Bar charts showing relative importance of MRI predictors of EDSS score, and of reaching different EDSS milestone (3.0, 4.0, 6.0), in MS patients selected with random forest analyses (p<0.05). Colors reflect the magnitude of Spearman’s correlation of each predictor with EDSS score. Standardized beta coefficient from univariate logistic regression models is represented for classification models. NGMV=normalized grey matter volume; NBV=normalized brain volume; CTh=cortical thickness; CSAn=normalized cross-cross sectional area; DGM=deep grey matter
  • Multiparametric quantitative postmortem 3T-MRI of histopathological lesion types in multiple sclerosis
    Riccardo Galbusera1,2,3, Erik Bahn4, Matthias Weigel2,3,5, Po-Jui Lu1,2,3, Muhamed Barakovic1,2,3, Reza Rahmanzadeh1,2,3, Peter Dechent6, Antoine Lutti7, Govind Bhagavatheeshwaran8, Ludwig Kappos2,3, Wolfgang Brück4, Christine Stadelmann-Nessler4, and Cristina Granziera1,2,3
    1Neurology Clinic and Policlinic, Departments of Medicine, Clinical Research and Biomedical Engineering, University Hospital Basel and University of Basel, Basel, Switzerland, Basel, Switzerland, 2Translational Imaging in Neurology (ThINk) Basel, Department of Biomedical Engineering, University Hospital Basel and University of Basel, Basel, Switzerland, Basel, Switzerland, 3Research Center for Clinical Neuroimmunology and Neuroscience (RC2NB) Basel, University Hospital Basel and University of Basel, Basel, Switzerland, Basel, Switzerland, 4Institute of Neuropathology, University Medical Center, Göttingen, Germany, Göttingen, Germany, 5Division of Radiological Physics, Department of Radiology, University Hospital Basel, Basel, CH, Basel, Switzerland, 6Department of Cognitive Neurology, MR-Research in Neurosciences, University Medical Center Göttingen, Göttingen, Germany, Göttingen, Germany, 7Centre for Research in Neuroscience - Department of Clinical Neurosciences, Laboratoire de recherche en neuroimagerie (LREN) University Hospital and University of Lausanne, Lausanne, Switzerland, Lausanne, Switzerland, 8National Institute of Neurological Disorders and Stroke, Bethesda, MD, USA, Bethesda, MD, United States
    We have identified the imaging correlates of multiple sclerosis lesion subtypes by exploiting post-mortem multiparametric quantitative MRI and histopathological analysis. Remyelinated lesions showed distinct MRI characteristics compared to other MS lesions.
    Figure 1. Immunohistological staining for myelin basic protein (MBP) and for CR3/43 (left) and parametric maps (MTsat, MWF, qT1, QSM) showing the characteristics of different histopathological MS lesions subtypes in (right): A) inactive lesion; (B) active lesion; (C) mixed active/inactive lesions and (D) remyelinated part of a lesion.
    Figure 2. Quantitative MRI measures across different lesion categories and NAWM. *** p < 0,0001; ** p< 0,001, * p< 0,05.
  • An investigation of the sensitivity of diffusion-based microstructure combined with network analysis in multiple sclerosis
    Sara Bosticardo1, Simona Schiavi1, Sabine Schaedelin2, Po-Jui Lu3,4, Muhamed Barakovic2,3, Matthias Weigel2,3,5, Ludwig Kappos3,4, Jens Kuhle3,4, Alessandro Daducci1, and Cristina Granziera2,3,4
    1Department of Computer Science, University of Verona, Verona, Italy, 2Departments of Medicine, Clinical Research and Biomedical Engineering, Neurology, University Hospital Basel and University of Basel, Basel, Switzerland, 3Department of Medicine and Biomedical Engineering, University Hospital Basel and University of Basel, Neurologic Clinic and Policlinic, Translational Imaging in Neurology (ThINk), Basel, Switzerland, 4Research Center for Clinical Neuroimmunology and Neuroscience, Basel, Switzerland, 5Department of Radiology, Division of Radiological Physics, University Hospital Basel, Basel, Switzerland
    Comparing 3 different diffusion-based microstructural models to weight the structural connections and derive networks properties, we found that microstructural maps reflecting intra-axonal signal fractions are the most sensitive to multiple sclerosis.
    Figure 1: Flowchart for the construction of structural connectivity networks based on tractometry. Combining the T1 parcellation, the tractogram and 3 different diffusion models, we built the connectomes weighted by different microstructural maps and we compared their topological properties.
    TABLE 1: Group comparison performed with the linear robust model, where Gender, Age and Density are covariates. A Holm Post-Hoc correction was applied (i) for each network metrics of each microstructural map (Adj p-value metrics) and (ii) for each network metrics extracted from all microstructural maps of every diffusion model (Adj p-value model) to account for multiple comparison. Statistically significant results are highlighted in bold.
  • Relayed nuclear Overhauser effect (rNOE) imaging identifies multiple sclerosis: an initial human study
    Jianpan Huang1, Jiadi Xu2,3, Joseph H. C. Lai1, Henry K. F. Mak4, Koon Ho Chan5, and Kannie W. Y. Chan1,3,6
    1Department of Biomedical Engineering, City University of Hong Kong, Hong Kong, China, 2F.M. Kirby Research Center for Functional Brain Imaging, Kennedy Krieger Research Institute, Baltimore, MD, United States, 3Russell H. Morgan Department of Radiology and Radiological Science, The Johns Hopkins University School of Medicine, Baltimore, MD, United States, 4Department of Diagnostic Radiology, Li Ka Shing Faculty of Medicine, The University of Hong Kong, Hong Kong, China, 5Department of Medicine, Li Ka Shing Faculty of Medicine, The University of Hong Kong, Hong Kong, China, 6City University of Hong Kong Shenzhen Research Institute, Shenzhen, China
    A pulsed-CEST imaging scheme was applied to acquire relayed nuclear Overhauser effect weighted (rNOEw) images of human brain at 3T and significant lower rNOEw signal were found in multiple sclerosis (MS) brains compared to neuromyelitis optica (NMO) and healthy brains.
    FIGURE 1. An exemplary illustration of generating rNOE weighted (rNOEw) images (C) using control images (A) and label images (B).
    FIGURE 2. Representative rNOEw images of NC (A), NMO (B) and MS (C). (D) comparison of rNOEw signal among three cohorts of subjects (NC = 20, NMO = 15, MS = 20). Significance levels: *, p<0.05; **, p<0.01.
Back to Top
Digital Poster Session - MS: White Matter & Other Structures
Neuro
Wednesday, 19 May 2021 13:00 - 14:00
  • Sex-based differences in tissue microstructure in multiple sclerosis detected using multi-model diffusion MRI
    Olayinka Adeoluwa Oladosu1, Cayden Murray2, Syed Rizvi2, Mariana Bento3,4, G Bruce Pike3,4, and Yunyan Zhang3,4
    1Neuroscience, University of Calgary, Calgary, AB, Canada, 2University of Calgary, Calgary, AB, Canada, 3Radiology, University of Calgary, Calgary, AB, Canada, 4Clinical Neurosciences, University of Calgary, Calgary, AB, Canada
    Women and men appear to have different microstructure patterns in multiple sclerosis. Men had greater lesion microstructural damage and women showed different microstructure patterns associated with injectable and oral medications according to diffusion MRI.
    Figure 1. Lesion-NAWM asymmetries compared between men and women. Diffusion tensor imaging (top), high angular resolution compartment (middle), and diffusion orientation analyses indicate differences in lesion-NAWM asymmetry between women and men. *p<0.05, **p<0.01
    Figure 2. Diffusion metrics reflecting significant differences in microstructure pathology between men and women. Calculation of diffusion measures took advantage of the A) average diffusion b0. Measures showing significant sex-differences in microstructure include B) radial diffusivity, C) mean diffusivity, and D) fractional anisotropy diffusion tensor measures as well as E) axonal density, F) axonal diameter, G) intracellular volume fraction and H) orientation distribution function energy.
  • Tracking longitudinal disease progression of MS during fingolimod therapy using SFCI, a combined structural and functional connectivity metric
    Pallab K Bhattacharyya1, Robert Fox1, Jian Lin1, Paola Raska1, Ken Sakaie1, and Mark J Lowe1
    1Cleveland Clinic Foundation, CLEVELAND, OH, United States
    SFCI, a combined structural and functional connectivity metric (derived by combining DTI and functional connectivity measures), is a sensitive imaging-based measure of disease progression of multiple sclerosis following clinical intervention. 
    Fig. 3. Combined structural and functional connectivity for (a) motor, (b) cognitive pathways and (c) pathway-combined SFCI evolution over 24 months of fingolimod therapy.
    Fig. 1. Equations for calculating motor- and cognitive-pathway specific combined connectivity measures (Eq. 1 and 2) and SFCI (Eq. 3). SMC: motor pathway, FP: cognitive pathway, fc: functional connectivity, TD: transverse diffusivity.
  • Greater increase in magnetic susceptibility following acute MS lesion formation is associated with reduced myelin repair
    Lily Zexter1, Thanh D. Nguyen2, Elizabeth M. Sweeney3, Yi Wang2, and Susan A. Gauthier1
    1Department of Neurology, Weill Cornell Medicine, New York, NY, United States, 2Department of Radiology, Weill Cornell Medicine, New York, NY, United States, 3Department of Population Health Sciences, Weill Cornell Medicine, New York, NY, United States
    We analyzed 49 new Gadolinium-enhancing MS lesions and found that that the change in lesion QSM at three months was significantly and negatively associated with change in myelin water fraction at one year.
    Figure 4: Mixed model results
    Figure 1: Example of MS lesion with greater initial change in susceptibility and less myelin recovery at 12 months
  • Hippocampal subfield volumes relate to future cognitive performance in Multiple Sclerosis
    Katherine A Koenig1, Jian Lin1, Daniel Ontaneda1, Kedar Mahajan1, Jenny Feng1, Stephen Rao1, Sanghoon Kim1, Stephen Jones1, and Mark J Lowe1
    1The Cleveland Clinic, Cleveland, OH, United States
    Using 7 tesla MRI, we measured hippocampal subfield volumes in 77 participants with Multiple Sclerosis. Subfield volumes were related to future cognitive performance, driven by the relapse remitting MS sample.
    Figure 1. Representative hippocampal segmentation, showing sagittal (left) and coronal (right) slices. The top panel highlights the segmentation, while the bottom panel shows the underlying anatomy. (light orange - DG; yellow - CA1; green - SUB; dark orange - CA2 and CA3)
    Figure 2. Relationship of TP1 right SUB volume and TP1 verbal fluency. The fit line represents the full sample. (FULL= full sample; RR = relapse remitting sample; SP = secondary progressive sample)
  • Diffusely abnormal white matter in clinically isolated syndrome is associated with parenchymal loss and elevated neurofilament levels
    Irene Margaret Vavasour1, Jackie T Yik2,3, Pierre Becquart4, Jasmine Gill4, Shannon H Kolind1,2,3,5, Alice J Schabas5, Ana-Luiza Sayao5, Virginia Devonshire5, Robert Carruthers5, Anthony Traboulsee5, GR Wayne Moore3,4,5, Sophie Stukas4, Cheryl Wellington4, Jacqueline Quandt4, David KB Li1, and Cornelia Laule1,2,3,4
    1Radiology, University of British Columbia, Vancouver, BC, Canada, 2Physics and Astronomy, University of British Columbia, Vancouver, BC, Canada, 3International Collaboration on Repair Discoveries (ICORD), University of British Columbia, Vancouver, BC, Canada, 4Pathology and Laboratory Medicine, University of British Columbia, Vancouver, BC, Canada, 5Medicine, University of British Columbia, Vancouver, BC, Canada
    Diffusely abnormal white matter (DAWM) was found in 35% of clinically isolated syndrome (CIS) and ~60% of multiple sclerosis participants. CIS with DAWM had more negative brain health markers (e.g. smaller cortical thickness, more lesions, higher neurofilament) compared to CIS without DAWM.
    Figure 4: Boxplots divided based on participant subtype (clinically isolated syndrome (CIS), relapsing-remitting multiple sclerosis (RR) and secondary progressive multiple sclerosis (SP)) with (+) and without (–) diffusely abnormal white matter (DAWM). Neurofilament values were normalised to matched healthy control values. Significance between DAWM– and DAWM+ are indicated with *p<0.05, **p<0.005.
    Figure 3: Neurofilament (NfL) and MRI measurements (mean and (range)) for the different MS subtypes with (+) and without (–) diffusely abnormal white matter (DAWM) (CIS: clinically isolated syndrome; RRMS: relapsing-remitting multiple sclerosis; SPMS: secondary progressive multiple). Bolded values indicate a significant difference between DAWM+ and DAWM–.
  • Periventricular gradients of brain pathology in early and progressive MS revealed by qMRI
    Gian Franco Piredda1,2,3, Tom Hilbert1,2,3, Manuela Vaneckova4, Jan Krasensky4, Michaela Andelova5, Tomas Uher5, Barbora Srpova5, Eva Kubala Havrdova5, Karolina Vodehnalova5, Dana Horakova5, Veronica Ravano1,2,3, Bénédicte Maréchal1,2,3, Jean-Philippe Thiran2,3, and Tobias Kober1,2,3
    1Advanced Clinical Imaging Technology, Siemens Healthcare AG, Lausanne, Switzerland, 2Department of Radiology, Lausanne University Hospital and University of Lausanne, Lausanne, Switzerland, 3LTS5, École Polytechnique Fédérale de Lausanne (EPFL), Lausanne, Switzerland, 4Department of Radiology, First Faculty of Medicine, Charles University and General University Hospital, Prague, Poland, 5Department of Neurology and Center of Clinical Neuroscience, First Faculty of Medicine, Charles University and General University Hospital, Prague, Poland
    Using high-resolution, whole brain T1 mapping, a periventricular gradient of abnormality was detected in normal-appearing white matter, increasing from early to progressive stages of multiple sclerosis.
    Figure 4. Periventricular gradients of (A) abnormal WM volume (ml) and (B) normalized abnormal WM volume to the total band volume, which were identified as the NAWM voxel exceeding a z-score threshold of 2 (i.e. exceeding the prediction interval at 95% level of confidence of the T1 normative linear model). Periventricular gradients in NAWM of (C) absolute z-scores and (D) absolute z-scores > 2. Error bars indicate two standard errors. Reported values in the first band should be carefully considered as they may be affected by partial-volume effects between CSF and WM tissues.
    Figure 2. Representative example z-score maps overlaid onto the MP2RAGE contrast in early MS patients with low Expanded Disability Status Scale (EDSS) scores and progressive MS patients with higher EDSS.
  • T1 abnormalities in atlas-based white matter tracts: reducing the clinico-radiological paradox in multiple sclerosis using qMRI
    Veronica Ravano1,2,3, Gian Franco Piredda1,2,3, Manuela Vaneckova4, Jan Krasensky4, Michaela Andelova5, Tomas Uher5, Barbora Srpova5, Eva Kubala Havrdova5, Karolina Vodehnalova5, Dana Horakova5, Tom Hilbert1,2,3, Bénédicte Maréchal1,2,3, Reto Meuli2, Jean-Philippe Thiran2,3, Tobias Kober1,2,3, and Jonas Richiardi2
    1Advanced Clinical Imaging Technology, Siemens Healthineers, Lausanne, Switzerland, 2Department of Radiology, Lausanne University Hospital and University of Lausanne, Lausanne, Switzerland, 3LTS5, Ecole Polytechnique Fédérale de Lausanne, Lausanne, Switzerland, 4Department of Radiology, First Faculty of Medicine, Charles University and General University Hospital, Prague, Czech Republic, 5Department of Neurology and Center of Clinical Neuroscience, First Faculty of Medicine, Charles University and General University Hospital, Prague, Czech Republic
    Evaluating T1 relaxometry abnormalities in normal-appearing WM along atlas-based WM tracts improves correlation to clinical multiple sclerosis scores compared to standard metrics based on lesion load. Infratentorial tracts were found to be the most strongly correlated with disability.
    Figure 1. Representative distributions of T1 z-scores in example WM tracts of two patients with different Expanded Disability Status Scale (EDSS) score overlayed on the MPRAGE contrast. A more severe alteration of WM tissues was found in the patient with higher EDSS. WM tracts abbreviations: CST: cortico spinal tract; CC: corpus callosum; CT: corticothalamic pathway; ILF: inferior longitudinal fasciculus; ML: medial lemniscus; MCP: middle cerebellar peduncle.
    Figure 2. Spearman correlations of WM tract-specific metrics with EDSS scores. (A) Table of WM tract names and corresponding abbreviations arranged into the five main brain pathways categories (namely association, projection, brainstem, cerebellum and commissural). (B) Tract-specific lesion loads compared to Total Lesion Volume (TLV) and Total Lesion Count (TLC). (C) Tract-specific T1 abnormalities within lesions. (D) Tract-specific T1 abnormalities in NAWM. (E) Tract-specific T1 abnormalities in the whole WM (NAWM + lesions).
  • 3.0 T MRI detects brain ventricle oscillations in patients with clinically-isolated syndrome
    Jason Michael Millward1, Claudia Chien2, Joseph Kuchling2, Friedemann Paul2, Thoralf Niendorf1, and Sonia Waiczies1
    1Berlin Ultrahigh Field Facility (B.U.F.F.), Max Delbrück Center for Molecular Medicine in the Helmholtz Association, Berlin, Germany, 2NeuroCure Clinical Research Center, Charité - Universitätsmedizin Berlin, Berlin, Germany
    Longitudinal 3T scans of patients with clinically isolated syndrome reveal that brain ventricle volumes do not exclusively expand unidirectionally but in some patients can expand and contract, even over a period of years. Patients with contracting ventricles were younger than those without.
    Relative ventricle volumes for individual patients (conversion to RRMS depicted by red). A. A substantial fraction of the CIS patients (23%) showed contractions of ventricle volumes over time, beyond the range of variation in healthy subjects (±6%). B. The majority of CIS patients did not show contractions in ventricle volume beyond the range of variation of healthy subjects. Many of these patients, both those who converted to RRMS and those who did not, showed increased ventricle volume over time, consistent with brain atrophy and neurodegeneration.
    A. There was no significant difference in median EDSS between CIS patients with and without ventricle contractions >6%. The EDSS of the MS patients with contractions was similar to that of the CIS patients; EDSS of MS patients with contractions was significantly lower than that of MS patients without contractions (p=0.0063, Mann-Whitney test). B. CIS patients with ventricle contractions >6% were significantly younger than those without (p=0.0447, Mann-Whitney test). In the MS cohort, patients with ventricle contractions trended lower in age, though this is not significant.
  • Structural connectivity is more sensitive to track cognition progression individual level than fMRI and MEG over 2 years in mildly disabled RRMS
    Arzu Ceylan Has Silemek1, Guido Nolte2, Jana Pöttgen1,3, Andreas K. Engel4, Christoph Heesen1,3, Stefan M. Gold1,5, and Jan-Patrick Stellmann6,7
    1Institute of Neuroimmunology and Multiple Sclerosis (INIMS), University Medical Center Eppendorf, Hamburg, Germany, 2Department of Neurophysiology and Pathophysiology, University Medical Center Eppendorf, Hamburg, Germany, 3Department of Neurology, University Medical Center Eppendorf, Hamburg, Germany, 4Institute of Neurophysiology and Pathophysiology, University Medical Center Eppendorf, Hamburg, Germany, 5Department of Psychiatry and Psychotherapy, Charité University Medical Center, Campus Benjamin Franklin, Hindenburgdamm 30, Berlin, Germany, 6CRMBM AMU-CNRS, Aix-Marseille Université, Marseille, France, 7CEMEREM, APHM, CHU Timone, Marseille, France
    The effect of disability progression on network organization was estimated in RRMS. Structural connectivity was more sensitive to show a relation with a cognitive function over 2 years than fMRI and MEG metrics in MS. This study underline the difficulties related with functional imaging in MS.
    Figure 2. Hub disruption over 2 years in patients (yellow) and HC (purple). Header of the each plot indicates the visit month. Each imaging metric is shown from up to down as DTI, rs-fMRI and MEG respectively. The mean connectivity of each node of each metric in the group of controls at baseline (x axis, ⟨Healthy at Baseline⟩) is plotted versus the difference between groups in mean connectivity of each node of each metric in each group at each visit and mean connectivity of each node of each metric in the group of controls at baseline (y axis, ⟨Groups at each visit – Healthy at Baseline⟩).
    Figure 3. The correlation between individual hub disruption of each imaging metric and PASAT performance over 2 years in MS. Header of the each plotshows the visit month (0: baseline, 12: 1-year, 24: 2-year). Orange, green and blue indicate the structural, rs-fMRI and MEG hub disruption respectively. Slope of each imaging metric (x axis) is the ratio of the mean connectivity of each node in the group of controls at baseline to the the difference in connectivity of each node of each subject at each visit and mean connectivity of each node in the group of controls at baseline.
  • Blood-brain barrier permeability changes in multiple sclerosis during alemtuzumab treatment
    Maria Højberg Knudsen1,2, Helle Juhl Simonsen1, Jette Lautrup Battistini Frederiksen2,3, Ulrich Lindberg1, Mark Bitsch Vestergaard1, Henrik Bo Wiberg Larsson1,2, and Stig Præstekjær Cramer1
    1Dept. Clinical Physiology, Rigshospitalet, Glostrup, Denmark, 2Department of Clinical Medicine, University of Copenhagen, Copenhagen, Denmark, 3Dept. of Neurology, Rigshospitalet, Glostrup, Denmark
    The treatment associated change in the patlak derived influx constant in grey matter of relapsing-remitting multiple sclerosis patients undergoing alemtuzumab treatment predicted disease activity within two years and may be used as a biomarker of treatment efficacy.
    Change in grey matter BBB permeability from baseline to six months for subjects with and without (NEDA) disease activity within two years. Mean difference –0.038 ml/100g/min, 95% confidence interval -0.073;-0.004, p = 0.03.
    Change in grey matter BBB permeability from baseline after treatment as measured by Ki for subjects with and without (NEDA) disease activity within two years. Dashed lines = individual trajectories, solid line = group means, error bars = means ± standard error of the mean.
  • Ultrahigh-b radial Diffusion Weighted Imaging (UHb-rDWI) of Wild Type and Shiverer Mouse Spines
    Kyle Jeong1, You-Jung Lee1, Suk-Keu Yeom2, Noel Carlson3, Lubdha Shah4, John Rose5, and Eun-Kee Jeong4
    1Utah Center for Advanced Imaging research, University of Utah, Salt Lake City, UT, United States, 2Radiology, Korea University Ansan Hospital, Ansan, Korea, Republic of, 3GRECC, Veteran Affairs, Salt Lake City, UT, United States, 4Radiology and Imaging Sciences, University of Utah, Salt Lake City, UT, United States, 5Neuroimmunology Division, University of Utah, Salt Lake City, UT, United States
    The purpose of the study was to perform a quantitative evaluation of myelination on genetically engineered myelin-deficit shiverer mice and wild-type mice using ultrahigh-b diffusion MRI (UHb-DWI).
    Fig. 1. DWIs of b=9380 s/mm2 of (col I) shiverer and (col II) WT mice spinal cords, and signal-b curves of (c) anterior-dorsal and (f) posterior-dorsal column, and (i) lateral white-matter tracts up to b = 42,890 s/mm2 for UHb-rDWI and 2210 s/mm2 for UHb-aDWI. Signals were averaged over two nearby slices of two shiverer (red) and two adjacent slices of six WT (black) mouse spinal cords.
    Fig. 2. EM images of dorsal (sensory) column of (a, c) shiverer and (b, d) WT mice spinal cords in two different magnifications (a, b) x1,100 and (c, d) x11,000. In this EM picture, the myelin sheaths of the shiverer mouse is less numbered and looser than that of the wild-type mouse.
  • Evaluation of PASAT test performance and diffusivity indices in U-fiber regions in healthy subjects and RRMS patients.
    Cristian Andrés Montalba1,2,3, Tomás Labbe4,5, Marcelo Andia1,2,3, Miguel Guevara6, Jean-François Mangin7, Juan Pablo Cruz2, Ethel Ciampi8,9, Claudia Carcamo5,8, Pamela Guevara6, and Sergio Uribe1,2,3
    1Biomedical Imaging Center, Pontificia Universidad Católica de Chile, Santiago, Chile, 2Radiology Department, School of Medicine, Pontificia Universidad Católica de Chile, Santiago, Chile, 3Millennium Nucleus for Cardiovascular Magnetic Resonance, Santiago, Chile, 4School of Medicine, Pontificia Universidad Católica de Chile, Santiago, Chile, 5Interdisciplinary Center of Neurosciences, Pontificia Universidad Católica de Chile, Santiago, Chile, 6Faculty of Engineering, Universidad de Concepción, Concepción, Chile, 7UNATI, Neurospin, CEA, Université Paris-Saclay, Gif-sur-Yvette, France, 8Neurology Department, School of Medicine, Pontificia Universidad Católica de Chile, Santiago, Chile, 9Neurology Service, Hospital Dr. Sótero del Río, Santiago, Chile
    PASAT test scores are significantly linear related to Frontal, Temporal, and Parietal cortical areas in healthy subjects. There is no linear relationship between PASAT test scores and diffusivity maps in RRMS patients.
    Figure 2. Healthy subject results: Upper: Bar and error plots, and Under: Table of U-fiber labels.
    Figure 1. Processing steps realized to obtain the U-fiber diffusivity maps (FA, MD, RD, and AD). (i) Segmentation of Diffusivity maps, using DSI Studio software. (ii) Coregistration between diffusivity maps and T1w-3D image. (iii) Normalization of T1w-3D image to the MNI space. (iv) The deformation matrix of the Normalized T1w-3D image was applied to the U-fiber masks in order to adapt to the diffusivity maps (Inverse normalization). (v) Application of the LNAO-SWM79 Atlas mask to each patient’s diffusivity map.
  • Assessment of white matter damages in Multiple Sclerosis using normative templates of conventional and inhomogeneous Magnetization Transfer
    Lucas Soustelle1,2, Andreea Hertanu1,2, Arnaud Le Troter1,2, Soraya Gherib1,2, Samira Mchinda1,2, Patrick Viout1,2, Lauriane Pini1,2, Claire Costes1,2, Sylviane Confort-Gouny1,2, Adil Maarouf1,2,3, Bertrand Audoin1,2,3, Audrey Rico1,2,3, Clémence Boutière1,2,3, Maxime Guye1,2, Jean-Philippe Ranjeva1,2, Gopal Varma4, David C. Alsop4, Jean Pelletier1,2,3, Guillaume Duhamel1,2, and Olivier M. Girard1,2
    1Aix Marseille Univ, CNRS, CRMBM, Marseille, France, 2APHM, Hôpital Universitaire Timone, CEMEREM, Marseille, France, 3APHM, Hôpital Universitaire Timone, Service de neurologie, Marseille, France, 4Division of MR Research, Radiology, Beth Israel Deaconess Medical Center, Harvard Medical School, Boston, MA, United States
    Characterization of WM impairments in MS is performed by comparing ihMT and conventional MT normalized in a standard space. Results revealed how the signal in normal-appearing and lesional WM is affected, and highlighted that both metrics provide complementary information.
    Figure 1: Representative views of MTR and ihMTR template maps from the healthy control population.
    Figure 3: FWE-corrected (1-p)-value maps of the voxel-based analysis in the MNI space between MS and HC subjects for ihMTR (yellow) and MTR (blue). (1-p)-value maps are shown in a range spanning from 0.95 to 1.00.
  • Assessing proximal and distal peripheral nerve damage in relapsing-remitting multiple sclerosis using magnetisation transfer ratio
    Marios C. Yiannakas1, Ratthaporn Boonsuth1, Carmen Tur1,2, Marco Battiston1, Francesco Grussu1,3, Rebecca S. Samson1, Torben Schneider4, Masami Yoneyama5, Ferran Prados1,6,7, Sara Collorone1, Rosanna Cortese1, Olga Ciccarelli1, and Claudia A. M. Gandini Wheeler-Kingshott1,8,9
    1NMR Research Unit, Queen Square MS Centre, Department of Neuroinflammation, UCL Queen Square Institute of Neurology, Fuculty of Brain Sciences, University College London, London, United Kingdom, 2Multiple Sclerosis Centre of Catalonia (Cemcat), Vall d’Hebron Institute of Research, Vall d'Hebron Barcelona Hospital Campus, Barcelona, Spain, 3Radiomics Group, Vall d’Hebron Institute of Oncology, Vall d’Hebron Barcelona Hospital Campus, Barcelona, Spain, 4Philips Healthcare, Surrey, Guildford, United Kingdom, 5Philips Japan, Minatoku, Tokyo, Japan, 6Centre for Medical Image Computing, Medical Physics and Biomedical Engineering, University College London, London, United Kingdom, 7Universitat Oberta de Catalunya, Barcelona, Spain, 8Department of Brain and Behavioural Sciences, University of Pavia, Pavia, Italy, 9Brain Connectivity Research Centre, IRCCS Mondino Foundation, Pavia, Italy
    In this pilot in vivo study, magnetisation transfer ratio measurements in the sciatic nerve of people with relapsing-remitting multiple sclerosis show significantly reduced values as compared to healthy controls suggesting alteration in myelin content.
    Figure 1. A) Prescription of the 3D SHINKEI and MTR sequences for imaging the lumbar plexus in the coronal plane: B) Example image obtained using the 3D SHINKEI at the level of the lumbar plexus (L2-L4 segments shown); C) Manual segmentation of the lumbar segments with separate binary masks created for the preganglionic, ganglionic and postganglionic regions shown in blue, red, yellow, respectively.
    Figure 2. A) Prescription of the high-resolution fat-suppressed T2-weighted and MTR sequences for imaging the sciatic nerve in the axial plane; B) Example image obtained using the high-resolution fat-suppressed T2-weighted sequence; C) Manual segmentation of the sciatic nerve (binary mask shown in yellow).
  • Automatic Segmentation of Diffusely Abnormal White Matter in MS Using Deep Neural Network
    Refaat E Gabr1 and Ponnada A Narayana1
    1Diagnostic and Interventional Imaging, University of Texas Health Science Center at Houston, Houston, TX, United States
    DAWM was segmented in MS patients using neural network. 45% of DAWM persisted and 15% converted to T2 lesions at 60 months.
    Fig. 2: FLAIR images and DL segmentation from an MS patient in the CombiRx study over 60 months. Good delineation is obtained for brain tissue, lesions (red), and DAWM (blue). Part of DAWM can be clearly seen to evolve into focal lesions (red arrowhead), while other parts of DAWM (blue arrowhead) persisted for 60 months.
    Fig. 1. DAWM segmentation using CNN. A U-net is trained for brain segmentation (GM, WM, CSF, T2L) from multimodal MR images. The output tissue scores are used in histogram and connectivity analysis to obtain DAWM segmentation.
  • Decline of both iron concentration and iron content within the thalamus of patients with multiple sclerosis over two years
    Fahad Salman1, Niels Bergsland1,2, Michael G Dwyer1,3, Bianca Weinstock-Guttman4, Robert Zivadinov1,3, and Ferdinand Schweser1,3
    1Buffalo Neuroimaging Analysis Center, Department of Neurology at the Jacobs School of Medicine and Biomedical Sciences, University at Buffalo, The State University of New York, Buffalo, NY, United States, 2IRCCS, Fondazione Don Carlo Gnocchi ONLUS, Milan, Italy, 3Center for Biomedical Imaging, Clinical and Translational Science Institute, University at Buffalo, The State University of New York, Buffalo, NY, United States, 4Jacobs Multiple Sclerosis Center, Department of Neurology, Jacobs School of Medicine and Biomedical Sciences, University at Buffalo, The State University of New York, Buffalo, NY, United States
    Over two years, both  susceptibility and iron content decline significantly in the pulvinar of patients with multiple sclerosis. 
    Table 1. Intra-thalamic magnetic susceptibility (ppm) in patients and controls.
    Table 2. Intra-thalamic iron content (mg) in patients and controls.
  • Diffusion Compartment Imaging Characterization of White Matter Microstructural Changes in Pediatric Onset Multiple Sclerosis
    Fedel Machado-Rivas1,2, Camilo Jaimes1,2, Benoit Scherrer1,2, Mark Gorman1,2, Simon K Warfield1,2, and Onur Afacan1,2
    1Radiology, Boston Children's Hospital, Boston, MA, United States, 2Radiology, Harvard Medical School, Boston, MA, United States
    In addition to finding differences in cAD, cRD, cMD and cFA, compartment diffusion model heterogeneity index was found to be significantly different in lesions. Our results support that a DIAMOND analysis can provide insights to MS lesion microstructure beyond conventional DTI metrics.
    Comparison of compartment Axial Diffusivity (cAD) (A), compartment Radial Diffusivity (cRD) (B), compartment Fractional Anisotropy (cFA) (C), ompartment Mean Diffusivity (cMD) (D), heterogeneity index (HEI) (E), and free water fraction (F) between MS lesions and Contralateral NAWM in patients. Significance levels for Mann-Whitney U tests are displayed as *P<0.05, **P≤0.01, ***P≤0.001.
    Lesion and contralateral normal appearing white matter (NAWM) segmentation in T2 weighted FLAIR acquisitions. Hyperintense white matter lesions (A) were manually segmented (B). A linear transform was used to mirror lesions in the contralateral side of the brain, and a white matter mask was used to refine segmentations (C,D).
  • MR Inversion Recovery Simulation and Scanning of Subjects with Focus on White Matter Lesion Contrast Optimization
    Øystein Bech Gadmar1, Anne-Hilde Farstad2, Berit Elstad2, Piotr Sowa2, and Wibeke Nordhøy1
    1Diagnostic Physics, Oslo University Hospital, Oslo, Norway, 2Radiology, Oslo University Hospital, Oslo, Norway
    By modelling T2 prepared double inversion MR, a "True-T2" DIR sequence was found and tested that removes the undesired T1 contrast in fluid attenuated imaging therefore improving the desired T2 contrast between lesions both in WM and GM. Comparison with traditional FLAIR imaging was favorable.
    Fluid attenuated IR images of a MS patient. Left/right: Sagittally acquired vs coronally reformatted images. Top panels: FLAIR. Bottom panels: True-T2 DIR of similar image planes. Multiple focal lesions are seen in the images, situated in deep WM as well as GM-associated.
    Simulated True-T2 DIR sequence with a T2 preparation phase. Figure elements as in fig. 1; in addition an information box showing the simulator settings is included in the left panel. In the right panel is shown an information box showing signal and contrast strength and efficiency, that is, relative SNR/CNR per unit of acquisition time. The percentages shown refer to the corresponding ones in fig. 1.
  • Prediction of multiple sclerosis clinical progression using whole brain adiabatic T1rho and Relaxation Along a Fictitious Field imaging
    Ivan Jambor1, Aida Steiner2, Marko Pesola3, Timo Liimatainen4, Marcus Sucksdorff3, Eero Rissanen 2, Laura Airas2, Hannu Aronen3, and Harri Merisaari3
    1Icahn School of Medicine at Mount Sinai, New York, NY, United States, 2Turku University Hospital, Turku, Finland, 3University of Turku, Turku, Finland, 4University of Oulu, Oulu, Finland
    Whole brain T1ρadiab and TRAFF2 at 3T was feasible with significant differences in T1ρadiab and TRAFF2 values between tissues time and correlation with disease severity.
    T2-weighted imaging (A, E), FLAIR (B, F), T1radiab (C, G) and TRAFF2 (D, H) imaging findings (white arrow) in a 47-year-old female with disease progression, EDSS score at baseline of 2.5 and 1-year follow up of 3.0, (A, B, C, D) and 46-year-old female with no change in her baseline EDSS score of 2.5 at 1-year follow up (E, F, G, H).
    Potential of adiabatic T1rho and Relaxation Along a Fictitious Field imaging (TRAFF2) for prediction of Expanded Disability Status Scale (EDSS) and Multiple Sclerosis Severity Score (MSSS), correcting for age of patients. The values are R2, with statistically significant correlations after Bonferroni correction over 12 evaluations marked as (raw p-value threshold): * 0.05 (p<4.17x10⁻³), ** 0.01 (p<8.33 x10⁻⁴) and *** 0.001 (p<8.33 x10⁻⁵). AUC = Area Under Receiver Operating Characteristic Curve; 95% CI = 95% Confidence Interval.
  • Relevance analysis of identifying multiple sclerosis patients based on diffusion imaging data using CNN
    Alina Lopatina1,2, Stefan Ropele3, Renat Sibgatulin1, Jürgen R Reichenbach1,2,4, and Daniel Güllmar1
    1Medical Physics Group / IDIR, Jena University Hospital, Jena, Germany, 2Michael-Stifel-Center for Data-Driven and Simulation Science, Jena, Germany, 3Department of Neurology, Medical University of Graz, Graz, Austria, 4Center of Medical Optics and Photonics Jena, Jena, Germany
    The classification procedure of identifying multiple sclerosis based on diffusion-weighted imaging by using convolutional neural networks was analyzed by generating relevance maps. The study showed that the central brain area and some of the lesion voxels are important for classification.
    Figure 3. Comparison of FLAIR-based lesion maps and ICVF-based relevance maps for three correctly classified MS patients (in rows). Red shows the brain areas with lesions in the lesion maps and positive relevant voxels in relevance maps.
    Figure 1. ICVF images and corresponding relevance maps overlaid on the corresponding ICVF images for two correctly classified HC and two correctly classified MS subjects. Red shows the positive relevance of the voxel information for correct classification and blue indicates voxels possessing a negative relevance.
Back to Top
Digital Poster Session - MS: Myelin & Lesion Characterization
Neuro
Wednesday, 19 May 2021 13:00 - 14:00
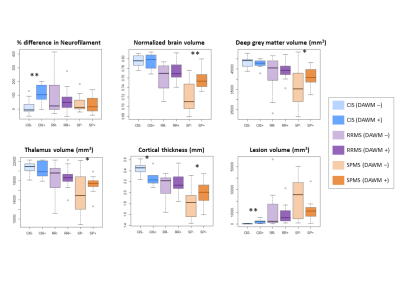
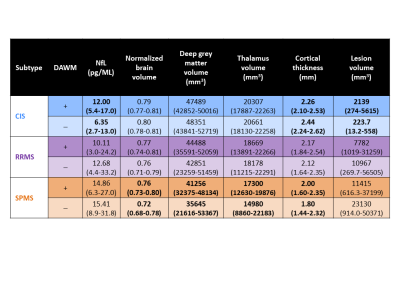
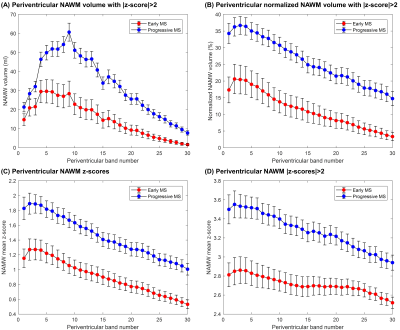
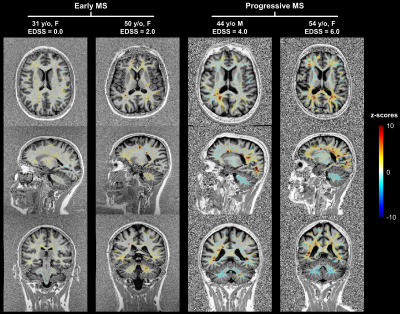
  • Paramagnetic Rim Lesions in MS are characterized by heterogeneous damage and inflammatory activity: a combined T1 relaxometry-diffusion study
    Muhamed Barakovic1,2,3, Riccardo Galbusera1,2,3, Reza Rahmanzadeh1,2,3, Matthias Weigel1,2,3, Po-Jui Lu1,2,3, Erik Bahn4, Simona Schiavi5, Alessandro Daducci5, Pascal Sati6,7, Pietro Maggi8,9, Ludwig Kappos2,3, Jens Kuhle2,3, Laura Gaetano10, Stefano Magon11, and Cristina Granziera1,2,3
    1Translational Imaging in Neurology (ThINk) Basel, University Hospital Basel and University of Basel, Basel, Switzerland, 2Neurologic Clinic and Policlinic, University Hospital Basel and University of Basel, Basel, Switzerland, 3Research Center for Clinical Neuroimmunology and Neuroscience (RC2NB) Basel, University Hospital Basel and University of Basel, Basel, Switzerland, 4Institute of Neuropathology, University Medical Center, Göttingen, Germany, 5Department of Computer Science, University of Verona, Verona, Italy, 6Translational Neuroradiology Section, National Institute of Neurological Disorders and Stroke, Bethesda, MD, United States, 7Department of Neurology, Cedars-Sinai Medical Center, Los Angeles, CA, United States, 8Department of Neurology, Lausanne University Hospital, Lausanne, Switzerland, 9Cliniques universitaires Saint Luc, Université catholique de Louvain, Louvain, Belgium, 10F. Hoffmann-La Roche Ltd., Basel, Switzerland, 11Pharmaceutical Research and Early Development, Roche Innovation Center Basel F. Hoffmann-La Roche Ltd., Basel, Switzerland
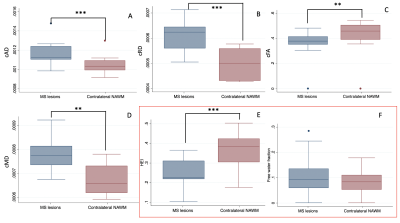
    Paramagnetic rim lesions (PRL) are characterized by heterogeneous damage in multiple sclerosis (MS) patients. In this study we acquired in vivo, postmortem and histopathology with the aim to further characterize the microstructural properties of these lesions.
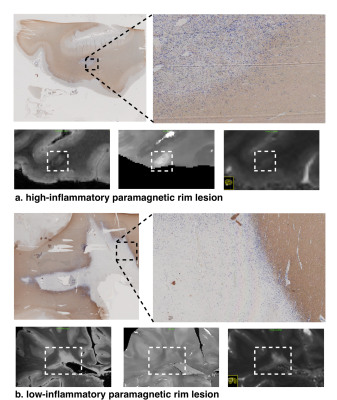
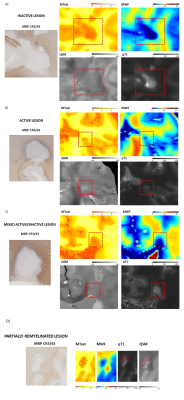
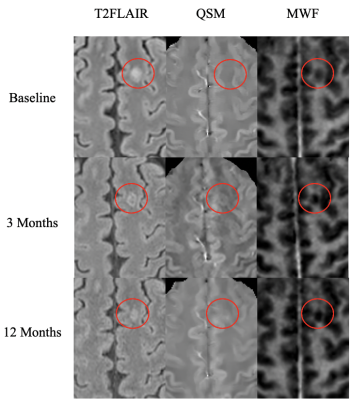
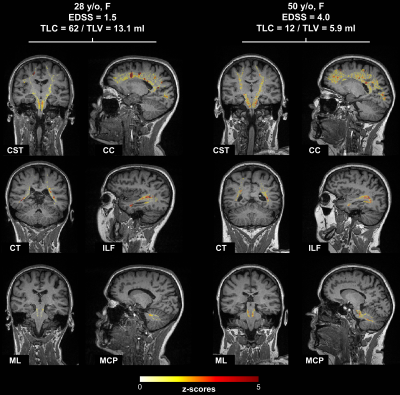
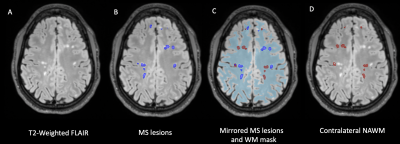
    Figure 1: Post mortem images showing an exemplary high-inflammatory PRL (a.) and a low-inflammatory PRL (b). (top) Double immunohistochemistry of myelin basic-protein (MBP) (brown) with CR3/43 (MHC II, (blue) in an exemplary highly inflamed PRL (box, a.) and low-inflammatory PRL (box, b.) On the bottom, 3D EPI, QSM derived from 3D EPI and qT1 derived from MP2RAGE.
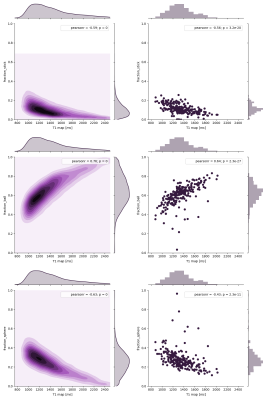
    Figure 2. Joint plot showing the relationship between qT1 and diffusion parameters estimated from multi-shell diffusion MRI. Left: Voxel-wise joint plot with kernel density estimate (KDE) Right: Lesion-wise plot showing the relationship between qT1 and diffusion parameters using a scatter plot. First row: stick fraction, representing the intra-cellular component. Second row: ball fraction, representing the extra-cellular unrestricted component. Third row: sphere fraction, representing the extra-cellular restricted component.
  • Deep Multiple Sclerosis Lesion Segmentation with Anatomical Convolution and Lesion-wise Loss
    Hang Zhang1, Jinwei Zhang1, Pascal Spincemaille1, Thanh D. Nguyen1, and Yi Wang1
    1Cornell University, New York, NY, United States
    We propose an anatomical convolutional module and lesion-wise sphere loss for improving MS lesion segmentation.
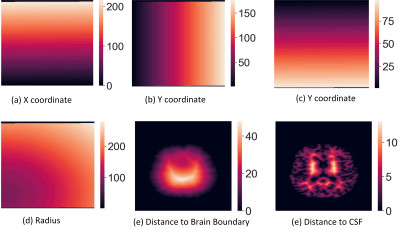
    Figure 1. Example Illustration of the proposed anatomical coordinates with one slice from the axial direction.
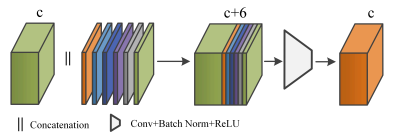
    Figure 2. The computed anatomical coordinates are concatenated with the incoming feature tensor through channel dimension, followed by standard convolution, batch normalization, and ReLU activation for feature fusion. c is the number of channels in the feature tensor.
  • Characterization of multiple sclerosis lesion types with texture analysis of advanced and conventional MRI
    Zahra Hosseinpour1, Olayinka Oladosu2, Mahshid Soleymani1, G Bruce Pike2, and Yunyan Zhang2
    1Biomedical Engineering program, Schulish School of Engineering, University of Calgary, Calgary, AB, Canada, 2Department of Radiology and Clinical Neurosciences, Hotchkiss Brain Institute, University of Calgary, Calgary, AB, Canada
    Texture analysis of MRI detected several tissue types in multiple sclerosis (MS). It identified de- and re-myelination in MS postmortem and differentiated the highly demyelinated and potentially remyelinated lesions in MS patients.
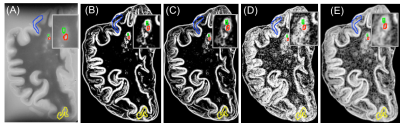
    Figure 1. Postmortem T2-MRI and calculated maps. The shown are T2 (A), T2-Contrast (B), T2-Dissimilarity (C), T2-Entropy (D): all from average GLCM, and T2-entropy filter (E). Different colors demonstrate different lesion types: red: WML, green: remyelinated WML, blue: type IV cortical lesion, yellow: type III cortical lesion.
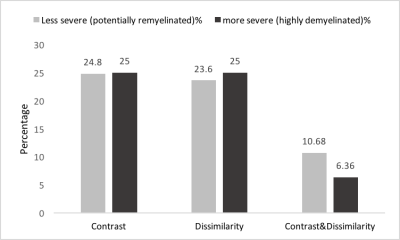
    Figure 4) In-vivo lesion severity. 25th percentile of contrast and both contrast and dissimilarity were used to detect the less severe (potentially remyelinated) lesions. And 75th percentile of the same parameters were applied to have more severe lesions (highly demyelinated and axonal damaged). We found that most of the patients have both types of lesions and the percentage of the less severe lesions is in the range of reported remyelination percentage in MS.
  • MRI reveals inflammation-mediated demyelination in a cuprizone toxin model of multiple sclerosis
    Stephen T. Vito1, Kai H. Barck2, Rohan S. Virgincar2, Amy Easton1, Robby M. Weimer2, Tracy J. Yuen1, and Luke Xie2
    1Neuroscience, Genentech, South San Francisco, CA, United States, 2Biomedical Imaging, Genentech, South San Francisco, CA, United States
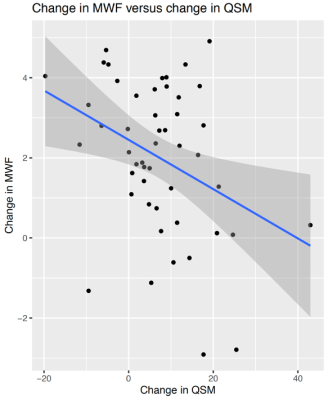
    MRI detected inflammation-mediated demyelination in the cuprizone model. Voxel-based analysis revealed significant lesions in the medial splenium, lateral genu, and cerebellar nuclei. T2 reflected inflammation (microglia and astrocytes) while MWF and gRatio suggested demyelination.
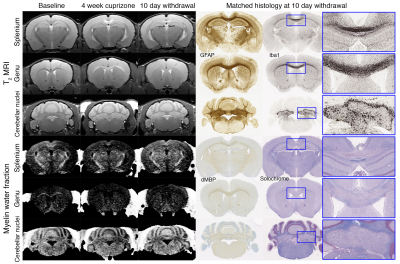
    Fig. 1. Longitudinal MRI of brain lesions at baseline, 4-week cuprizone, and 10-day withdrawal (n=12). Lesions are observed in the splenium, genu, and cerebellar nuclei in T2-weighted and myelin water fraction images. Example histology of the same animals are shown. Inserts show lesion areas at 5× magnification. GFAP~astrocytes, Iba1~microglia, dMBP~denatured myelin basic protein, and solochrome~myelin.
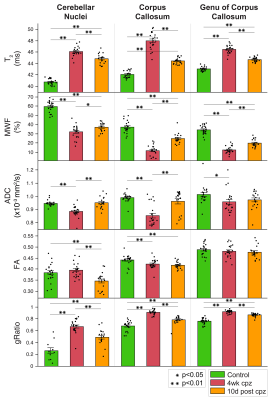
    Fig. 2. Bar plots for longitudinal MRI. Error bars show standard error about the mean. Sample size: n=12 at baseline, 4-week cuprizone, and 10-day withdrawal. MWF=myelin water fraction, ADC=apparent diffusion coefficient, and FA=fractional anisotropy. One-way ANOVA and post-hoc t-tests were performed between baseline control, 4-week cuprizone, and 10-day withdrawal groups (*p<0.05, **p<0.01).
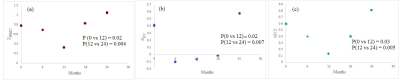
  • Longitudinal automated assessment of paramagnetic rim lesions in multiple sclerosis using RimNet
    Maxence Wynen1, Francesco La Rosa2,3,4, Amina Sellimi5, Germán Barquero2,3,4, Gaetano Perrotta6, Valentina Lolli7, Vincent Van Pesch5, Cristina Granziera8,9, Tobias Kober10, Pascal Sati11,12, Benoît Macq13, Daniel S. Reich11, Martina Absinta11,14, Meritxell Bach Cuadra2,3,4, and Pietro Maggi5,15
    1Ecole Polytechnique de Louvain, Université Catholique de Louvain, Louvain-la-Neuve, Belgium, 2Signal Processing Laboratory (LTS5), École Polytechnique Fédérale de Lausanne, Lausanne, Switzerland, 3Medical Image Analysis Laboratory, Center for Biomedical Imaging (CIBM), University of Lausanne, Lausanne, Switzerland, 4Radiology Department, Lausanne University Hospital and University of Lausanne, Lausanne, Switzerland, 5Department of Neurology, Cliniques Universitaires Saint-Luc, Université Catholique de Louvain, Brussels, Belgium, 6Department of Neurology, Erasme University Hospital, Université Libre de Bruxelles, Brussels, Belgium, 7Department of Radiology, Erasme University Hospital, Université Libre de Bruxelles, Brussels, Belgium, 8Neurologic Clinic and Policlinic, Departments of Medicine, Clinical Research and Biomedical Engineering, University Hospital Basel and University of Basel, Basel, Switzerland, 9Translational Imaging in Neurology (ThINk) Basel, Department of Medicine and Biomedical Engineering, University Hospital Basel and University of Basel, Basel, Switzerland, 10Advanced Clinical Imaging Technology, Siemens Healthcare AG, Lausanne, Switzerland, 11Translational Neuroradiology Section, National Institute of Neurological Disorders and Stroke, National Institutes of Health, Bethesda, MD, United States, 12Department of Neurology, Cedars-Sinai Medical Center, Los Angeles, CA, United States, 13ICTEAM Institute, Université catholique de Louvain, Louvain-la-Neuve, Belgium, 14Department of Neurology, Johns Hopkins University, Baltimore, MD, United States, 15Department of Neurology, Lausanne University Hospital and University of Lausanne, Lausanne, Switzerland
    RimNet, a deep-learning-based segmentation algorithm for chronic active multiple sclerosis lesions, is effective for unseen MRI data acquired on a scanner from a different vendor, and makes consistent predictions on longitudinal data.
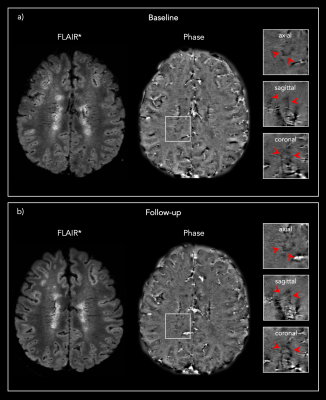
    Figure 1: Representative 3D FLAIR* and Phase images from one PMS patient showing the same PRL a) at baseline and b) at the 13 months post-DMT follow-up.
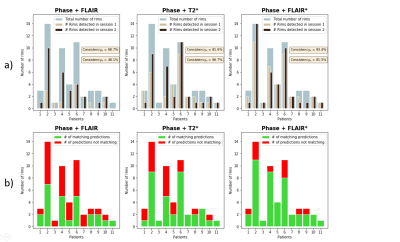
    Figure 3: Summary of the lesion-wise results for each patient with paramagnetic rim lesions (n=11 of 13 total patients studied, 85%). a) Number of rims detected in session 1 (baseline) and session 2 (follow-up) for each patient, overlaid on the total number of rims adjudicated in the consensus manual reading. b) Number of matching predictions between baseline and follow-up. Abbreviations: Consistencyp, probability-based consistency; Consistencyb, binary-based consistency.
  • Accelerating Quantification of Myelin Water Fraction with Nonlocal Low-Rank Tensor in the Feature Domain
    Quan Chen1, Huajun She1, and Yiping P. Du1
    1School of Biomedical Engineering, Shanghai Jiao Tong University, Shanghai, China
    A Feature domain nonlocal Low-Rank Tensor based (FnLRT) algorithm is proposed to accelerate the quantification of myelin water content. The FnLRT algorithm provides the potential to obtain the whole brain MWF mapping in 1 minute.
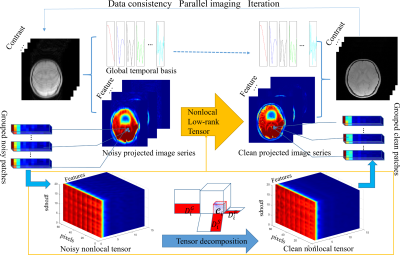
    Figure 1. The flowchart of the FnLRT algorithm. The artifacts in the features are substantially reduced.
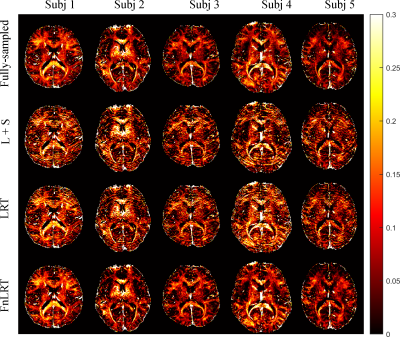
    Figure 3. The MWF maps of 5 representative subjects obtained from the L+S, LRT and FnLRT reconstructions (R = 6).
  • Beyond the Mean: Myelin Heterogeneity Index as a Sensitive Metric for Assessing Myelin Damage in Multiple Sclerosis
    Poljanka Johnson1, Irene M Vavasour2, Shawna Abel1, Lisa E Lee3, Stephen Ristow1, Cornelia Laule4, Roger Tam2, David K.B. Li2, Nathalie Ackermans1, Alice Schabas1, Jillian Chan1, Helen Cross1, Ana-Luiza Sayao1, Virginia Devonshire1, Robert Carruthers1, Anthony Traboulsee3, and Shannon Kolind5
    1Medicine, University of British Columbia, Vancouver, BC, Canada, 2Radiology, University of British Columbia, Vancouver, BC, Canada, 3University of British Columbia, Vancouver, BC, Canada, 4Radiology, Physics and Astronomy, Pathology, University of British Columbia, Vancouver, BC, Canada, 5Medicine, Physics & Astronomy, University of British Columbia, Vancouver, BC, Canada
    This study investigates a potential myelin related metric for discriminating between MS subtypes. This study also demonstrates that normal appearing white matter in MS shows increased myelin damage in individuals with worse disability.
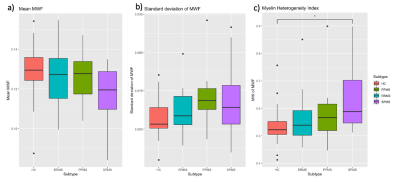
    The myelin water fraction (MWF) a) mean, b) standard deviation, and c) coefficient of variation (or myelin heterogeneity index, MHI) of the normal appearing white matter in healthy controls (HC), relapsing remitting MS (RRMS), primary progressive MS (PPMS), and secondary progressive MS (SPMS). A one-way ANOVA test with Tukey correction showed that the MHI of SPMS was higher than HC (p=0.01) and trended towards higher than RRMS (p=0.065).
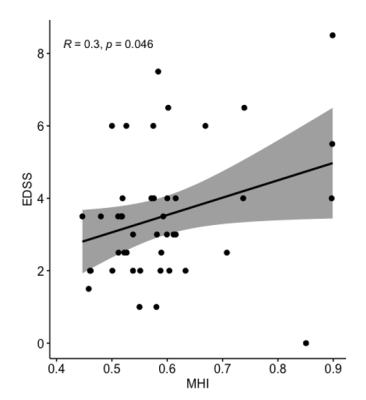
    The myelin heterogeneity index (MHI = MWF standard deviation/MWF mean) of all MS patients was correlated with Expanded Disability Status Scale (EDSS) (p = 0.046, R = 0.3) using a Pearson correlation. Shaded area is 95% confidence interval.
  • Application of an exponential recovery model to multiparametric 3D MRI to characterize the evolution of active lesions in Multiple Sclerosis
    Lucas Soustelle1,2, Andreea Hertanu1,2, Arnaud Le Troter1,2, Soraya Gherib1,2, Samira Mchinda1,2, Patrick Viout1,2, Lauriane Pini1,2, Claire Costes1,2, Sylviane Confort-Gouny1,2, Adil Maarouf1,2,3, Bertrand Audoin1,2,3, Audrey Rico1,2,3, Clémence Boutière1,2,3, Maxime Guye1,2, Jean-Philippe Ranjeva1,2, Gopal Varma4, David C. Alsop4, Jean Pelletier1,2,3, Olivier M. Girard1,2, and Guillaume Duhamel1,2
    1Aix Marseille Univ, CNRS, CRMBM, Marseille, France, 2APHM, Hôpital Universitaire Timone, CEMEREM, Marseille, France, 3APHM, Hôpital Universitaire Timone, Service de neurologie, Marseille, France, 4Division of MR Research, Radiology, Beth Israel Deaconess Medical Center, Harvard Medical School, Boston, MA, United States
    Active MS lesions were evaluated over a 12-month follow-up study by modelling the signal evolution of ihMT, conventional MT, DTI and T1w data. Results show that MR metrics in lesions recover at different rates, emphasizing different sensitivity to MS physiopathology mechanisms.
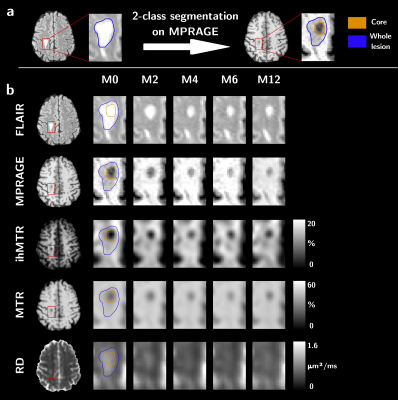
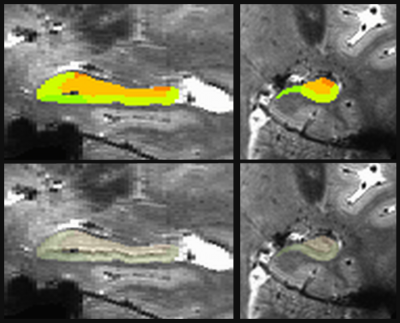
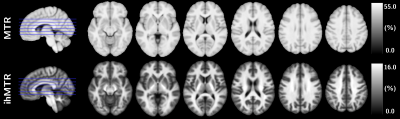
    Figure 1: Sketch of the sub-segmentation processing of the lesion into core and edge regions based on the T1w contrast and from the manually drawn mask on the FLAIR image (a), and illustrative depiction of the evolution of MR contrasts over time in an active lesion (b).
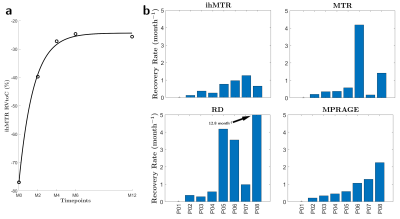
    Figure 3: Example of an RVtoC curve adjustment over an ihMTR lesion in the core region (a), and boxplots of the average recovery rates per patients of ihMTR, MTR, RD and MPRAGE (b). Note that patient P01 was not included as the dynamic of its two lesions could not be resolved by the fitting model for both ihMTR and RD (ρ²<0.75).
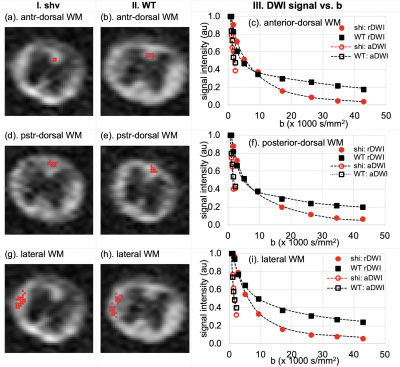
  • High-b Diffusivity of MS Lesion in Cervical Spinal Cord using Ultrahigh-b DWI (UHb-DWI)
    Kyle Jeong1, Lubdha Shah2, You-Jung Lee1, Bijaya Thapa1, Nabraj Sapkota1, Erica Bisson3, Noel Carlson4, Eun-Kee Jeong2, and John Rose5
    1Utah Center for Advanced Imaging Research, University of Utah, Salt Lake City, UT, United States, 2Radiology and Imaging Sciences, University of Utah, Salt Lake City, UT, United States, 3Neurosurgery, University of Utah, Salt Lake City, UT, United States, 4GRECC, Veterans Affairs, Salt Lake City, UT, United States, 5Neuroimmunology and Neurovirology Division, University of Utah, Salt Lake City, UT, United States
    The main objective of this study was to present UHb-rDWI as a potential powerful tool in quantitatively characterizing MS CSC. We investigate UHb-rDWI signal in white matter tracts of the CSC and compare quantitative values between healthy control WM with both MS NAWM and WM lesions. 
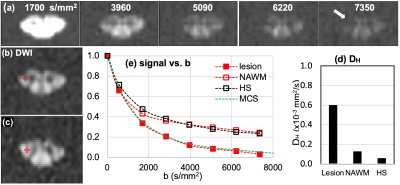
    Fig. 1. MS1: (a) DWIs of b = 1700 ~ 7350 s/mm2 of the lesion slice and (b) ROIs at lesion and NAWM slice, 1.5 cm above the lesion toward the brain, and (c) signal-b curves of the recently-active lesion (red square) and NAWM (red circle), and averaged data (hollow square) at the corticospinal tract of seven healthy subjects, and (d) mean values of high-b diffusion coefficient DH at the lesion, NAWM, and the healthy CSCs at the corticospinal tract. Green dotted line in (b) indicates the MCS data with 30 % demyelination in lesion.
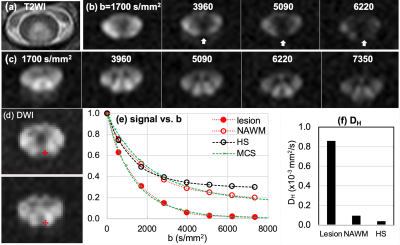
    Fig. 2. MS2: (a) T2WI, (b, c) DWIs of b = 1700 ~ 7350 s/mm2 of the lesion slice and NAWM slice, 1.5 cm below the lesion away from the brain, (d) ROIs on lesion (top) and NAWM (bottom), (e) signal-b curves of the recently-active lesion, NAWM, and averaged data at the posterior column of 7 HS, and (f) mean values of high-b diffusion coefficient DH at the lesion, NAWM, and the healthy CSCs at the corticospinal tract. White vertical arrows in (a) indicate lesion with rapidly decaying signal. Green dotted lines in (e) indicate the MCS data with 40 % and 15 % demyelination in lesion and NAWM, respectively.
  • Brain Ultrashort T2 Component imaging using a STAIR Prepared Dual-Echo UTE Sequence with Complex Echo Subtraction
    Ya-Jun Ma1, Hyungseok Jang1, Zhao Wei1, Mei Wu1, Saeed Jerban1, Eric Y Chang1,2, Jody Corey-Bloom1, Graeme M Bydder1, and Jiang Du1
    1UC San Diego, San Diego, CA, United States, 2VA Health system, San Diego, CA, United States
    UltraShort T2 Proton Fraction (USPF) reduction in multiple sclerosis (MS) lesions suggests that the proposed STAIR-dUTE-ES technique has potential for evaluation of demyelination and remyelination in the diagnosis and treatment of patients with MS.
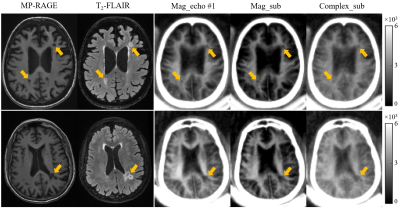
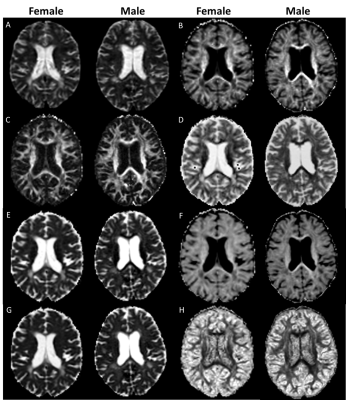
    Figure 3 Selective clinical MP-RAGE (first column), T2-FLAIR (second column) and STAIR-dUTE (last three columns) images of two representative patients with MS (first row: a 49-year-old female; second row: a 69-year-old female). MS lesions appeared hypointense on the MP-RAGE image and hyperintense on the T2-FLAIR image as indicated by the yellow arrows. These lesions also show signal loss on the magnitude images in the first echo images (third column), magnitude echo subtracted images (fourth column) and complex echo subtracted images (last column) using the STAIR-dUTE sequence.
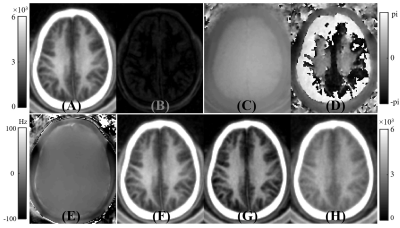
    Figure 2 A volunteer study showing the generation of ultrashort T2 signals with the methods used in this study. The first row shows magnitude images for the first echo (A) and the second echo (B), as well as the corresponding phase images for the first echo (C) and second echo (D). Panel E shows the ΔB0 field map used for the complex ES. Magnitude of the first echo (F), magnitude echo subtracted (G), and complex echo subtracted (H) images obtained with the STAIR-dUTE sequence are shown. The magnitude of the first echo image (A) is displayed again in (F) for closer comparison with (G) and (H).
  • Myelin Water Imaging Demonstrates Myelin Loss in Multiple Sclerosis Normal Appearing White Matter over Two Years
    Irene Margaret Vavasour1, Poljanka Johnson2, Shawna Abel3, Stephen Ristow3, Jared Splinter3, Cornelia Laule1,4,5,6, Roger Tam1, David KB Li1, Nathalie Ackermans3, Alice J Schabas3, Jillian Chan3, Helen Cross3, Ana-Luiza Sayao3, Virginia Devonshire3, Robert Carruthers3, Anthony Traboulsee3, and Shannon H Kolind1,3,4,6
    1Radiology, University of British Columbia, Vancouver, BC, Canada, 2Neuroscience, University of British Columbia, Vancouver, BC, Canada, 3Medicine, University of British Columbia, Vancouver, BC, Canada, 4Physics and Astronomy, University of British Columbia, Vancouver, BC, Canada, 5Pathology and Laboratory Medicine, University of British Columbia, Vancouver, BC, Canada, 6International Collaboration on Repair Discoveries (ICORD), University of British Columbia, Vancouver, BC, Canada
    Using multi-echo T2 relaxation, a decrease in mean myelin water fraction over two years was detected in the normal appearing white matter of relapsing-remitting and progressive multiple sclerosis participants.
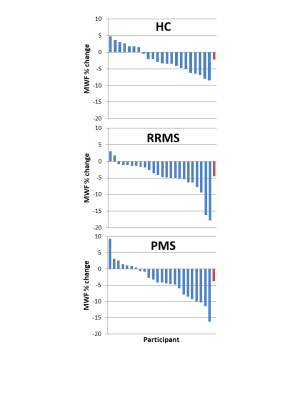
    Figure 4: Percentage change over 2 years in mean myelin water fraction (MWF) for each participant divided into participant subtype (healthy control (HC), relapsing remitting multiple sclerosis (RRMS), progressive multiple sclerosis (PMS)). The last bar (in red) is the mean over the participants.
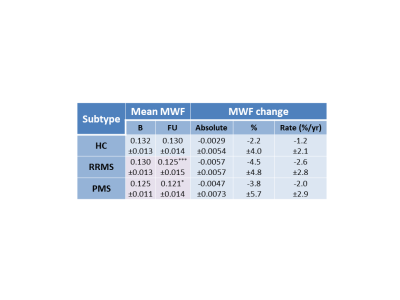
    Figure 2: Mean myelin water fraction (±standard deviation) at baseline (B) and follow-up (FU), absolute change in MWF over 2 years, percent MWF change over 2 years (%) and annual rate of MWF percent change divided into participant subtype (healthy control (HC), relapsing remitting multiple sclerosis (RRMS), progressive multiple sclerosis (PMS)). Volumes are taken at baseline. Significant differences between baseline and follow-up are denoted in pink with *p<0.01, ***p<0.0001.
  • Sub-second Accurate Myelin Water Fraction Reconstruction with UNET
    Jeremy Kim1,2, Thanh Nguyen2, Jinwei Zhang2, and Yi Wang2
    1Stanford University, New York, NY, United States, 2Weill Cornell, New York, NY, United States
    We developed UNET neural network for sub-second, accurate, and reproducible extraction of myelin water fraction map from FAST-T2 multi-echo T2 decay data.
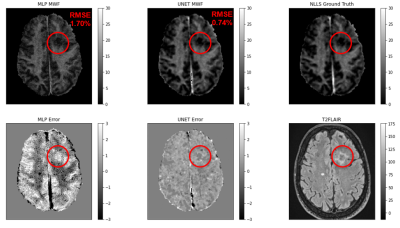
    Figure 1: Representative case showing the UNET’s prediction against the ANN’s prediction
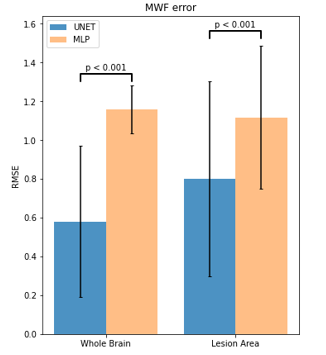
    Figure 2: RMSE for UNET and ANN Predictions
  • Quantitative multi-modal MRI shows correlations between lesion iron deposition and neuro-axonal density in progressive multiple sclerosis
    Sara Collorone1, Marco Battiston1, Ferran Prados 1,2,3, Alberto Calvi1, Baris Kanber4, Francesco Grussu1,5, Marios Yiannakas1, Carmen Tur1,6, Rebecca Samson1, Olga Ciccarelli1,7, and Claudia A.M. Gandini Wheeler-Kingshott1,8,9
    1NMR Research Unit, Queen Square MS Centre, Department of Neuroinflammation, UCL Queen Square Institute of Neurology, Faculty of Brain Sciences, University College London (UCL), London, United Kingdom, 2Centre for Medical Image Computing (CMIC), Department of Medical Physics and Biomedical Engineering, University College London (UCL), London, United Kingdom, 3Universitat Oberta de Catalunya, Barcelona, Spain, 4Centre for Medical Image Computing (CMIC), Department of Medical Physics and Biomedical Engineering, University College London(UCL), London, United Kingdom, 5Radiomics Group, Vall d’Hebron Institute of Oncology, Vall d’Hebron Barcelona Hospital Campus, Barcelona, Spain, 6Multiple Sclerosis Centre of Catalonia (Cemcat), Vall d’Hebron Institute of Research, Vall d’Hebron Barcelona Hospital Campus, Barcelona, Spain, 7University College London Hospitals, Biomedical Research Centre, National Institute for Health Research, London, United Kingdom, 8Department of Brain & Behavioural Sciences, University of Pavia, Pavia, Italy, 9Brain Connectivity Center Research Department, IRCCS Mondino Foundation, Pavia, Italy
    In progressive multiple sclerosis, iron deposition in the lesions correlates with axonal loss in the lesions and cortical grey matter. Both iron deposition and axonal loss in lesions correlate with cognitive disability.
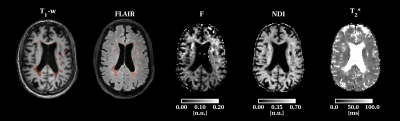
    Figure 4: Example of T1 and 3DFLAIR images, F, NDI and T2* maps in a patient. F and NDI are low in the white matter lesions while T2* values are increased.
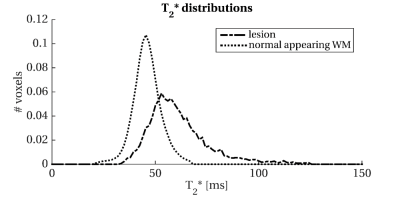
    Figure 5: Histogram of T2* distribution in the normal-appearing white matter and white matter lesions. Abbreviations: WM: white matter
  • A Comparison of Brain Iron Accumulation Patterns Between Subtypes of Multiple Sclerosis
    Aly Khalifa1 and Michael D Noseworthy2,3
    1Department of Medical Biophysics, University of Toronto, Toronto, ON, Canada, 2Electrical and Computer Engineering, McMaster University, Hamilton, ON, Canada, 3School of Biomedical Engineering, McMaster University, Hamilton, ON, Canada
    Susceptibility weighted imaging (SWI) was used to correlate brain regional iron levels with disease severity in the four subtypes of multiple sclerosis (MS).
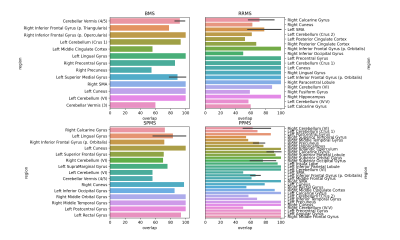
    Figure 3. The mean percent overlap of clusters with anatomical regions labeled in the N27 Atlas, by MS subtype. The percent overlap is defined as the number of voxels within a cluster that overlap with an anatomical region, divided by the total number of number of voxels in the cluster. Error bars represent the 95% confidence interval, calculated only for regions with more than one cluster.
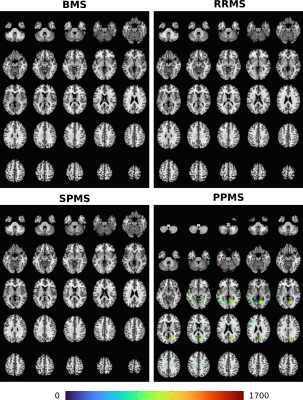
    Figure 2. Montages of clusters identified by thresholding the mean difference in SWI intensity between each MS cohort (BMS, RRMS, SPMS, PPMS) and the control group. The clusters are overlain on to the N27 atlas. The colourmap corresponds to the square root of the mean sum of squares due to treatment effect. A significance threshold of p=0.001 was used.
  • MS-Voter: Learning Where to Vote for Confluent Multiple Sclerosis Lesion Separation
    Hang Zhang1, Jinwei Zhang1, Junghun Cho1, Susan A. Gauthier1, Pascal Spincemaille1, Thanh D. Nguyen1, and Yi Wang1
    1Cornell University, New York, NY, United States
    A machine learning technique is described for separating confluent lesions in multiple sclerosis using Hough voting and K-means clustering.
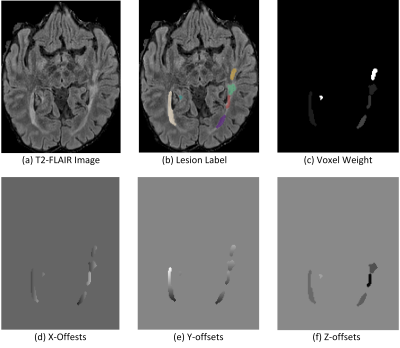
    Figure 1. Example Illustration of how to compute lesion offsets and voxel weight based on ground-truth lesion labels. Individual lesions are marked by masks of different colors.
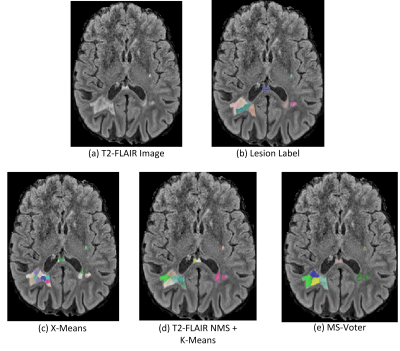
    Figure 2. Qualitative comparison between baseline methods and our proposed MS-Voter.
  • Increasing age is independently associated with higher free water in non-active MS brain - A multi-compartment analysis using FAST-T2
    Liangdong Zhou1, Yi Li1, Xiuyuan Hugh Wang1, Elizabeth Sweeney1, Hang Zhang1,2, Emily B Tanzi1, Jennette Prince2, Victor Antonio Su-Ortiz2, Susan A Gauthier1, and Thanh D Nguyen1
    1Radiology, Weill Cornell Medicine, New York, NY, United States, 2Cornell University, Ithaca, NY, United States
    Multi-echo T2 relaxometry-based water compartment model can be used to quantify CSF water fraction (CSFF). It turns out that the CSFF increases with age in the cortical gray matter from a cohort of non-active MS subjects. CSFF could be a potential biomarker of perivascular space.
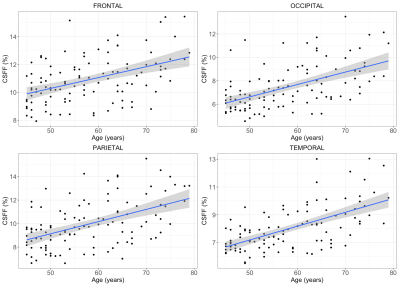
    Figure 3 CSFF with age in four cortical lobes. It clearly shows that the CSFF increases with age in all cortical lobes (Frontal: p=0.019, occipital: p<0.01, Parietal: p<0.01, temporal: p<0.01, all p-values are FDR adjusted).
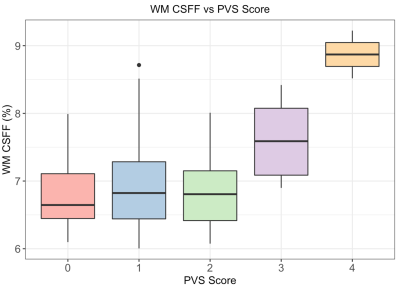
    Figure 2. WM CSFF and PVS score relation. PVS score was evaluated on the T2w image at the semiovale slice and the WM CSFF was measured at the WM region of the same slice. It shows CSFF increases as the PVS score increases.
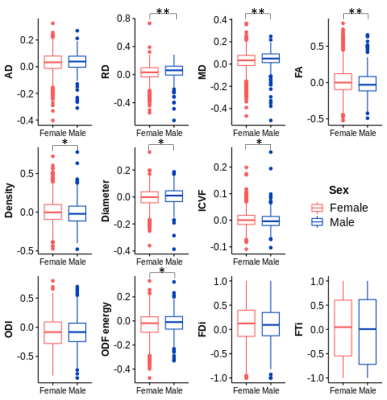
  • Impact of the Acquisition Protocol on the Sensitivity to Demyelination and Axonal Loss of DKI and NODDI: A Simulation Study
    Stefania Oliviero1 and Cosimo Del Gratta1
    1Department of Neuroscience, Imaging, and Clinical Sciences, University of Chieti Pescara G. D'Annunzio, Chieti, Italy
    DKI metrics significantly changed with axonal loss but not with demyelination, while NODDI metrics showed sensitivity to both damage processes. In any case, the sequence strongly affected the sensitivity and, especially for NODDI, the metric means.
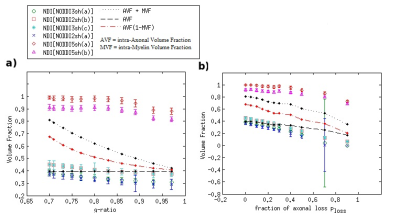
    Fig 2 Results for the Neurite Density Index NDI (i.e. the NODDI-derived intra-cellular fractional volume), using 6 different acquisition protocols. In a and b, NDI mean values and standard deviations obtained in different conditions of demyelination and axonal loss, respectively, considering a Rician noise with SNR=20 affects the synthetic DW signal. For reference, some specific combinations of the true intra-axonal volume fraction AVF and true intra-myelin volume fraction MVF are also shown.
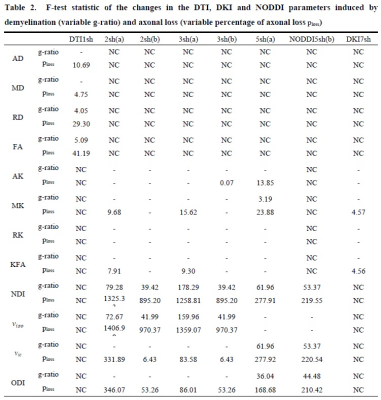
    Metrics AD, MD, RD, and FA are DTI-derived; AK, MK, RK, and KFA are DKI-derived, while neurite density index NDI, fractional volume of the isotropic compartment νiso, fractional volume νic of the intra-cellular space, and orientation dispersion index ODI are NODDI-derived. Omitted results (-) refer to parameters showing non-significant changes between healthy and damaged condition (one-way ANOVA with p<0.01). NC means Not Calculated, since not all the sequences were used for all the DWI analyses.
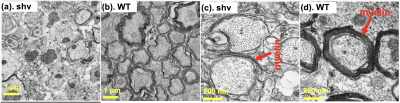
  • Mapping myelin content in ex-vivo MS brain tissue using short-T2 MRI of the lipid-protein bilayer
    Emily Louise Baadsvik1, Markus Weiger1, Romain Froidevaux1, Wolfgang Faigle2, Benjamin Victor Ineichen2, and Klaas Paul Pruessmann1
    1ETH Zurich and University of Zurich, Zurich, Switzerland, 2University Hospital Zurich and University of Zurich, Zurich, Switzerland
    D2O-exchanged multiple sclerosis brain tissue was imaged with short-T2 MRI techniques, yielding contrast that is closely correlated with corresponding myelin-stained cryosections for white matter, grey matter and multiple sclerosis lesions.

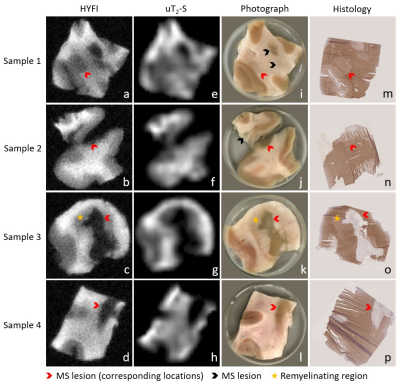
    Figure 3: Image series showing the correlation between MRI results, photographs and histology for all samples. a-d) High-resolution HYFI images, e-h) amplitude maps of the uT2-S fit component, i-l) sample photographs, m-p) corresponding 10 µm cryosections with myelin staining using immunohistochemistry for MOG (brown) and haematoxylin counterstaining (purple). Note that sample 2 contains two tissue pieces (originally connected), but histology was only performed on the larger one.

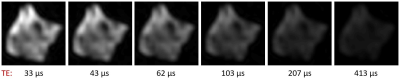
    Figure 1: Time evolution of signal intensity in SPI images of human MS brain tissue after D2O exchange. Six of the fourteen images acquired for the SPI series of sample 1 are shown. The signal intensity drops as TE increases, and has all but vanished after 413 μs – a clear indication that the captured signal stems from tissues with T2 times of around a hundred microseconds at most.

  • Myelin imaging derived quantitative parameter mapping compared to myelin water fraction
    Yuki Kanazawa1, Masafumi Harada1, Yo Taniguchi2, Syun Kitano3, Nagomi Fukuda3, Yuki Matsumoto1, Hiroaki Hayashi4, Kosuke Ito2, Yoshitaka Bito2, and Akihiro Haga1
    1Graduate School of Biomedical Sciences, Tokushima University, Tokushima, Japan, 2Healthcare Business Unit, Hitachi, Ltd., Tokyo, Japan, 3Faculty of Medicine, Tokushima University, Tokushima, Japan, 4Faculty of Health Sciences, Institute of Medical, Pharmaceutical and Health Sciences, Kanazawa University, Kanazawa, Japan
    Myelin map derived from QPM can be applied for the quantitative assessment of white matter structure as substitute for MWF.
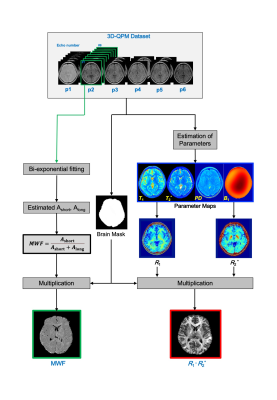
    Fig.1 A schematic diagram of the QPM-myelin mapping (R1·R2*) and MWF images procedures.
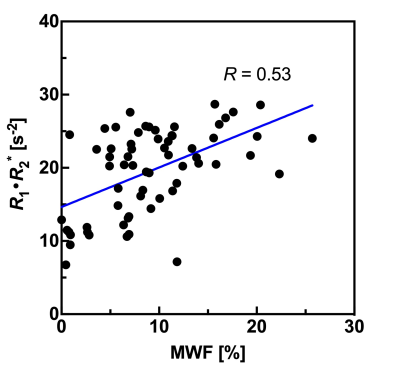
    Fig. 5 Plots the relationship between MWF values and R1·R2* product values derived from QPM across all four bilateral structures.
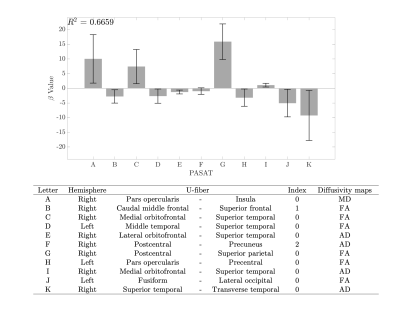
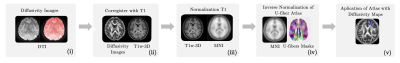
  • Association of estimated time from the onset of multiple sclerosis plaques with myelin and axon-related quantitative MRI measurement
    Tomoko Maekawa1,2, Akifumi Hagiwara1,3, Masaaki Hori1,4, Christina Andica1, Shohei Fujita1,5, Toshiaki Akashi1, Koji Kamagata1, Akihiko Wada1, and Shigeki Aoki1
    1Department of Radiology, Juntendo University School of Medicine, Tokyo, Japan, 2Division of Regenerative Medicine, The Jikei University School of Medicine, Tokyo, Japan, 3Department of Radiological Science, David Geffen School of Medicine, University of California Los Angeles, Los Angeles, CA, United States, 4Department of Diagnostic Radiology, Toho University Omori Medical Center, Tokyo, Japan, 5Department of Radiology, Graduate School of Medicine, The University of Tokyo, Tokyo, Japan
    We investigated the association between estimated time from the onset of multiple sclerosis plaques and myelin- and axon-related quantitative MRI measurements. Multiple sclerosis plaques with longer estimated time from the onset had significantly lower myelin volume fraction.
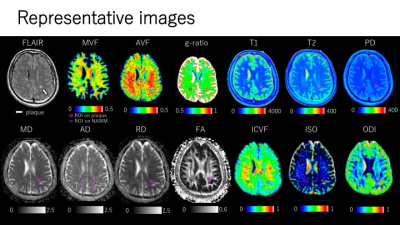
    Figure 3. Representative quantitative maps of an MS patient. Plaques were defined as a white matter area of more than 5 mm in diameter, with abnormally high intensity on synthetic FLAIR images. Each plaque was manually segmented. All the ROIs placed on synthetic FLAIR images were copied and pasted onto the quantitative maps.
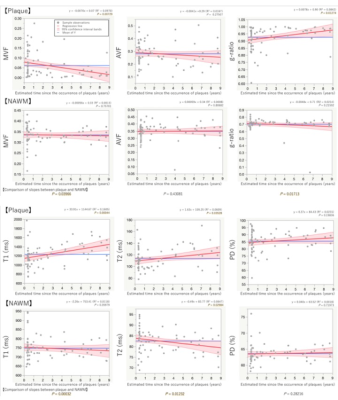
    Figure 4. Simple linear regressions to assess the association between estimated time from the onset of plaques and quantitative MRI metrics. Plaque MVF and g-ratio in relation to the estimated time from the onset were significantly fitted to linear lines with negative and positive slopes, respectively. Plaque T1 and T2 in relation to the estimated time from the onset were significantly fitted to linear lines with positive slopes. NAWM T2 in relation to the estimated time from the onset was significantly fitted to a linear lineswith a negative slope.