-
Dynamic MR imaging of muscle contraction during electrical stimulation in facioscapulohumeral muscular dystrophy: a longitudinal study
Xeni Deligianni1,2, Francesco Santini1,2, Matteo Paoletti3, Francesca Solazzo3, Niels Bergsland4,5, Giovanni Savini3, Arianna Faggioli3, Giancarlo Germani3, Mauro Monforte6, Giorgio Tasca6, Enzo Ricci6, and Anna Pichiecchio3,7
1Department of Radiology/ Division of Radiological Physics, University Hospital of Basel, Basel, Switzerland, 2Biomedical Engineering, University of Basel, Allschwil, Switzerland, 3Advanced Imaging and Radiomics Center, Neuroradiology Department, IRCCS Mondino Foundation, Pavia, Italy, 4Buffalo Neuroimaging Analysis Center, Department of Neurology, Buffalo Neuroimaging Analysis Center, Department of Neurology, Jacobs School of Medicine and Biomedical Sciences, Buffalo, NY, United States, 5IRCCS, Fondazione Don Carlo Gnocchi ONLUS, Milan, Italy, 6Unità Operativa Complessa di Neurologia, Fondazione Policlinico Universitario A. Gemelli IRCCS, Rome, Italy, 7Department of Brain and Behavioral Sciences, University of Pavia, Pavia, Italy
After applying MRI of muscle contraction during electrical stimulation on the quadriceps muscles longitudinally in FSHD patients and in healthy controls, differences were observed in maximum values and rates of the strain.
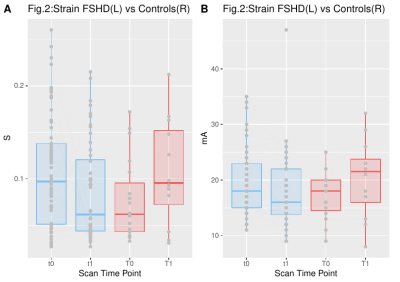
Figure 2. Maximum strain values for FSHD patients (blue-left) and healthy controls (red-right) for 2 different time points.
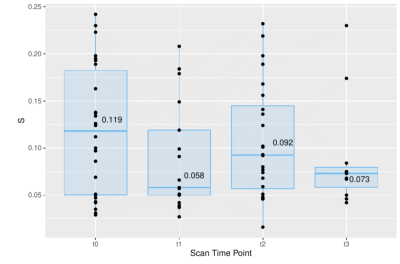
Figure 3. Maximum strain values for FHSD patients that were scanned at least three times. At time points 1-4, the principal strain value was respectively t0 (mean=0.119), t1(median=0.058), t2(median=0.092), t3(median=0.073).
-
Effect of Eddy Current Correction on Muscle Diffusion Measurements
Xingyu Zhou1,2, Melissa T. Hooijmans1,3, Crystal L. Coolbaugh1, Mark K. George1, and Bruce M. Damon1,2,4,5
1Vanderbilt University Institute of Imaging Science, Nashville, TN, United States, 2Department of Biomedical Engineering, Vanderbilt University, Nashville, TN, United States, 3Department of Radiology & Nuclear Medicine, Amsterdam Movement Sciences, Amsterdam University Medical Center, Amsterdam, Netherlands, 4Department of Radiology & Radiological Sciences, Vanderbilt University Medical Center, Nashville, TN, United States, 5Department of Molecular Physiology & Biophysics, Vanderbilt University Medical Center, Nashville, TN, United States
We compared muscle diffusion tensor imaging with and without
eddy current correction in the pre-processing pipeline. Eddy current correction
improved the alignment of diffusion-weighted and anatomical images, but did not
significantly affect the indices derived from the diffusion tensor.
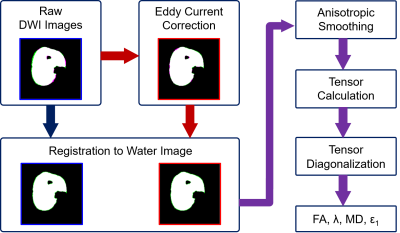
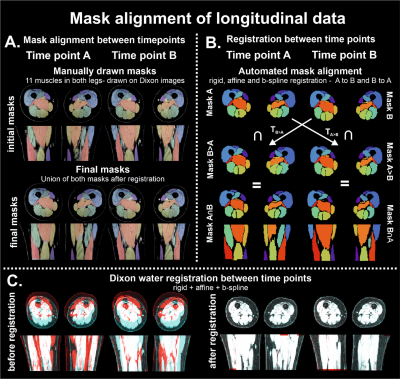
Figure 1. General workflow of data analysis. Mask difference between
diffusion-weighted images and water images are shown. Eddy current improves the
morphological match between diffusion-weighted and water images.
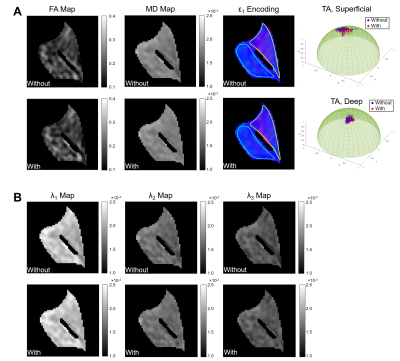
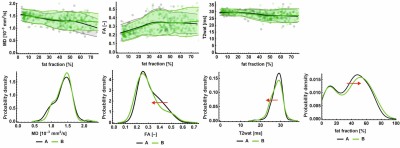
Figure 2. Example of comparison of derived indices from muscle diffusion tensor
with and without eddy current correction in tibialis anterior (TA) muscle. (A)
Comparison of FA map, MD map, color-encoded map of the first eigenvector (ε1), and projection of ε1
on unit hemisphere within the superficial and deep compartments of TA. Color
scheme of direction encoding: red: x-direction, green: y-direction,
blue: z-direction; superficial and deep compartments of the TA muscle
are delineated by yellow and aqua boundaries in ε1 maps,
respectively. (B) Comparison of map of eigenvalues.
-
Altered creatine kinase activity and mitochondrial oxidative capacity in muscular dystrophic mdx mice after repeated muscle contraction
Kihwan Kim1, Yuning Gu1, Yuran Zhu1, Yudu Li2,3, Sherry Huang1, Zhi-Pei Liang 2,3, and Xin Yu1,4
1Biomedical Engineering, Case Western Reserve University, cleveland, OH, United States, 2Electrical and Computer Engineering, University of Illinois at Urbana-Champaign, Urbana, IL, United States, 3Beckman Institute for advanced Science and Technology, University of Illinois at Urbana-Champaign, Urbana, IL, United States, 4Case Center for Imaging Research, Case Western Reserve University, cleveland, OH, United States
31P-MRS was used to
evaluate changes in muscle metabolism in a mouse model of Duchenne muscular
dystrophy, the mdx mouse. We observed altered
creatine kinase activity and phosphocreatine recovery rate, suggesting abnormal mitochondrial function in the skeletal muscle of mdx mice.
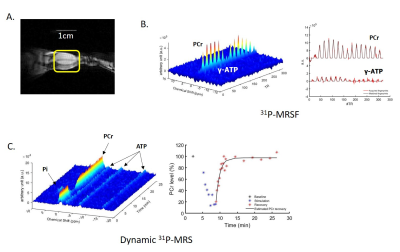
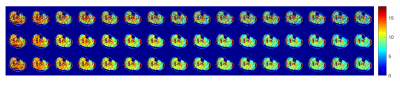
Figure 1. (A) Coronal image of mouse
hindlimb with a 1cm long landmark to display the length and location of 31P-
saddle coil; (B) 3D 31P-MR
fingerprints and 2D 31P-MR fingerprints matched to a dictionary
entry (C) 3D and 2D dynamic 31P-MR
spectra
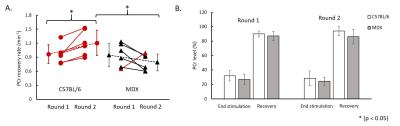
Figure 3. (A) PCr
recovery rate between round 1 and round 2 stimulations (red color indicates increase in PCr recovery
rate and black color indicates decrease in PCr recovery rate); (B) PCr level at
the end of stimulation-induced muscle contraction and at after 16 min recovery.
-
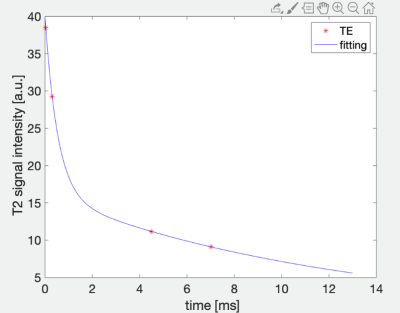
Establishing a computational approach to investigate the biophysical basis of relaxivity contrast imaging in the context of muscle degeneration
Natenael B Semmineh1, Sudarshan Ragunathan2, Laura C Bell2, and C Chad Quarles 2
1Imaging Research, Barrow Neurological Institute rrow Neurological Institute, Phoenix, AZ, United States, 2Imaging Research, Barrow Neurological Institute, Phoenix, AZ, United States
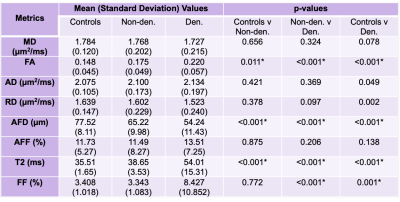
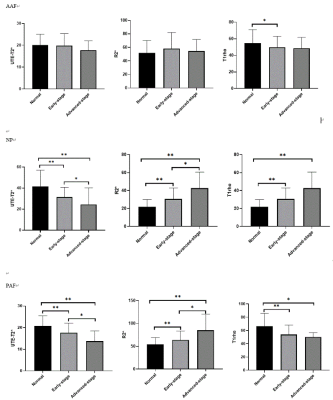
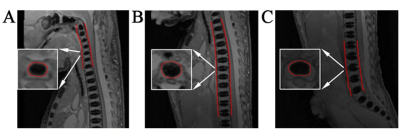
Tissue transverse relaxivity at tracer equilibrium (TRATE) can longitudinally differentiate myofiber atrophy in an ALS model.
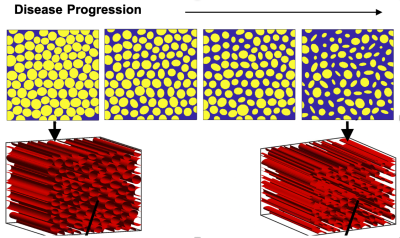
Figure 1: Representative tissue structure that will be used to characterize RCI in silico, as a function of ALS progression. Top row shows a 2D section of the 3D structure below.
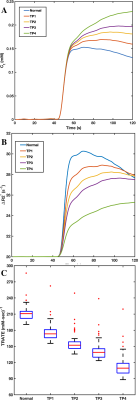
Figure 2: Example concentration time curves (A), ΔR2* time curves (B) and the corresponding TRATE values (C) over four diseases progression time points (TP) along with a normal myofiber case. Note each profile in ALS are dissimilar in shape and magnitude both for ΔR2* and concentration.
-
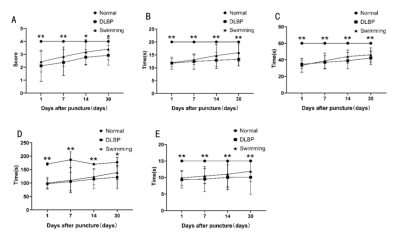
Effect of moderate exercise on diffusion indices in skeletal muscle
Amy R McDowell1, Matthew T Lee2, Kiran K Seunarine2, and Chris A Clark2
1Centre for Neuromuscular Diseases, UCL Queen Square Institute of Neurology, London, United Kingdom, 2GOS UCL Institute of Child Health, London, United Kingdom
An examination of the effect of moderate
exercise on diffusion indices in skeletal muscle in volunteers in order to
quantify the effect of the exercise, and define when diffusion indices returned
to baseline rest values.
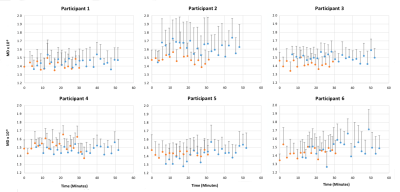
Figure 2: Individual results of MD from each
participant by time. Orange points are pre-exercise (plotted from time of first
scan), blue points are post-exercise (plotted from time exercise ceased). Error
bars are one standard deviation shown in one direction only for clarity.
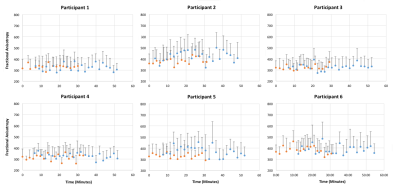
Figure 3: Individual
results of FA from each participant by time. Orange points are pre-exercise
(plotted from time of first scan), blue points are post-exercise (plotted from
time exercise ceased). Error bars are one standard deviation shown in one
direction only for clarity.
-
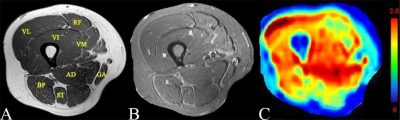
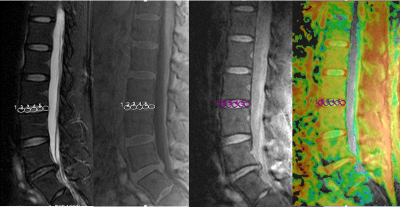
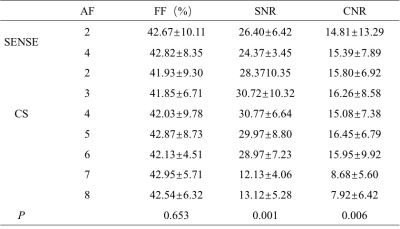
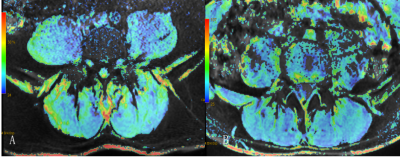
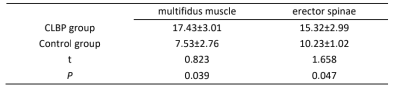
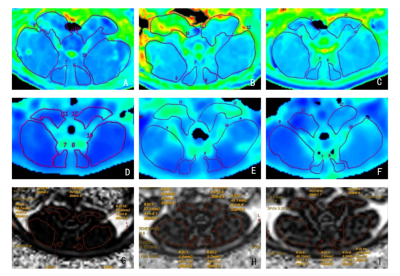
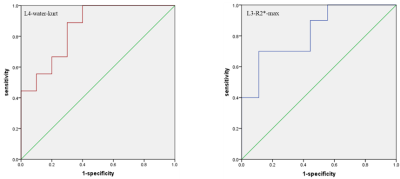
Quantification of gluteal and multifidus muscle asymmetry and fat infiltration in patients with unilateral lumbosacral nerve root compression
Mengyue Wang1, Weiqiang Dou2, Yu Zheng1, Yin Shi1, and Yuefen Zou1
1The First Affiliated Hospital of Nanjing Medical University, Nanjing, China, 2GE Healthcare, MR Research China, Beijing, China
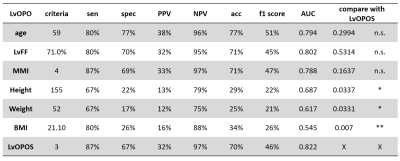
The changes of gluteal and multifidus muscles were side- and level-specific in unilateral lumbosacral nerve root compression, affected by several other factors. Muscle content is suggested as a good parameter for clinical evaluation.
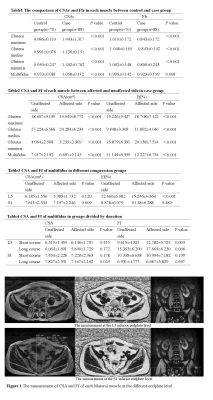
Table 1-4 and Figure 1
-
Interleaved multi-voxel 1H and 31P MRS for dynamic pH monitoring in the exercising calf muscle at 3 T with dynamic water reference.
Alfredo Liubomir Lopez Kolkovsky1,2, Beatrice Matot1,2, Eric Giacomini1, Martin Meyerspeer3, Benjamin Marty1,2, and Harmen Reyngoudt1,2
1NMR Laboratory, Institute of Myology, Paris, France, 2NMR Laboratory, CEA\DRF\IBFJ\MIRCen, Paris, France, 3High Field MR Center, CMPBME, Medical University of Vienna, Vienna, Austria
An interleaved 1H/31P
multi-voxel sequence for pH monitoring based on carnosine (pH1H,
PRESS) and Pi (sLASER) was extended with a dynamic water reference, removing a
~0.05 bias on pH1H measured during a plantar flexion exercise. pH time
courses (1-min temporal resolution) were comparable.
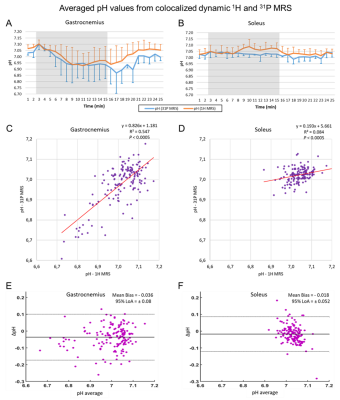
Figure 5. (A,B) pH values (mean, std) derived from
the co-localized (orange) 1H and (blue) 31P
spectra averaged over 1-min intervals during the exercise paradigm for the
gastrocnemius (left column) and soleus (right column) muscles. The
13-min exercise period is shown (shaded area).
(C,D) Linear correlations and (E,F)
Bland-Altman plots between pH1H and pH31P values measured
during the exercise paradigm of all subjects. LoA = Limits of agreement.

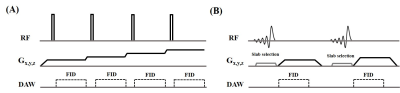
Figure 1. A.
Pulse sequence chronogram showing the order of acquisition for each voxel and
nucleus. The RF power was calibrated for each voxel prior to the dynamic acquisition.
B.
The volumes-of-interest, VOI 1 and VOI 2, were placed in the gastrocnemius and soleus,
respectively. Typical voxels dimensions were 2x6x7 cm3. The nominal
regions affected by the excitation pulses are shaded.
-
A Marker Controlled Active Contour Model for Thigh Muscle Segmentation in MR Images
Weihong Guo1, Michael Judkovich1, Richard Lartey2, Dongxing Xie2, Mingrui Yang2, and Xiaojuan Li2
1Mathematics, Applied Mathematics and Statistics, Case Western Reserve University, Cleveland, OH, United States, 2Biomedical Engineering, Program of Advanced Musculoskeletal Imaging (PAMI), Lerner Research Institute, Cleveland Clinic, Cleveland, OH, United States
The proposed active contour model can segment MR thigh muscle groups with an average Dice coefficient of 92.5%. The user only needs to input a few markers inside and outside each muscle group. This step can be automated using atlas registration.
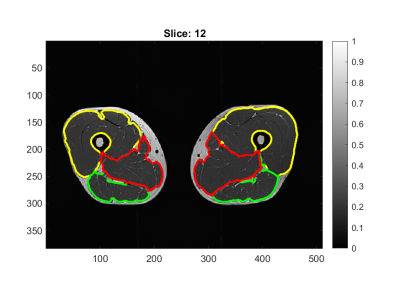
Figure 4: Segmentation results of three muscle groups (quadriceps: yellow, hamstrings: green, others: red).

Table 1: Dice Similarity Coefficients
-
DT-MRI with the random permeable barrier model shows larger, more heterogeneous muscle fibre diameters in Becker muscular dystrophy patients
Donnie Cameron1,2, Jedrzej Burakiewicz1, Nienke M. van de Velde3, Celine Baligand1, Thom T.J. Veeger1, Melissa T. Hooijmans4, Jan J.G.M. Verschuuren3, Erik H. Niks3, and Hermien Kan1
1C.J. Gorter Centre for High Field MRI, Department of Radiology, Leiden University Medical Centre, Leiden, Netherlands, 2Norwich Medical School, University of East Anglia, Norwich, United Kingdom, 3Department of Neurology, Leiden University Medical Centre, Leiden, Netherlands, 4Biomedical Engineering and Physics, Amsterdam University Medical Centre, Amsterdam, Netherlands
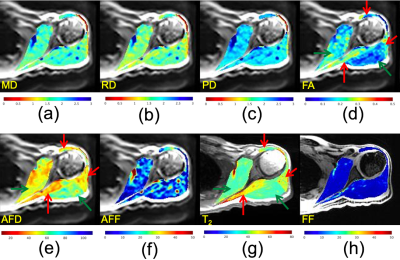
In Becker muscular dystrophy patients, DTI with the random permeable
barrier model shows larger and more variable fibre diameters than in
age-matched controls. Conventional DTI parameters show intramuscular
differences and time-dependence but do not significantly differ between groups.
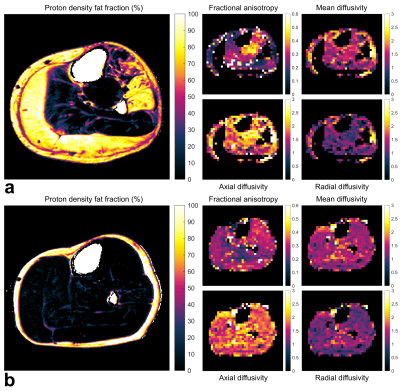
Fig. 1. Representative
lower-leg Dixon images and STE-DTI parameter maps from a 59-year-old Becker
muscular dystrophy (BMD) patient (a) and a 58-year-old healthy control (b).
STE-DTI data were acquired with a diffusion time, Δ, of 330 ms, and mean,
axial, and radial diffusivities are shown in units of μm2/s. The BMD
patient shows severe fat replacement in the gastrocnemius medialis and
lateralis, and peroneus longus and extensor digitorum longus muscles (fat
fraction = 83, 77, 77, and 64%, respectively). This leads to signal voids in
the comprehensively-fat-suppressed DTI data.
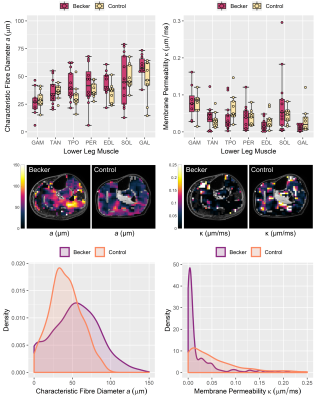
Fig. 4. Fibre diameter, a, and membrane permeability, κ, from the random permeable barrier model in
Becker muscular dystrophy patients and
controls. Boxplots (top) show a and κ
over the soleus (SOL), medial gastroc.
(GAM), lateral gastroc. (GAL), tibialis anterior (TAN), tibialis posterior
(TPO), peroneus longus (PER), and extensor digitorum longus (EDL). Median
values = thick lines, hinges = 25th and 75th percentiles,
and dots = raw data. Maps (middle) show a and κ in a 59-year-old patient
and 58-year-old control. Density plots (bottom) show a and κ distributions from
maps above.
-
Optimized water T2 mapping from multi-echo spin-echo acquisitions with an external fat fraction constraint
Francesco Santini1,2, Xeni Deligianni1,2, Matteo Paoletti3, Francesca Solazzo3, Matthias Weigel1,4,5, Paulo Loureiro De Sousa6, Oliver Bieri1,2, Mauro Monforte7, Enzo Ricci7,8, Giorgio Tasca7, Anna Pichiecchio3,9, and Niels Bergsland10,11
1Radiological Physics, Department of Radiology, University Hospital of Basel, Basel, Switzerland, 2Department of Biomedical Engineering, University of Basel, Allschwil, Switzerland, 3Neurological Institute Foundation Casimiro Mondino (IRCCS), Pavia, Italy, 4Translational Imaging in Neurology, Department of Biomedical Engineering, University of Basel, Allschwil, Switzerland, 5Department of Neurology, University Hospital of Basel, Basel, Switzerland, 6UMR7357 Laboratoire des sciences de l'Ingénieur, de l'Informatique et de l'Imagerie (ICube), Strasbourg, France, 7Institute of Neurology, A. Gemelli University Hospital Foundation, Catholic University of the Sacred Heart, Rome, Italy, 8Institute of Neurology, Catholic University of the Sacred Heart, Rome, Italy, 9Department of Brain and Behavioral Sciences, University of Pavia, Pavia, Italy, 10Western New York Stem Cell Culture and Analysis Center, Jacobs School of Medicine and Biomedical Sciences, University of Buffalo, Buffalo, NY, United States, 11Fondazione Don Carlo Gnocchi Onlus (IRCCS), Milan, Italy
Water T2 can be efficiently estimated from multi-echo spin-echo acquisitions. The incorporation of an external fat fraction scan improves the accuracy and reduces the scan time. An optimized implementation of this method is released publicly.
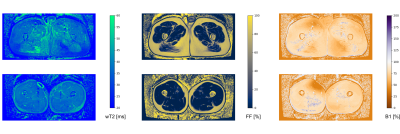
Figure 1: Water T2 (left), Fat Fraction (middle), and relative B1 (right) maps of a patient (top) and healthy volunteer (bottom), reconstructed from a 17-echo acquisition without fat fraction constraint.
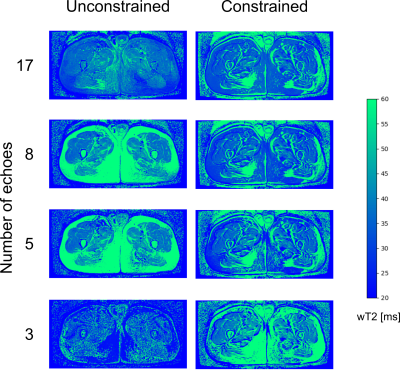
Figure 2: Water T2 maps for a patient, reconstructed from different numbers of echoes with (right) and without (left) an external fat fraction constraint.
-
Elliptical filter optimization for HARP based strain quantification in skeletal muscle
Melissa T. Hooijmans1,2, Crystal L. Coolbaugh3, Xingyu Zhou2,4, Mark K. George2, and Bruce M. Damon4,5,6
1Department of Radiology & Nuclear Medicine, Amsterdam Movement Sciences, Amsterdam UMC, Location AMC, Amsterdam, Netherlands, 2Vanderbilt University Institute of Imaging Science, Nashville, TN, United States, 3Vanderbilt University Institute of Imaging Sciences, Nashville, TN, United States, 4Department of Biomedical Engineering, Vanderbilt University Medical Center, Nashville, TN, United States, 5Department of Radiology & Radiological Sciences, Vanderbilt University Medical Center, Nashville, TN, United States, 6Department of Molecular Physiology & Biophysics, Vanderbilt University Medical Center, Nashville, TN, United States
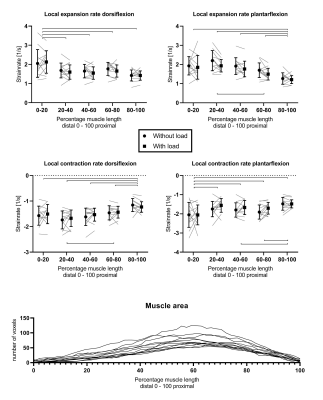
Using an easily translatable
simulation approach. optimized elliptical filter parameters
were found for accurate strain quantification in skeletal muscle in a range of
strain levels.
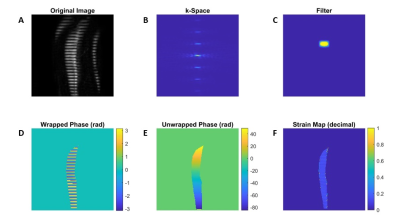
Figure 1. An overview
of the individual steps used for strain quantification in a representative
dataset. The original magnitude image (A), the Fourier Transform (FT) of the
magnitude image (k-space) (B),an elliptical filter used to isolate the first
harmonic peak (C), the inverse FT of the modified k-space (D), the unwrapped phase
image (E) and the quantitative strain
map (F).
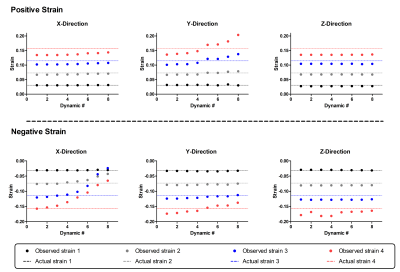
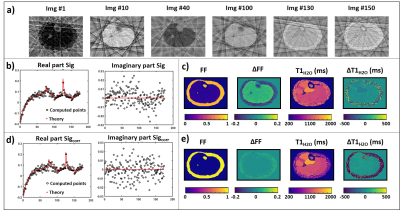
Figure 3. The actual and measured
strain for the positive and negative simulated strain levels (Strain 1= black; Strain
2 = gray; Strain 3 = blue; Strain 4 = red) for each of the dynamics using the
optimal elliptical filter size. The actual strain values are shown with dotted
lines in the graph (Actual strain 1 (+/- 0.031) = black; Actual strain 2 (+/-
0.073) = gray; Actual strain 3 (+/- 0.115) = blue; Actual strain 4 (+/- 0.156)
= red) . Each dot is the mean over the participants. Deformation in X-plane is
shown on the left, in the Y-plane in the middle and in the Z-plane on the right.
-
Imaging of calf muscle contraction in pediatric patients with cerebral palsy: comparison of voluntary motion and electrically evoked motion
Claudia Weidensteiner1,2, Xeni Deligianni1,2, Tanja Haas1, Philipp Madoerin1, Oliver Bieri1,2, Meritxell Garcia3, Jacqueline Romkes4, Erich Rutz5, Francesco Santini1,2, and Reinald Brunner6
1Department of Radiology, Division of Radiological Physics, University Hospital Basel, Basel, Switzerland, 2Department of Biomedical Engineering, University of Basel, Basel, Switzerland, 3Department of Radiology, Division of Neuroradiology, University Hospital Basel, Basel, Switzerland, 4Laboratory for Movement Analysis, University Children's Hospital Basel, Basel, Switzerland, 5Hugh Williamson Gait Laboratory, The Royal Children's Hospital Melbourne, Parkville, Australia, 6Department of Orthopedic Surgery, University Children's Hospital Basel, Basel, Switzerland
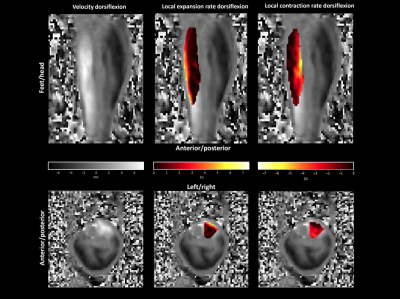
Calf muscle contraction speed was measured with
cine phase contrast MRI in children with cerebral palsy during (a) electrical
muscle stimulation (b) voluntary motion. Higher force but lower periodicity and
no distinct velocity peaks were achieved for voluntary vs. stimulated
contraction.
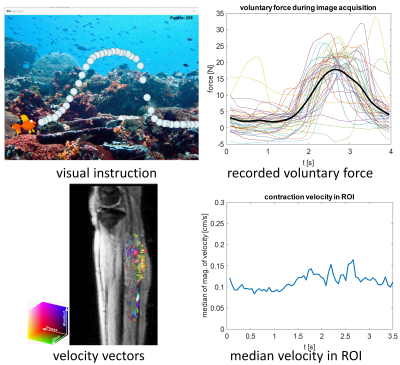
Figure 2: Cine phase contrast MRI experiment with
voluntary motion in a 11 y girl with diparetic cerebral palsy. Top left: visual
paradigm for instruction and feedback for the patient. Top right: time courses
of the force on the pedal with the mean force curve (over the
whole experiment) in black. Bottom left:
velocity vectors in the ROI in the calf at release. Bottom right: Time course
of the velocity magnitude (ROI median) showing several peaks.
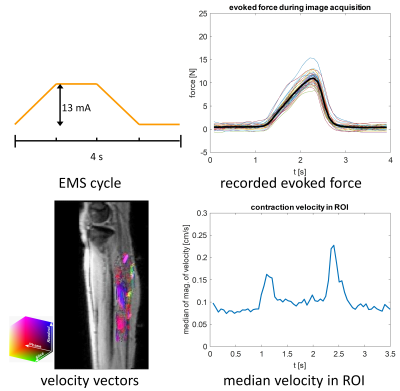
Figure 1: Cine phase contrast MRI experiment with
synchronized electrical muscle stimulation (EMS) in a 11 y girl with diparetic
cerebral palsy. Top left: current amplitude of the EMS cycle. Top right: time
courses of the evoked force on the pedal with the mean force curve (over the
whole experiment) in black. Bottom left: velocity vectors in the ROI in the
calf at release. Bottom right: Time course of the velocity magnitude (ROI
median) showing two peaks at contraction (left) and release (right).
-
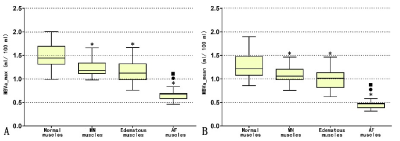
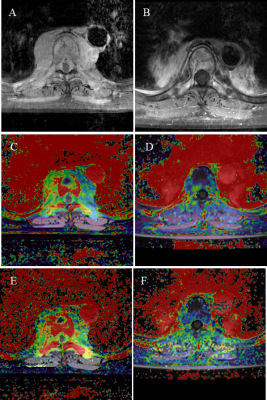
IDEAL-CPMG muscle T2-water and Dixon Fat-Fraction Maps in People with Inclusion Body Myositis and Charcot-Marie-Tooth disease Type 1A
Amy R. McDowell1, Stephen J. Wastling1,2, Lara Cristiano3, Jasper M. Morrow1, Matthew R.B. Evans4, Christopher D.J. Sinclair1, Pedro M. Machado1, Michael Hanna1, Mary M. Reilly1, Tarek Yousry1, and John S. Thornton1
1MRC Centre for Neuromuscular Diseases, UCL Queen Square Institute of Neurology, London, United Kingdom, 2Lysholm Department of Neuroradiology, National Hospital for Neurology and Neurosurgery, London, United Kingdom, 3Department of Pediatric Neurology and Radiology, Fondazione Policlinico Universitario, Rome, Italy, 4St Thomas Hospital, London, United Kingdom
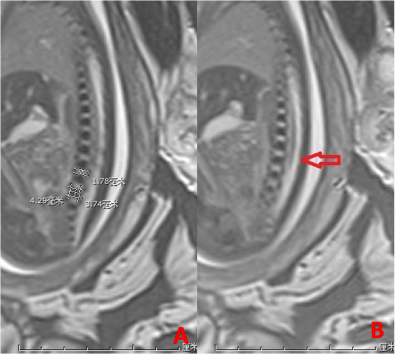
The IDEAL-CPMG sequence was acquired in healthy volunteers and two different muscular
dystrophy disease types to obtain quantitative T2-water maps
uncontaminated by the T2-fat signal. It was found that elevated T2-water may be a
predictor of later progression to fatty-atrophy in muscle
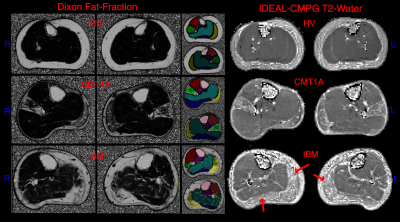
Figure 1: Example Dixon and IDEAL-CPMG
T2-water maps in a healthy volunteer (HV), a person with CMT (CMT1A) and a
person with IBM (IBM). Segmentation ROIs are shown in the centre. Tibialis
Anterior – red, Tibialis Posterior – dark pink, Medial Gastrocnemius – yellow,
Peroneus Longus – green, Soleus – blue, Lateral Gastrocnemius – purple. Red
arrows indicate areas of raised T2 corresponding to oedema. Areas of high fat
such as the bone marrow yield noise in the T2-water maps as there is insufficient
water in this area for accurate estimation.
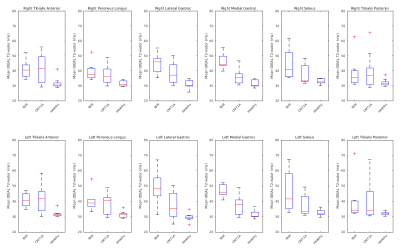
Figure 2: Box plots of T2-Water in individual
muscle ROIs by disease type. The central mark indicates the median, and the
bottom and top edges of the box indicate the 25th and 75th percentiles,
respectively. Whiskers are min and max. T2-water values show a narrower range
in comparison to Dixon-FF% in each disease, especially in the medial and
lateral Gastrocnemius, Dixon-FF% has a wider spread of fat fractions for both
diseases. T2-water gives a more definitive separation of disease type and may
show a higher specificity in a larger cohort.
-
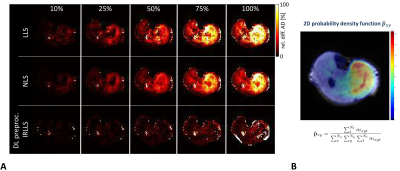
Denoising dynamic CrCEST in skeletal muscle following exercise using low rank tensor approximations
Neil Wilson1, Mark A Elliott2, Dushyant Kumar2, and Ravinder Reddy2
1Siemens Medical Solutions USA Inc, Malvern, PA, United States, 2CMROI, University of Pennsylvania, Philadelphia, PA, United States
Dynamic CrCEST allows for high resolution mapping of the creatine kinase reaction recovery kinetics following exercise over large ROIs. Here, we show that improved denoising utilizing low rank tensor approximations allows for reliable fits over smaller volumes or single voxels.
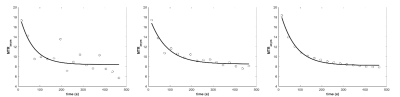
Recovery time course for a single voxel in the lateral
gastrocnemius. Without denoising (left), denoising method 1 (center), denoising
method 2 (right).
MTRasym
maps without denoising (top row), with denoising method 1 (middle), and with
denoising method 2 (bottom)
-
Feasibility Study of 31P Multivoxel Spectroscopy for the detection of Alkaline Inorganic Phosphate in multiple compartments of the lower leg at 3T
Rajakumar Nagarajan1 and Gwenael Layec2
1Human Magnetic Resonance Center, Institute for Applied Life Sciences, University of Massachusetts Amherst, Amherst, MA, United States, 2Kinesiology, University of Massachusetts Amherst, Amherst, MA, United States
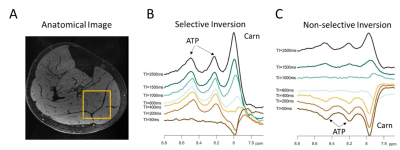
This
study provides the proof of concept for a non-invasive and localized method to
determine the alkaline Pi, a potential index of mitochondrial density at rest.
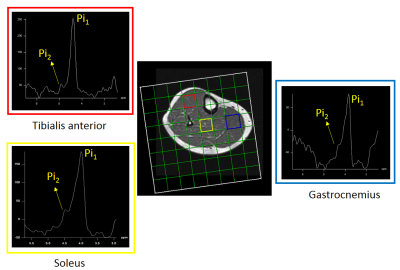
Figure
2. A 36 years old healthy volunteer 2D
CSI voxel location and selected single voxel spectrum and zoomed Pi region from
the tibialis anterior (red), soleus (yellow) and gastrocnemius (blue) muscles
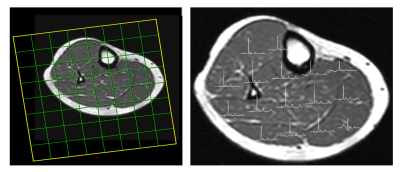
Figure
1. A 36 years old healthy volunteer 2D
CSI voxel location and multivoxel spectra on top of T1W MRI
-
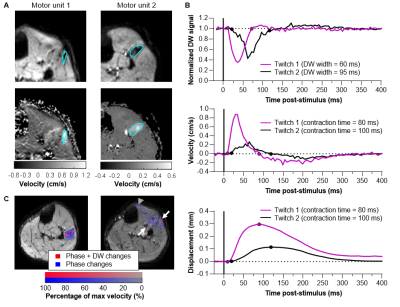
Measuring motor unit morphology in upper extremities using motor unit magnetic resonance imaging (MUMRI)
Matthew Birkbeck1,2,3, Linda Heskamp1, Ian Schofield1, Roger Whittaker1, and Andrew Blamire1
1Translational and Clinical Research Unit, Newcastle University, Newcastle upon Tyne, United Kingdom, 2Newcastle Biomedical Research Centre, Newcastle Biomedical Research Centre, Newcastle upon Tyne, United Kingdom, 3Northern Medical Physics and Clinical Engineering, Newcastle upon Tyne NHS Foundation Trust, Newcastle upon Tyne, United Kingdom
MUMRI has been applied for the
first time to study in-vivo single human MUs in the forearm and hand muscles
and to determine the size and shapes of these MUs. This increases the clinical
translatability of the MUMRI technique.
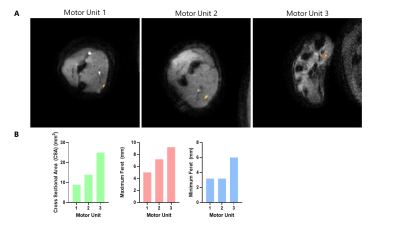
Figure
4: A) MU difference maps overlaid onto the MUMRI
images for each of the extracted MUs. Two from the forearm in the flexor carpi
ulnaris muscle and one from the hand in the abductor pollicis muscle. B) Bar
charts showing MU metrics: cross sectional area (CSA) shown in green, maximum
Feret diameter shown in red and minimum Feret diameter shown in blue.
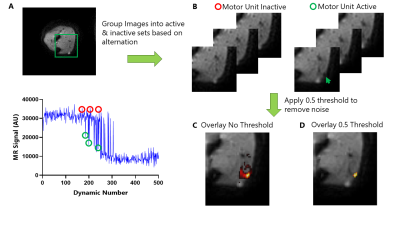
Figure
2: Data processing
steps to extract the single MUs. A) MUMRI image B) Images grouped into two data
sets: where motor unit is inactive and active (indicated by red arrow). Graph
shows single voxel time-series from the MU territory, example alternations
where MU inactive (red circle), MU active (green circles). C) MU difference map
with no threshold applied. D) MU difference map with 0.5 threshold, showing
good agreement with initial size of MU territory in (B).
-
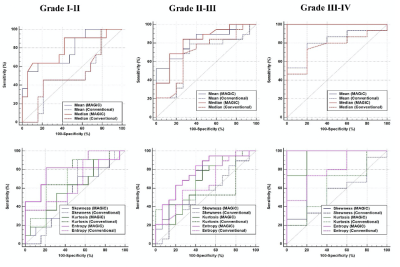
MR analysis of thigh muscle myopathy using texture features and supervised machine learning
Hon J Yu1, Saya Horiuchi1,2, Toshimi Tando1, Vincent J Caiozzo3, Virginia E Kimonis4, and Hiroshi Yoshioka1
1Radiological Sciences, University of California, Irvine, Orange, CA, United States, 2Radiology, St. Luke's International Hospital, Tokyo, Japan, 3Department of Orthopaedics, Physiology & Biophysics, University of California, Irvine, Irvine, CA, United States, 4Division of Genetic and Genomic Medicine, Department of Pediatrics, University of California, Irvine, Irvine, CA, United States
Texture features can
classify varying degrees of muscle myopathy when properly trained in supervised
machine-learning framework.
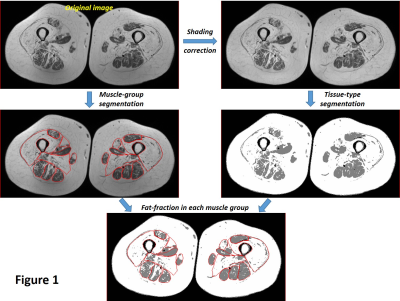
The
overall workflow of fat-fraction calculation that utilizes manual muscle
segmentation, shading/intensity-correction across FOV, and classification of
different tissue types based on a 3-class fuzzy c-means (FCM) algorithm.
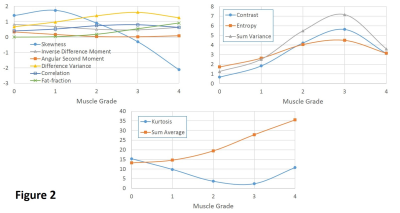
Plots
of group-averaged fat-fraction and texture parameter values with similar
vertical scales in order to better visualize their trends as a function of
muscle grades.
-
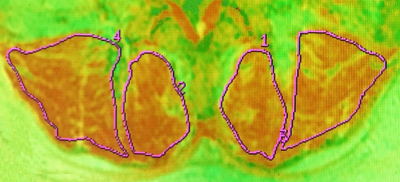
1H MRS: a tool to study age-related changes in intracellular metabolites in the deep spinal muscles?
Sarah Catherine Wayte1, Alexander Dallaway2, Andrew David Weedall1, John Hattersley3, and Adrian John Wilson3,4
1Radiology Physics, Department of Clinical Physics and Bioengineering, University Hospital, Coventry, United Kingdom, 2Centre for Sport, Exercise and Life Sciences, Coventry University, Coventry, United Kingdom, 3Coventry NIHR CRF, Human Metabolic Research Unit, University Hospital, Coventry, United Kingdom, 4Department of Physics, University of Warwick, Coventry, United Kingdom
No difference (p>0.05) in the concentration of intracellular lipids in the spinal muscles of older and younger participants; a much higher concentration of creatine in older participants (p=0.23); no correlation between metabolite concentrations.
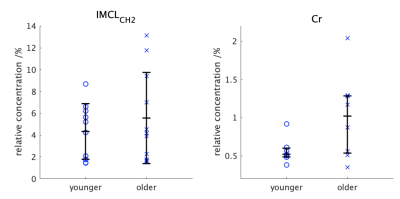
Figure 2. Individual values for the normalized concentrations of IMCLCH2 (left) and Cr (right) for the two groups together with the lower, median and upper quartiles.
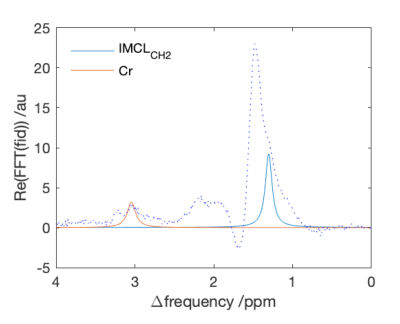
Figure 1. An example of the raw spectrum together with the fitted IMCLCH2 and Cr components. The large peak at 1.5ppm is the methylene extracellular lipid (EMCLCH2)
-
SEMI-AUTOMATIC QUANTIFICATION OF ABDOMINAL WALL MUSCLES DEFORMATIONS BASED ON DYNAMIC MRI IMAGE REGISTRATION
Arthur Jourdan1, Arnaud Le Troter2, Pierre Daude2, Stanislas Rapacchi2, Catherine Masson1, Thierry Bege1,3, and David Bendahan2
1Aix-Marseille Univ, Univ Gustave Eiffel, IFSTTAR, LBA, Marseille, France, 2Aix Marseille Univ, CNRS, CRMBM, Marseille, France, 3Department of General Surgery, Aix Marseille Univ, North Hospital, APHM, Marseille, France
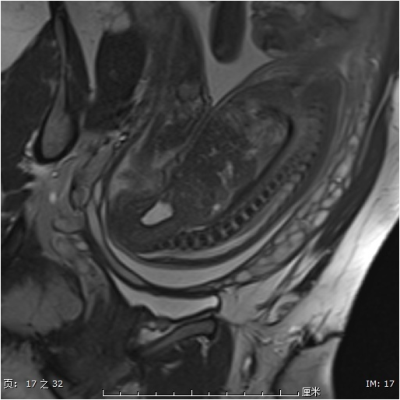
A
novel semi-automatic post-processing method dedicated to real-time dynamic MRI
aiming at a fast and reliable quantification of abdominal wall muscles
deformations based on a supervised 2D+t segmentation (mean Dice similarity coefficient of 0.95), masks registration and
parcellation.
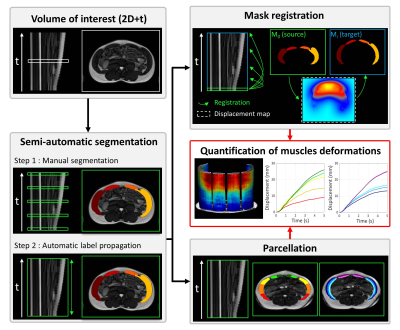
Figure 2 : Quantification
of muscles deformations pipeline; A : 2D+t volume of interest in sagittal view
with an arbitrary selected axial slice.
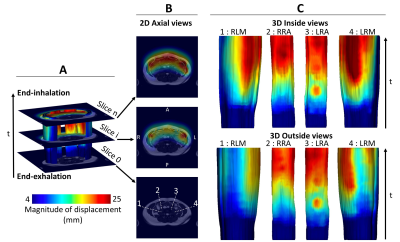
Figure 3 : Typical
magnitude of displacement maps. These maps were obtained for the subject
closest to the mean values of the cohort; A : 3d general view of displacement
magnitude within the abdominal wall muscles from end-exhalation to
end-inhalation with three anatomical MRI slices; B : 2D axial views of the
magnitude of displacement computed on the three previous anatomical MRI slices;
C : 3D visualization of the magnitudes within each individual muscle group.
-
Feasibility and Reproducibility Study of Diffusion-Tensor Imaging in Rotator Cuff Muscles of Asymptomatic Volunteers.
Cyril Tous, PhD1, Alexandre Jodoin, MD2, Detlev Grabs, MD, PhD3, Elijah Van Houten, PhD4, and Nathalie J Bureau, MD MSc FRCP(C)1,2
1Radiology, Centre de recherche du Centre hospitalier de l’Université de Montréal, Montreal, QC, Canada, 2Radiology, Centre hospitalier de l’Université de Montréal, Montréal, QC, Canada, 3Anatomy, Université du Québec à Trois-Rivières, Trois-Rivières, QC, Canada, 4Mechanical Engineering, Université de Sherbrooke, Sherbrooke, QC, Canada
Rotator cuff tears lead to fatty infiltration and fibrosis,
causing stiffness and decreased elasticity. Diffusion Tensor Imaging
stabilizes regularization in elastography. Good DTI repeatability is achieved in
six asymptomatic volunteers and myocytes’ tracks are retrieved.
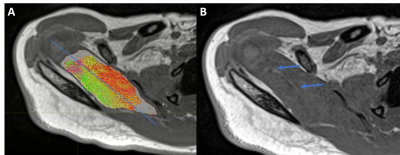
Figure 4) The
mask delineates the supraspinatus (A-white background on muscle) where
tractography is performed (A-colors) overlaid by a T1 VIBE image. The line separation (A-blue line) corresponds
to the separation between the posterior and anterior bundle (B-arrows) where myocytes insert posteriorly (red
tracks) and anteriorly (green track).
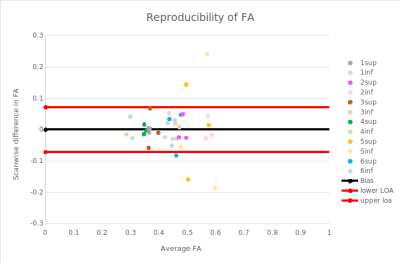
Figure 2) Bland-Altman
plots of FA across three scans (pairwise comparison of scans 1-2, 1-3, 2-3) for
each volunteer (1 to 6) in the supraspinatus (sup) or infraspinatus (inf).
Limit of agreement (loa) is 0.071 with a bias at 0.0.