-
Dual-Phase Imaging of Cardiac Metabolism using Hyperpolarized [1-13C]Pyruvate
Junjie Ma1, Craig R. Malloy1,2,3, Crystal E. Harrison1, James Ratnakar1, Galen D. Reed4, Vlad G. Zaha1,2, and Jae Mo Park1,3,5
1Advanced Imaging Research Center, UT SOUTHWESTERN MEDICAL CENTER, Dallas, TX, United States, 2Internal Medicine, UT Southwestern Medical Center, Dallas, TX, United States, 3Radiology, UT Southwestern Medical Center, Dallas, TX, United States, 4GE Healthcare, Dallas, TX, United States, 5Electrical and Computer Engineering, UT Dallas, Richardson, TX, United States
The
proposed method achieved the dual-phase acquisition for hyperpolarized 13C-labeled
metabolites for human heart. Two different
phases (end systole and end diastole) could be clearly distinguished for all HP
metabolites in short-axis and long-axis ventricle views.
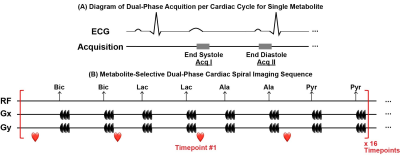
Figure 1. Acquisition scheme for each metabolite
and the proposed imaging sequence. (A) For
each metabolite, two acquisitions were conducted during each cardiac cycle,
which are at end systole and end diastole, respectively. (B) Multi-echo
images for hyperpolarized [13C]bicarbonate, [13C]lactate,
[1-13C]alanine and [1-13C]pyruvate are acquired in order
with the interval of 1 R-R for each timepoint. Images from in total 16
timepoints are acquired.
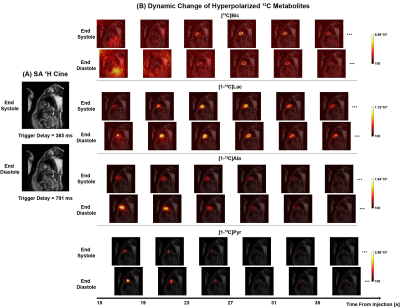
Figure 3. Dual-phase hyperpolarized [1-13C]pyruvate
cardiac imaging in SA plane. (A) 1H cardiac images in SA plane with the trigger delays of 385 ms (end systole)
and 791 ms (end diastole) respectively from a healthy subject. (B)
Dynamic change of hyperpolarized [13C]bicarbonate, [1-13C]lactate,
[1-13C]alanine and [1-13C]pyruvate in two phases from 15
s to 35 s post the injection of pyruvate.
-
Metabolic response of radiotherapy in patient-derived glioblastoma xenografts using hyperpolarized magnetic resonance
Travis Salzillo1, Vimbai Mawoneke2, Joseph Weygand2, Akaanksh Shetty2, Joy Gumin3, Niki Zacharias2, Seth Gammon2, David Piwnica-Worms2, Gregory Fuller4, Christopher Logothetis5, Frederick Lang3, and Pratip Bhattacharya2
1Radiation Oncology, University of Texas MD Anderson Cancer Center, Houston, TX, United States, 2Cancer Systems Imaging, University of Texas MD Anderson Cancer Center, Houston, TX, United States, 3Neurosurgery, University of Texas MD Anderson Cancer Center, Houston, TX, United States, 4Pathology, University of Texas MD Anderson Cancer Center, Houston, TX, United States, 5Genitourinary Medical Oncology, University of Texas MD Anderson Cancer Center, Houston, TX, United States
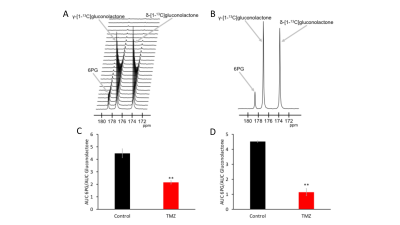
During tumor regression and recurrence, hyperpolarized MR detected significant
changes in pyruvate-to-lactate conversion. In contrast, tumor volume
measurements were not significantly altered. nLac can serve as a biomarker to
predict long-term response shortly after radiotherapy.
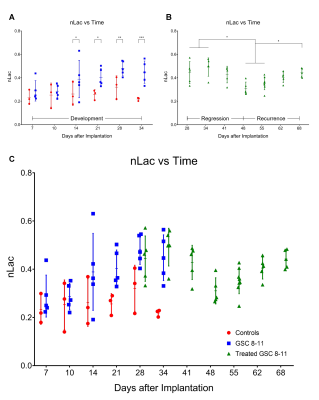
In vivo pyruvate-to-lactate
conversion is significantly altered throughout tumor development, regression,
and recurrence. Individual nLac values, measured with hyperpolarized 13C
MRS, are plotted as a function of time for control mice (red circles) and
untreated tumor-bearing mice (blue squares) during tumor development (A). Individual nLac values are plotted for treated tumor-bearing mice (green triangles) during
tumor regression and recurrence (B).
Individual nLac values are plotted across the entirety of
tumor progression (C). *p < 0.05, **p <
0.01, ***p < 0.001.
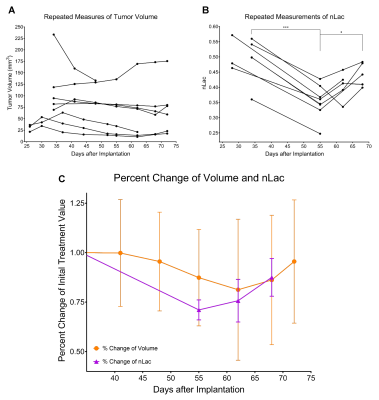
Percent change of nLac, but not tumor volume, is significantly altered
during tumor regression and recurrence. Repeated measures of tumor volume are
acquired over time in treated mice with anatomic MRI (A) and hyperpolarized MRS (B).
At each time-point, volume and nLac were normalized to their initial value
following treatment and plotted as percent change over time (C). *p < 0.05, ***p < 0.001.
-
Hyperpolarized 13C MRI of Fumarate Metabolism for Imaging Necrosis in Hepatitis Mice by Parahydrogen-induced Polarization.
Shingo Matsumoto1, Neil J. Stewart1, Hitomi Nakano1, Takuya Hashimoto2, and Hiroshi Hirata1
1Information Science and Technologies, Hokkaido University, Sapporo, Japan, 2Department of Chemistry, Chiba University, Chiba, Japan
We demonstrated the feasibility of in vivo cell death imaging by 13C MRI of hyperpolarized [1-13C]fumarate, prepared by parahydrogen-induced polarization (PHIP) a low-cost alternative of typical dDNP, in acetaminophen-induced hepatitis model mouse.
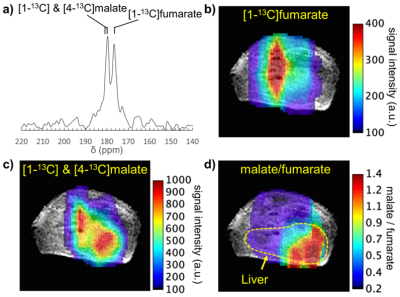
Figure 4. In
vivo
CSI of hyperpolarized [1-13C]fumarate
metabolism in an acetaminophen-induced hepatitis mouse. (a) Representative 13C NMR
spectrum of hyperpolarized [1-13C]fumarate
and its metabolite at the liver. (b) map of hyperpolarized [1-13C]fumarate
CSI signal intensity overlaid on an
anatomical 1H MRI
image. (c) map of hyperpolarized [1-13C]
& [4-13C]malate.
(d) parametric map of the malate/fumarate ratio; a biomarker of cellular
necrosis.
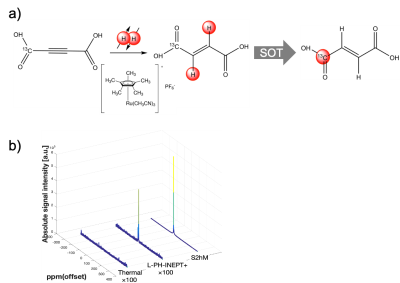
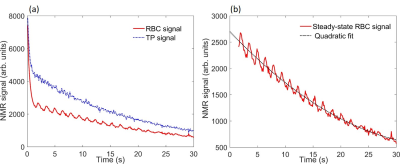
Figure 2. (a)
Preparation
of hyperpolarized [1-13C]fumarate
by trans-alkenylation
with parahydrogen.
(b) 13C
NMR of hyperpolarized [1-13C]
fumarate using different 1H-to-13C spin order transfer pulse sequences.
-
Dependency of glycolytic factors in HCC lactate and alanine flux as measured by hyperpolarized 13C MRI
Qianhui Dou1, Aaron K. Grant1, Cody K. Callahan1, Muneeb Ahmed1, and Leo Lee Tsai1
1Radiology, Beth Israel Deaconess Medical Center, Boston, MA, United States
Hyperpolarized 13C
MRI measurements of lactate and alanine flux correlates with tumor growth
following stimulation by nearby hepatic thermal ablation, but this is reliant on
the sufficient expression of key glycolytic modulators.
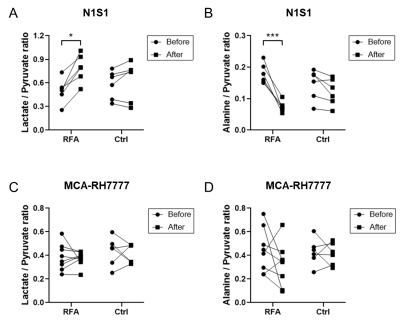
Figure
1. Lactate and alanine
flux within N1S1 and MCA-RH7777 tumors as measured with h13C
MRI. Lactate/pyruvate (A) and alanine/ pyruvate (B) ratios measured in N1S1
tumors before and 72 hours after RFA versus sham (control) treatments. Lactate/
pyruvate (C) and alanine/ pyruvate (D) ratios in MCA-RH7777 tumors before and 72 hours after RFA versus sham (control) treatments. *, p<0.05, ***,
p<0.001.
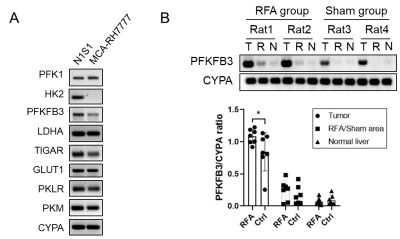
Figure 2. N1S1 and MCA-RH7777 tumor glycolysis-related
mRNA expression following treatment. (A) Glycolysis-related gene expression
pattern in N1S1 and MCA-RH7777 cell line. (B) PFKFB3 expression in N1S1 tumor
(T), adjacent normal liver (N) and RFA/sham site (R), for RFA and sham
(control) arms. Quantification of band intensity is presented as % of relative
densitometry normalized to the CYPA gene. *, p<0.05.
-
Imaging Treatment Response with Hyperpolarized Pyruvate in Anaplastic Thyroid Carcinoma
Christopher M Walker1, Zhan Xu1, Keith Michel1, Gary Martinez1, Collin J. Harlan1, Jeremy W. Gordon2, Stephanie Carlon1, Sandra Williams1, Freddy Gonzalez1, Stacy Hash1, Jerell Jones1, Asa McCoy1, Brandy Willis1, Michelle Underwood1, Andrew Day3, Moin Chariwala3, Dao Le4, Gregory Waligorski3, Daniel B. Vigneron2, Dawid Schellingerhout5, Stephen Y. Lai6, and James A. Bankson1
1Imaging Physics, MD Anderson Cancer Center, Houston, TX, United States, 22. Department of Radiology and Biomedical Imaging, University of California San Francisco, San Francisco, San Francisco, CA, United States, 3Center for Advanced Biomedical Imaging, MD Anderson Cancer Center, Houston, TX, United States, 4Nuclear Medicine, MD Anderson Cancer Center, Houston, TX, United States, 5Nueroradiology, MD Anderson Cancer Center, Houston, TX, United States, 6Head and Neck Surgery, MD Anderson Cancer Center, Houston, TX, United States
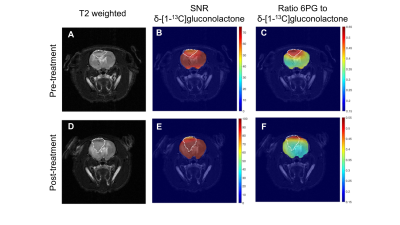
We present a decrease in the conversion of hyperpolarized pyruvate
into lactate production following eight days of systemic therapy in a patient
with anaplastic thyroid cancer.
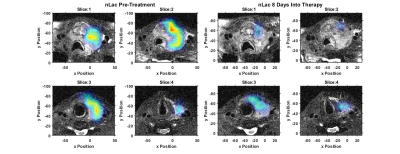
nLac
maps overlaid on top of T2w images at baseline (left) or 8 days
into systemic treatment (right). All high nLac voxels were confined to the
tumor. Measured nLac values were reduced 31% 8 days after the onset of
systemic therapy.
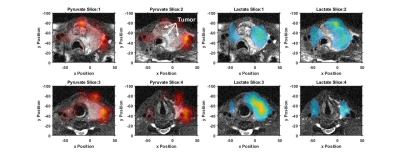
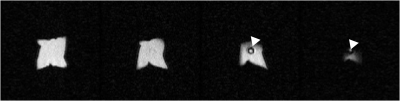
Baseline area under the curve images for hyperpolarized
pyruvate (left) and lactate (right) overlaid on top of T2w images of
a large left-sided ATC tumor identified with the white arrows on slice 2. Pyruvate
signal is primarily observed in the vascular anatomy while lactate signal is
localized to the tumor.
-
Off-Resonance Correction with Self-Estimated Field Map for Hyperpolarized 13C Metabolic Imaging
Xiaoxi Liu1, Shuyu Tang1,2, Xucheng Zhu1,3, and Peder E.Z. Larson1
1Radiology and Biomedical Imaging, University of California, San Francisco, San Francisco, CA, United States, 2HeartVista, Inc., Los Altos, CA, United States, 3GE Healthcare, Sunnyvale, CA, United States
In this project, we investigated two off-resonance correction methods with self-estimated field maps to correct off-resonance effect in Hyperpolarized 13C data with spiral readout. We also compared two correction methods by applying them on different anatomies.
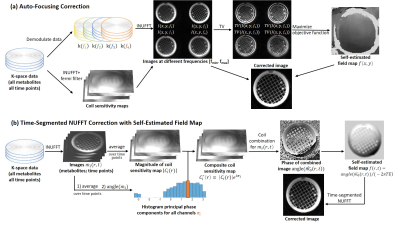
Flowcharts
of (a) the auto-focusing correction method and (b) time-segmented NUFFT correction
with self-estimated field map method.
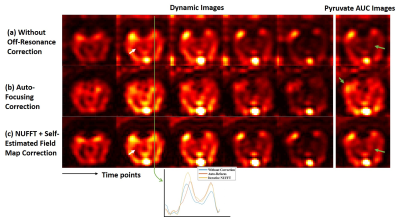
Reconstruction
results of brain data with pyruvate signal. The images are processed (a)
without off-resonance correction, (b) auto-focusing correction, and (c)
iterative NUFFT with self-estimated field map correction. We compared dynamic
images at five time points and area-under-the-curve (AUC) images. The green
arrows show the comparison between different methods and illustrate method(c)
has better correction performance. A line profile is chosen for intensity
comparison.
-
In Vivo Evaluation of Glutaminase Activity with Hyperpolarized [5-13C,4,4-2H2,5-15N]-L-Glutamine in PDAC
Roozbeh Eskandari1, Arsen Mamakhanyan1, Michelle Saoi2, Kristin L Granlund1, Justin Cross2, Craig B Thompson3, and Kayvan Rahimi Keshari1,4
1Radiology, Memorial Sloan Kettering Cancer Center, New York, NY, United States, 2Memorial Sloan Kettering Cancer Center, New York, NY, United States, 3Cancer Biology & Genetics Program Share, Memorial Sloan Kettering Cancer Center, New York, NY, United States, 4Radiology, Memorial Sloan Kettering, New York, NY, United States
We developed a custom-synthesized compound, [5-13C,4,4-2H2,5-15N]-L-Glutamine, as a hyperpolarized MRI probe for glutaminase activity. We were able to detect in vivo conversion of hyperpolarized glutamine to glutamate in murine model of PDAC.
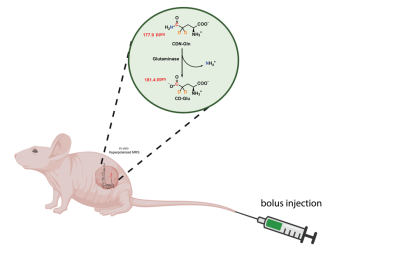
Conversion of [5-13C,4-2H2,5-15N]-L-Glutamine to [5-13C,4-2H2]-L-Glutamate with glutaminase in tumor. Red, orange, blue represent sites of 13C, 2H and 15N enrichment, respectively.
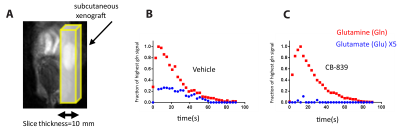
A T2-weighted 1H MRI of mouse, with tumor (right) highlighted as regions of sagittal slab B Dynamic of conversion of glutamine to glutamate in the tumor with vehicle. C Dynamic of conversion of glutamine to glutamate in the tumor with glutaminase inhibitor CB-839
-
Magnetic Resonance Imaging Comparisons of Renal Cell Carcinoma Patient-derived Xenografts
Joao Piraquive1, Hongjuan Zhao2, Rosalie Nolley2, Robert Bok1, James D. Brooks2, Donna M. Peehl1, John Kurhanewicz1, and Renuka Sriram1
1Department of Radiology and Biomedical Imaging, University of California San Francisco, University of California San Francisco, San Francisco, CA, United States, 2Department of Urology, Stanford University, Stanford, CA, United States
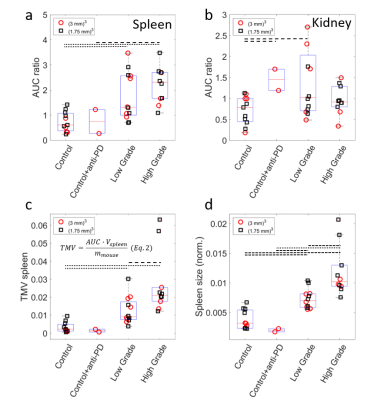
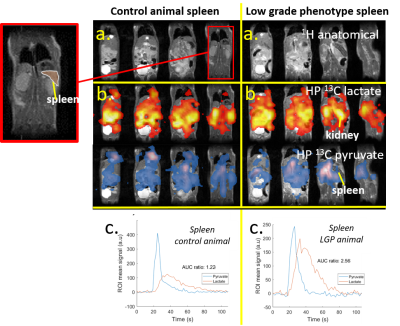
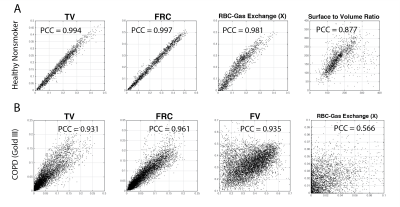
The present study showed that morphological similarities persisted in PDXs, whereas the glycolytic capacity was significantly increased in the latter passage, implying natural selection of the more aggressive cells.
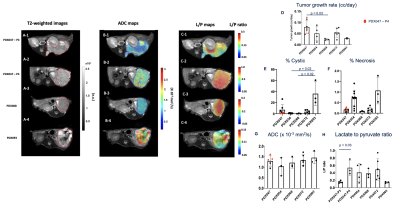
Figure
1. Imaging comparison between PDXs. Images show differences in tumor morphology
(A1-A4), tumor cellularity (B-1-B4) and tumor glycolysis in tumors (C-1-C-4).
D) Bar graph shows the mean %cystic component and F) %necrosis component. G)
Bar graph of the ADC mean calculated for all tumor slices. H) Bar graph of the
lactate to pyruvate conversion rate in tumors. a.u.: arbitrary units.a.u.:
arbitrary units. The significance of the Dunn’s post-test. Red dots in bar
graphs indicate passage 3 and 4 of PDX047.
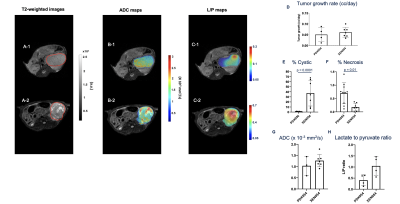
Figure
2. Imaging comparison between PDX054 and its xenograft XEN054. Images show
differences in tumor morphology (A1-A4), tumor cellularity (B-1-B4) and tumor
glycolysis in tumors (C-1-C-2). D) Bar graph shows the mean %cystic component
and F) %necrosis component. G) Bar graph of the ADC mean calculated for all
tumor slices. H) Bar graph of the lactate to pyruvate conversion ratio in
tumors. a.u.: arbitrary units. The significance of the Mann-Whitney test is
indicated above the plots. All p < 0.05 indicated statistical
significance.
-
In Vivo T2* of Hyperpolarized 13C-Metabolites in Human Brain, Heart, Kidney, and Spleen: An Imaging Approach
Junjie Ma1, Crystal E. Harrison1, James Ratnakar1, Galen D. Reed2, Rolf F. Schulte3, Vlad G. Zaha1,4, Craig R. Malloy1,4,5, and Jae Mo Park1,5,6
1Advanced Imaging Research Center, UT SOUTHWESTERN MEDICAL CENTER, Dallas, TX, United States, 2GE Healthcare, Dallas, TX, United States, 3GE Healthcare, Munich, Germany, 4Internal Medicine, UT Southwestern Medical Center, Dallas, TX, United States, 5Radiology, UT Southwestern Medical Center, Dallas, TX, United States, 6Electrical and Computer Engineering, UT Dallas, Richardson, TX, United States
In vivo T2*s
of hyperpolarized metabolites were consistent along the time, but largely
varied between organs, highlighting the importance of
organ-/metabolite-specific consideration of T2* in data acquisition
and interpretation.
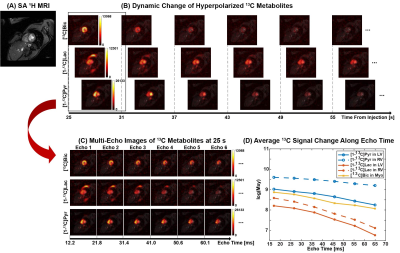
Figure 1. T2* measurement of HP 13C-labeled
metabolites for human heart. (A)
Short-axis 1H MRI of heart from a healthy subject. (B) Dynamic
changes of [13C]bicarbonate, [1-13C]lactate and [1-13C]pyruvate
from 25 s to 55 s after the injection of HP pyruvate. (C) The first 6
echoes acquired at 25 s post the injection for [13C]bicarbonate, [1-13C]lactate
and [1-13C]pyruvate. (D) Changes of 13C signals
within LV, RV and Myo along the echo time in log scale at 25 s post the
injection.
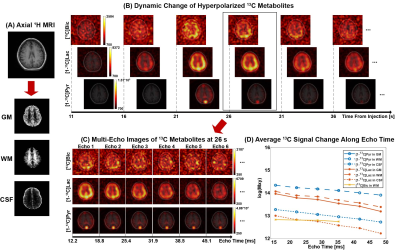
Figure 2. T2* measurement of HP 13C-labeled
metabolites for human brain. (A) Axial
1H MRI of brain from a healthy subject, according to which GM, WM
and CSF were segmented. (B) Dynamic changes of [13C]bicarbonate,
[1-13C]lactate and [1-13C]pyruvate from 11 s to 36 s
after the injection of HP pyruvate. (C) The first 6 echoes acquired at 26
s post the injection for [13C]bicarbonate, [1-13C]lactate
and [1-13C]pyruvate. (D) Changes of 13C signals within
GM, RM and CSF along the echo time in log scale at 26 s post the injection.
-
Kinetic Analysis of Multi-resolution Hyperpolarized 13C Human Brain MRI
Jasmine Y Graham1, Adam W Autry2, Yaewon Kim2, Robert A Bok2, Yan Li2, Peder EZ Larson1,2, Daniel B Vigneron1,2, and Jeremy W Gordon2
1Bioengineering, UC San Francisco, UC Berkeley, San Francisco, CA, United States, 2Radiology and Biomedical Imaging, UC San Francisco, San Francisco, CA, United States
Higher resolution 7.5 mm2 HP [1-13C]pyruvate EPI images improved kinetic rate quantification in human brain by reducing partial volume effects. Selected voxels near blood vessels and in white and gray matter showed >20% higher kPL with higher resolution pyruvate images.
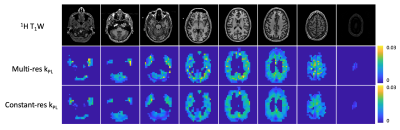
Figure 2. Kinetic rate maps for pyruvate to lactate conversion, using 15 × 15 mm2 lactate signals with 7.5 × 7.5 mm2 pyruvate and synthetic 15 × 15 mm2 pyruvate images thresholded to SNR >5 and <30% fit error, along with reference proton images. The constant-resolution kPL map shows smoothing of the kinetic rates in the brain as compared to the multi-resolution kPL map.
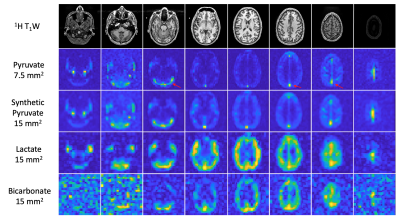
Figure 1. Hyperpolarized 13C pyruvate, lactate and bicarbonate signals summed over 60 seconds with reference proton images. The synthetic 15 × 15 mm2 pyruvate data set was obtained by convolving the 7.5 × 7.5 mm2 pyruvate data with an averaging kernel. The red arrows point out the high pyruvate signal in the transverse sinus for the third slice and in the superior sagittal sinus for the sixth and seventh slices.
-
A genetic algorithm-optimized hetero-nuclear polarization transfer pulse sequence for metabolic imaging
Vencel Somai1,2, Felix Kreis3, Adam Gaunt1, and Kevin M Brindle1,4
1Cancer Research UK Cambridge Institute, University of Cambridge, Li Ka Shing Centre, Robinson Way, Cambridge, United Kingdom, 2Department of Radiology, University of Cambridge, School of Clinical Medicine Box 218, Cambridge Biomedical Campus, Cambridge, United Kingdom, 3Department of Information Technology and Electrical Engineering, ETH Zurich, Rämistrasse 101, Zurich, Switzerland, 4Department of Biochemistry, University of Cambridge, Tennis Court Road, Cambridge, United Kingdom
The proposed method produced a ΔB0
and B1 insensitive pulse sequence that required ~2 times lower peak
B1 than the BINEPT sequence. The performance was tested on a [15N2]urea
phantom, where it transferred more polarization than the BINEPT sequence and could
also be used for partial transfer.
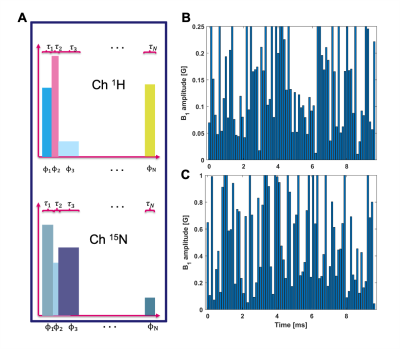
(A) Discretized shaped pulses on
1H and 15N channels. The color-coding and the height of
the bars represent the phase (Φi)
and the amplitude of the pulse points respectively. The length of the pulse
points (τi)
is also an optimization variable. (B) Pulse amplitude on proton channel for the
1H to 15N full transfer. (C) Pulse amplitude on the 15N
channel. Despite the rapidly varying waveforms the predicted behavior was well
preserved.
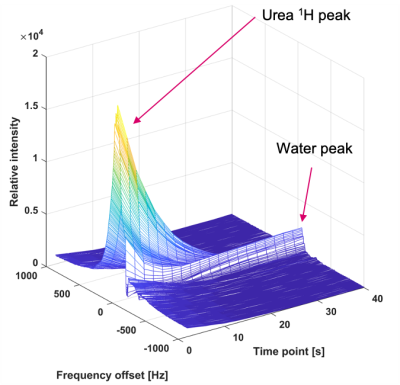
Time course for 15N to 1H
partial polarization transfer in a hyperpolarized [15N2]urea phantom. The
broad urea peak is the result of the degraded magnetic field homogeneity caused
by injection of the hyperpolarized urea. The residual water peak is due to insufficient water suppression
-
DNP Polarizing Agents in Preclinical HP MRS: Influence in the Context of Transient Ischemic Stroke
Thanh Phong Lê1,2, Lara Buscemi3, Mario Lepore4, Lorenz Hirt3, Jean-Noël Hyacinthe1,5, and Mor Mishkovsky2
1Geneva School of Health Sciences, HES-SO University of Applied Sciences and Arts Western Switzerland, Geneva, Switzerland, 2Laboratory of Functional and Metabolic Imaging, EPFL (Swiss Federal Institute of Technology in Lausanne), Lausanne, Switzerland, 3Department of Clinical Neurosciences, Lausanne University Hospital (CHUV) and University of Lausanne (UNIL), Lausanne, Switzerland, 4Center for Biomedical Imaging (CIBM), EPFL, Lausanne, Switzerland, 5Image Guided Intervention Laboratory, University of Geneva (UNIGE), Geneva, Switzerland
The
nitroxyl TEMPOL radical, administered at the same dose as when used as DNP polarizing
agent, significantly modifies
the cerebral metabolic response to a bolus of hyperpolarized [1-13C]lactate
after transient ischemic stroke.
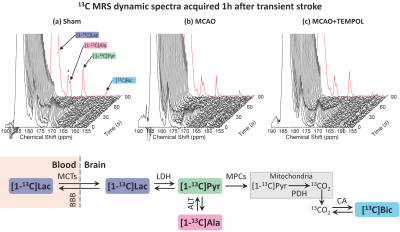
Figure 2: Representative dynamic cerebral 13C MRS
acquired after a bolus infusion of [1-13C]lactate (lb=10Hz).
The summed signal from the first 90s post-infusion is plotted in red. The
vertical scale was normalized to the height of the summed HP lactate peak. In
both healthy and stroke animals, the HP lactate was converted into [1-13C]pyruvate
(171.1 ppm), [1-13C]alanine (176.7 ppm) and [13C]bicarbonate
(161.2 ppm). The signal observed at 177.7 ppm (*) is an impurity from the
stock lactate solution.
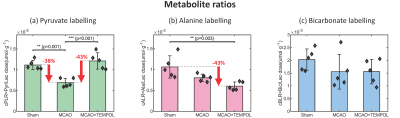
Figure 3: Metabolite ratios following HP lactate infusion at 1h
post-surgery or post-reperfusion. Data are represented as mean ± SD.
(a) Following infusion of
[1-13C]lactate, the normalized pyruvate-to-lactate ratio (cPLR) was
significantly lower in the MCAO group compared to both sham and MCAO+TEMPOL
groups. (b) A trend towards lower alanine
labeling (cALR) was observed after stroke, with a significant difference
between MCAO+TEMPOL and sham.
(c) The bicarbonate-to-lactate ratio (cBPR) tends to decrease after stroke.
-
Transportable hyperpolarized glucose: protocol for sample extraction and delivery
Andrea Capozzi1, Jan Kilund2, Magnus Karlsson2, Mathilde Hauge Lerche2, and Jan Henrik Ardenkjær-Larsen2
1LIFMET, EPFL, Lausanne, Switzerland, 2Health Technology, Technical University of Denmark, Kgs. Lyngby, Denmark
The future of hyperpolarized 13C MRI is to make hyperpolarization transportable. Herein, we demonstrated it for the first time in the case of glucose. We just made a step towards how clinical examinations are performed with PET using the glucose analog 18FDG.
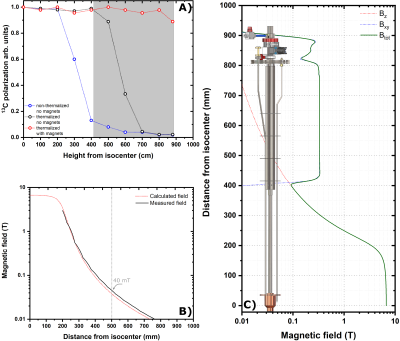
(A) 13C polarization losses as a function of the sample vertical position
inside the polarizer while using a traditional DNP probe (blue and black
circles) and our new probe containing permanent magnets (red circles).The gray shaded area represents
the area covered by permanent magnets in the new probe. (B) Measured (black line) and calculated (red line) polarizer magnetic field profile. (C) Calculated total (green line) magnetic field: superconductive magnet (red dotted line) + permanent magnets (blue dotted line).
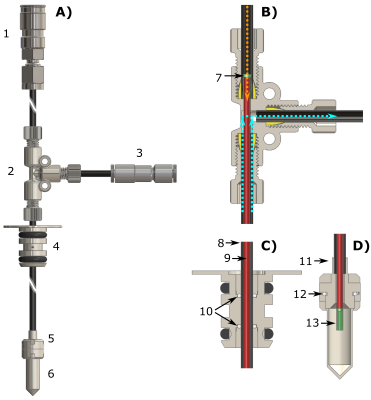
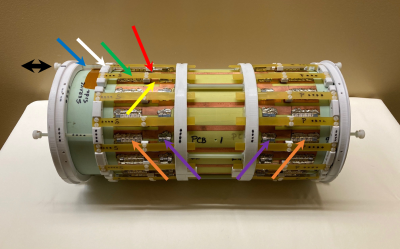
Technical
drawings of the CFP (A) and zoomed section of the T-valve indicating
inner (orange arrow) and outer (cyan arrows) flow directions (B),
dynamic sealing (C) and sample threaded vial (D). Numbers
indicates the most important components of the device: quick release connection
(1), T-valve (2), one-way valve (3), dynamic sealing (4), vial top part (5),
vial bottom part (6), outer-lumen to inner-lumen transition (7), black PEEK
outer-lumen (8), red PEEK inner-lumen (9), dynamic sealing silicone o-ring (10),
laser welded joint (11), vial PTFE o-ring (12), nozzle (13).
-
Hyperpolarized [1-13C] pyruvate MR spectroscopic imaging to detect metabolic changes in liver in a MCD rat model of fatty liver disease
Joao Piraquive1, Shubhangi Agarwal1, Robert Bok1, John Kurhanewicz1, Aras Mattis2,3, Jaqueline Maher3,4, Cornelius von Morze5, and Michael A. Ohliger1,3
1Department of Radiology and Biomedical Imaging, University of California San Francisco, University of California San Francisco, San Francisco, CA, United States, 2Department of Pathology, University of California San Francisco, San Francisco, CA, United States, 3Liver center, University of California, San Francisco, CA, United States, 4Department of Medicine, University of California San Francisco, San Francisco, CA, United States, 5Biomedical Magnetic Resonance Laboratory, Washington University School of Medicine, St. Louis, MO, United States
We showed important changes in fat signal fraction and pyruvate metabolism in rats fed the MCD diet by using 1H and 13C MR imaging.
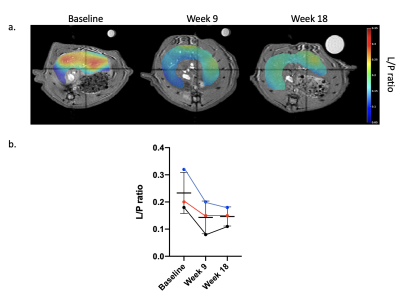
Figure
2. Lactate to pyruvate (L/P) ratio maps at baseline, and week 9 and 18 in rats
fed the MCD diet. b) Graph of L/P ratio values at baseline, and week 9 and 18
in rats fed the MCD diet. T-tests were performed to compare changes between time points.
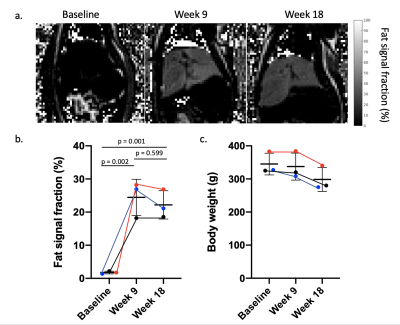
Figure
1. Fat signal fraction (FSF) maps at baseline, and week 9 and 18 in rats fed
the MCD diet. b) Graph of FSF values and c) body weight values at baseline, and week 9 and 18 in rats fed
the MCD diet. T-tests were performed to
compare changes between time points.
-
Constrained UNFOLD (CoUNFOLD)-a New Constrained Reconstruction for Hyperpolarized 13C Pyruvate Imaging
Zhan Xu1, Christopher M Walker1, Collin J Harlan1, Keith A Michel1, Gary V Martinez1, and James A Bankson1,2
1Imaging Physics, MD Anderson Cancer Center, Houston, TX, United States, 2UT Health Graduate School of Biomedical Sciences, The University of Texas MD Anderson Cancer, Houston, TX, United States
A new model-based constrained reconstruction method
CoUNFOLD is introduced for hyperpolarized 13C pyruvate imaging. Accurate reconstruction was achieved using undersampled data
acquired on single channel.
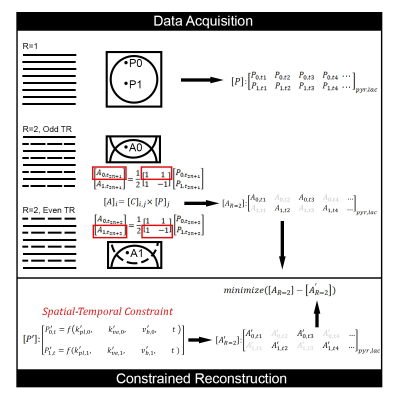
Data acquisition and constrained reconstruction
scheme of CoUNFOLD. P stands for a pixel
in the full FOV image, A stands for an
aliased pixel in the undersampled (R stands for the ratio) image with reduced
FOV, A’ is the estimated aliased pixel that is calculated under the same undersampling scheme as A from the CoUNFOLD
reconstructed image. The solid and dashed lines
represent, respectively, the acquired and skipped phase steps in k-space.
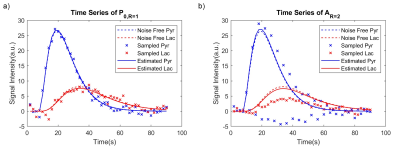
The time series at the same voxel location from
different undersampling rates. (a) The sampled metabolite series ('x') at SNR=30
are fluctuating along the noise free series (dash lines), while the estimated
series (solid) from pharmacokinetic model matches the noise free series with
slight offset. (b) The undersampled pyruvate series (blue 'x') at SNR=30 fluctuate drastically around the noise-free series(dashed lines) and the lactate
series(red 'x') are severely deviated, but the CoUNFOLD restored series
(solid) match the noise free series only with moderate offset.
-
Hyperpolarized 13C-pyruvate MR imaging in rodent model of ventricular fibrillation cardiac arrest: A feasibility study
Hyeong Yeon Lee1, Najmiddin Mamadjonov2, Nguyen Trong Nguyen2, Luu-Ngoc Do3, Tien Ahn Nguyen3, and Ilwoo Park3,4,5
1Emergency Medicine, Chonnam National University Hospital, Gwangju, Korea, Republic of, 2Biomedical Science, Chonnam National University, Gwangju, Korea, Republic of, 3Radiology, Chonnam National University, Gwangju, Korea, Republic of, 4Radiology, Chonnam National University Hospital, Gwangju, Korea, Republic of, 5Artificial Intelligence Convergence, Chonnam National University, Gwangju, Korea, Republic of
This study demonstrated that hyperpolarized 13C metabolic imaging can identify the metabolic changes within 1 hour of return of spontaneous circulation in rodent model of ventricular fibrillation-induced cardiac arrest.
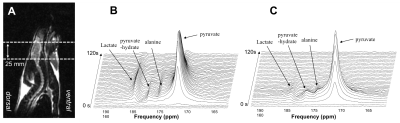
Figure 1. Examples of time-resolved 13C dynamic spectra from a 25 mm slice of rat brain from a CA model (B) and a sham control (C). Hyperpolarized 13C MR spectroscopy data revealed that the cardiac arrest model produced a high level of pyruvate-to-lactate conversion while the sham control had a smaller level of pyruvate-to-lactate conversion compared to the CA model.
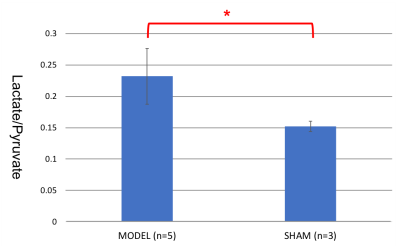
Figure 2. The ratio of lactate to pyruvate in the CA model was statistically higher than that in the sham control (P=0.025).
-
Accelerating Hyperpolarized 13C Spiral Chemical Shift Imaging with Joint Spectral-Spatial Low Rank Plus Sparse Reconstruction
Minjie Zhu1, Stephen DeVience2, and Dirk Mayer1
1University of Maryland Baltimore, Baltimore, MD, United States, 2Scalar Magnetics, LLC, Cuyahoga Falls, OH, United States
The proposed Joint Spectral-Spatial Low Rank Plus
Sparse Reconstruction method increases the flexibility of the application and significantly
reduces reconstruction time compared with previously published method.
Fig. 4: Reconstructed metabolic maps for the in
vivo 2D rat brain imaging data at selected time points with (a) fully sampled
data (b) Two-fold randomly undersampled data using direct NUFFT (c) Two-fold
randomly undersampled data using L+S reconstruction with one L+S process.
Fig. 2: Reconstructed metabolic maps for the digitally
simulated 2D rat imaging data at selected time points with (a) fully sampled
data (b) Two-fold randomly undersampled data using direct NUFFT (c) Two-fold
randomly undersampled data using L+S reconstruction with one L+S process.
-
Comparing aspartate and bicarbonate produced from hyperpolarized 1-13C pyruvate as markers of renal gluconeogenic flux
Hikari A. I. Yoshihara1, Arnaud Comment2,3, and Juerg Schwitter4,5
1Laboratory for Functional and Metabolic Imaging, Institute of Physics, Swiss Federal Institute of Technology, Lausanne (EPFL), Lausanne, Switzerland, 2Cancer Research UK Cambridge Institute, University of Cambridge, Cambridge, United Kingdom, 3General Electric Healthcare, Chalfont St Giles, United Kingdom, 4Division of Cardiology, Lausanne University Hospital (CHUV), Lausanne, Switzerland, 5Cardiac MR Center, Lausanne University Hospital (CHUV) and University of Lausanne (UNIL), Lausanne, Switzerland
Hyperpolarized 1-13C pyruvate metabolites aspartate, malate and fumarate are detected in rat the kidney in vivo. PEP-CK inhibitor 3-MPA does not affect bicarbonate production but does lower the aspartate signal. Aspartate is a potential marker of renal gluconeogenesis.
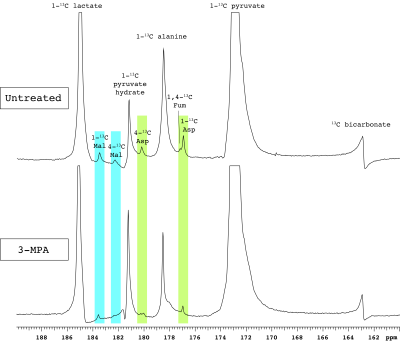
Figure 1. Representative spectra of renal [1-13C]pyruvate metabolism. PEP-CK inhibition by 3-MPA results in markedly lower aspartate and malate signals. Abbreviations: Mal – malate, Asp – aspartate, Fum – fumarate.
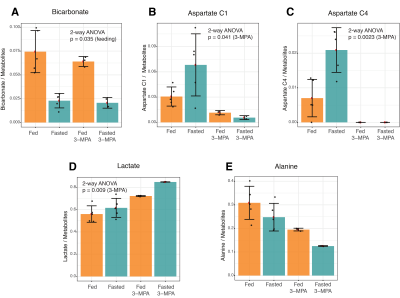
Figure 2. Effects of fasting and 3-MPA treatment on renal metabolism of hyperpolarized 1-13C pyruvate to bicarbonate, aspartate, lactate and alanine. The factors associated with the noted 2-way ANOVA p values are indicated in parentheses.
-
Metabolic Role of ATM in Development of Diffuse Large B-cell Lymphoma
Aditya Jhajharia1, Sui Seng Tee1, Maninder Singh1, Sausan Jaber2, Binny Bhandary3, Brian Polster2, Ronald B. Gartenhaus3,4, Kavita Bhalla3, and Dirk Mayer1
1Diagnostic Radiology and Nuclear Medicine, University of Maryland School of Medicine, Baltimore, MD, United States, 2Department of Anesthesiology, University of Maryland, Baltimore, MD, United States, 3Department of Medicine, University of Maryland, Baltimore, MD, United States, 4Veterans Administration Medical Center, Baltimore, MD, United States
This study applied MRS of hyperpolarized [1-13C]pyruvate in diffuse large B-cell lymphoma (DLBCL) to investigate metabolic changes due to Ataxia-telangiectasia mutated (ATM) kinase deficiency.
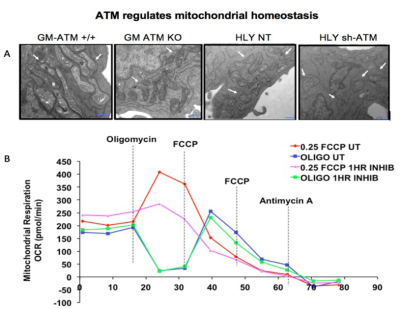
Fig. 2: (A) Representative EM images of mitochondrial structure in non cancer (GM) ATM +/+ & ATM-/- & DLBCL cell lines, HLY-NT & sh-HLY. ATM
unmutated (wt) malignant B-cells consisted of mixed population of tubular and smaller mitochondria compared to typical bacillus-shaped mitochondria in
normal B-cells. Outer membrane was fragmented & a significant lack of the cristae structure within the mitochondria of ATM-/- DLBCL cells. (B)
OCR traces from DLBCL cell line HLY. Cells were chemically inhibited for ATM signaling with KU-55933. Inhibition of ATM
decreased respiration rate in HLY.
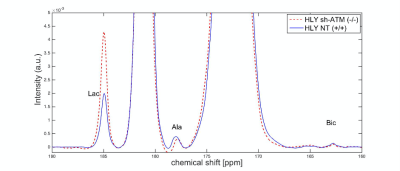
Fig. 3: The hyperpolarized 13C signal at ambient temperature after dissolution. Blue and red spectra correspond to metabolic process in the presence of HLY
NT (+/+) and HLY SH (-/-). Both spectra are normalized with respect to maximum pyruvate signal. HLY sh-ATM (-/-) shows higher conversion of pyruvate into
lactate. In the spectra pyruvate, lactate, pyruvate hydrate, alanine and bicarbonate signals are at 172.8, 184.9, 181, 178.4, and 162.7 ppm, respectively.
-
Imaging pH, metabolism and hypoxia using hyperpolarized 13C-MRI and [18F]FMISO-PET to predict NIS expression in MSC gene therapy in glioblastoma
Martin Grashei1, Carolin Kitzberger2, Jason G. Skinner1, Sandra Sühnel1, Geoffrey J. Topping1, Elisabeth Bliemsrieder1, Christian Hundshammer1, Katja Steiger3, Peter J. Nelson4, Rainer Glaß5, Wolfgang Weber1, Christine Spitzweg2, and Franz Schilling1
1Department of Nuclear Medicine, Klinikum rechts der Isar, Technical University of Munich, School of Medicine, Munich, Germany, 2Medizinische Klinik und Poliklinik IV-Campus Großhadern, University Hospital of Munich, Ludwig-Maximilians-University Munich, Munich, Germany, 3Department of Pathology, Klinikum rechts der Isar, Technical University of Munich, Munich, Germany, 4Medizinische Klinik und Poliklinik IV, University Hospital of Munich, Ludwig-Maximilians-University Munich, Munich, Germany, 5Neurosurgical Research University Clinics, Ludwig-Maximilians-University Munich and Walter-Brendel-Centre of Experimental Medicine, Munich, Germany
Multimodal PET/MRI
imaging in glioblastoma was performed to characterize pH, metabolic conversion
and hypoxia. Here, hypoxia resulted in increased lactate production promoting
mild tumor acidification which can be targeted by MSC-mediated NIS gene
therapies.
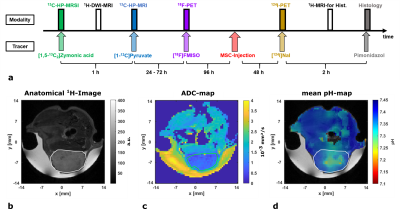
a: Imaging study protocol showing the temporal sequence of the applied modalities and
injected tracers.
b: Axial anatomical T2-weighted 1H-RARE-image of a mouse bearing
a subcutaneous GBM2-tumor (ROI encircled by white line) and Gd‑doped [1-13C]lactate-phantom
(white arrow) covered by gel.
c: ADC-map
showing the fitted diffusion coefficients based on 16 b-value images.
d: Mean pH-map weighted by
compartment-intensities in the corresponding voxel overlaid with anatomical
image.
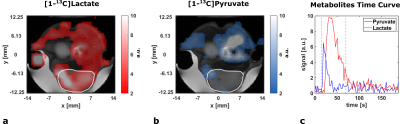
a:
Axial [1-13C]lactate intensity
image integrated over the range displayed in c overlaid with an
anatomical image.
b: Axial [1-13C]pyruvate intensity
image integrated over the range displayed in c overlaid with an
anatomical image.
c: Signal time curves for [1-13C]pyruvate (blue) and [1-13C]lactate (red) with a 3D tumor ROI.
Integration ranges for intensity images in a and b are displayed
with dashed lines.