-
A quantitative multiparametric 18F-FPIA PET/MRI study for the characterization of primary brain gliomas
Marianna Inglese1, Shah Islam1, Matthew Grech-Sollars1,2, Giulio Anichini3, James Davies4, Azeem Saleem4,5, Matthew Williams6,7, Kevin S O'Neill3, Adam D Waldman8, and Eric O Aboagye1
1Surgery and Cancer, Imperial College London, London, United Kingdom, 2Imaging, Imperial College London Healthcare NHS Trust, London, United Kingdom, 3Imperial College London Healthcare NHS Trust, London, United Kingdom, 4Invicro Imperial College London, London, United Kingdom, 5Hull York Medical School, Faculty of Health Sciences, University of Hull, Hull, United Kingdom, 6Computational Oncology Group, Department of Surgery and Cancer, Imperial College London, London, United Kingdom, 7Institute for Global Health Innovation, Imperial College London, London, United Kingdom, 8Centre for Clinical Brain Sciences, University of Edinburgh, Edinburgh, United Kingdom
A strong correlation was found
between 18F-FPIA PET SUV and K1, and between the Ki and the MRI perfusion parameters rCBF and rCBV. By combining PET and MRI, the preliminary
grade predictive vector provided 100% accuracy in tumour grade prediction.
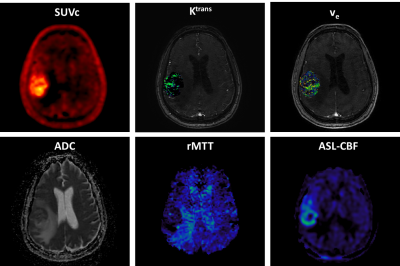
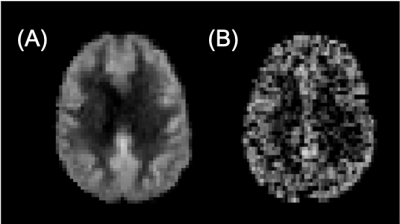
Figure 1: 18F-FPIA
PET/MRI acquisition. Axial
images of a representative patient of the standardised uptake value corrected
by the tracer uptake in the whole blood (SUVc), the contrast agent
plasma/interstitium transfer rate constant Ktrans and the
extracellular extravascular volume fraction ve resulted from the
post-processing of DCE-MRI data, the apparent diffusion coefficient (ADC) map
from DWI-MRI acquisition, the relative contrast agent mean transit time (rMTT)
derived from DSC-MRI and the cerebral blood flow (CBF) derived from the
sequence of ASL.
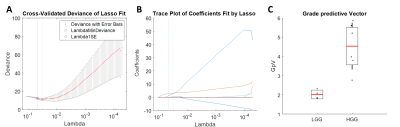
Figure 2: The least absolute shrinkage and selection operator (LASSO)
was applied to extract a composite vector - the most significant tumour grade
predictor - from 25 parameters determined by analysis of simultaneously
acquired PET and MRI data. Five-fold cross-validation was performed to select
lambda minimum to give the minimum cross-validated error (A). The
weighted sum of 3 selected features (B) gave the Grade predictive Vector
GpV, which showed an AUC and accuracy of 1 in the discrimination between low
and high-grade gliomas (C).
-
Identification of IDH1 mutation status in glioblastoma using multi-delay 3D arterial spin labeling perfusion MRI: a pilot study
Huilou Liang1,2, Lianwang Li3, Yuchao Liang3, Siqi Cai4, Jing An5, Yan Zhuo1,2,6, Lijuan Zhang4, Danny JJ Wang7, and Rong Xue1,2,8
1State Key Laboratory of Brain and Cognitive Science, Beijing MRI Center for Brain Research, Institute of Biophysics, Chinese Academy of Sciences, Beijing, China, 2University of Chinese Academy of Sciences, Beijing, China, 3Department of Neurosurgery, Beijing Tiantan Hospital of Capital Medical University, Beijing, China, 4Shenzhen Institutes of Advanced Technology, Chinese Academy of Sciences, Shenzhen, China, 5Siemens Shenzhen Magnetic Resonance Ltd, Shenzhen, China, 6CAS Center for Excellence in Brain Science and Intelligence Technology, Chinese Academy of Sciences, Beijing, China, 7Mark & Mary Stevens Neuroimaging and Informatics Institute, Keck School of Medicine, University of Southern California, Los Angeles, CA, United States, 8Beijing Institute for Brain Disorders, Beijing, China
In
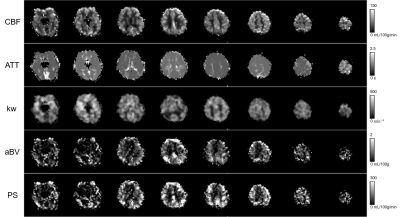
this study, we applied multi-delay 3D ASL with multi-parametric perfusion maps in
GBM patients. Our results show that aCBV based relative perfusion parameters
may provide a better performance in predicting IDH1 mutation status and is
worthy of further verification in future studies.
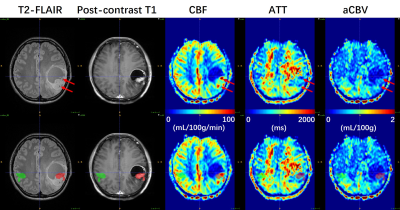
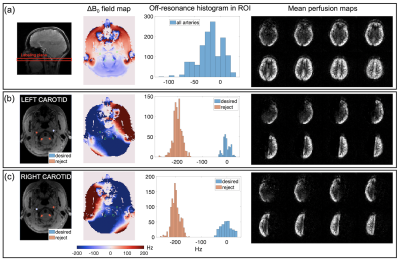
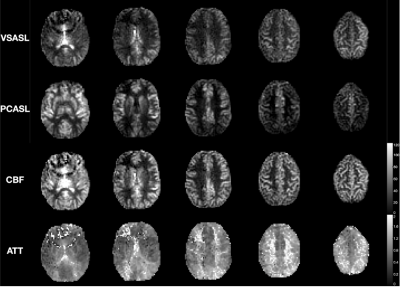
Figure 1. A 32-year-old woman (Patient #2) with
IDH1-mutant GBM. ROIs of tumoral (red) and mirrored
(green) regions were manually drawn on T2-FLAIR image referring to contrast-enhancing
regions in post-contrast T1 image, and successively overlaid
onto multi-parametric perfusion maps (lower row) to measure the maximum and
mean values within ROIs. As indicated by red arrows, the CBF map shows
obviously high values in regions of large vessels (confirmed by low ATT values)
within tumor found in T2-FLAIR image, whereas the aCBV map doesn’t display elevated
perfusion.
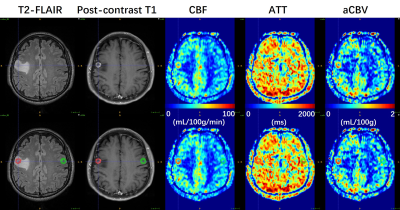
Figure 2. A 57-year-old man (Patient #4) with
IDH1-wild type GBM. ROIs of tumoral (red) and mirrored (green) regions were
manually delineated on T2-FLAIR image and overlaid onto multi-parametric
perfusion maps (lower row). Ring-enhancing lesions in post-contrast T1 image are
coincident with ring-like regions with hyper-perfusion in CBF and aCBV maps.
Prolonged ATT values especially in the occipital region are observed.
-
Intrasession reliability of arterial spin labeled MRI measured perfusion in GBM at 3T
Limin Zhou1, Yiming Wang1, Marco Da Cunha Pinho1,2, Edward Pan3,4,5, Yin Xi1,6, Joseph A Maldjian1,2, and Ananth J Madhuranthakam1,2
1Department of Radiology, University of Texas Southwestern Medical Center, Dallas, TX, United States, 2Advanced Imaging Research Center, University of Texas Southwestern Medical Center, Dallas, TX, United States, 3Department of Neurology and Neurotherapeutics, University of Texas Southwestern Medical Center, DALLAS, TX, United States, 4Department of Neurological Surgery, University of Texas Southwestern Medical Center, DALLAS, TX, United States, 5Harold C. Simmons Cancer Center, University of Texas Southwestern Medical Center, DALLAS, TX, United States, 6Department of Population and Data Sciences, University of Texas Southwestern Medical Center, Dallas, TX, United States
In this study, we compared the 3D TSE-CASPR measured perfusion with clinically available 3D GraSE in GBM patients at 3T. The results
showed that 3D pCASL with TSE-CASPR is more robust to B0 inhomogeneities and
has higher intrasession reliability than the clinical sequence, 3D pCASL with
GraSE.
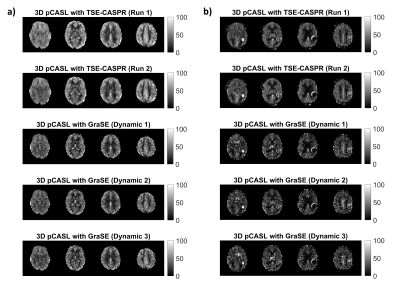
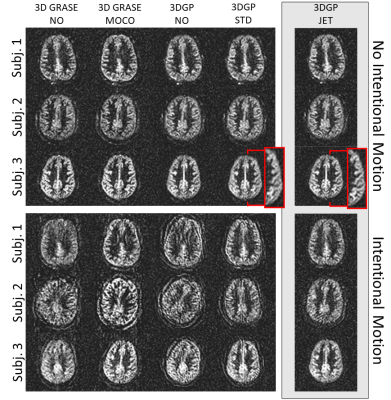
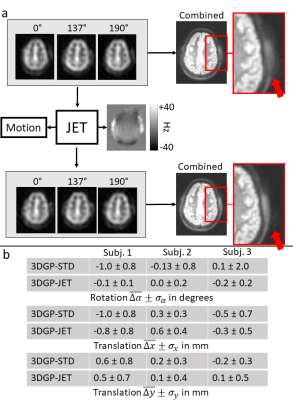
Figure 1. Two runs of
3D pCASL with TSE-CASPR and three dynamics of 3D pCASL with GraSE in a 26-year old healthy
volunteers (a) and a 71-year old GBM patient (b).
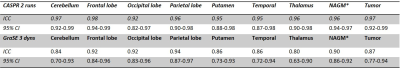
Table 1. Intraclass correlation coefficient (ICC) and its 95%
confidence interval (CI) for 2 runs of 3D pCASL with TSE-CASPR and 3 dynamics
of 3D pCASL with GraSE.
-
The feasibility of 3D pcASL MRI with Multiple post-labeling delay times in evaluating subtypes of parotid gland tumors
Lu Chen1, Guo-Yi Su1, Weiqiang Dou2, Yong Shen3, Fei-Yun Wu1, and Xiao-Quan Xu1
1Radiology, The First Affiliated Hospital of Nanjing Medical University, Nanjing, China, 2GE Healthcare, MR Research China, Beijing, P.R. China, Beijing, China, 3GE Healthcare, MR Enhanced Application China, Beijing, P.R. China, Beijing, China
3D pcASL MRI, especially with short PLD was suggested to evaluate patients with parotid gland tumors in routine clinical practice.
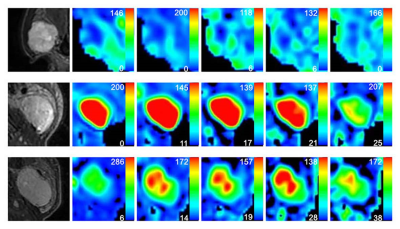
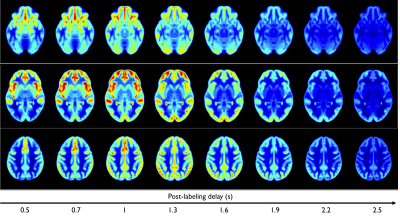
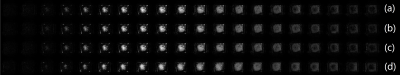
Figure 2. Representative images of PA (A-F), WT (J-L) and squamous cell carcinoma (M-R). The first column was the fat-suppressed T2-weighted image (A, J, M). The second (B, H, N), third (C, I, O), fourth (D, J, P), fifth (E, K, Q) and sixth (F, L, R) columns were TBF maps at different PLDs (PLD=1025ms, 1525ms, 2025ms, 2525ms, 3025ms), respectively. WT (H-L) showed relatively highest TBF, followed by squamous cell carcinoma (N-R) and PA (B-F). The unit of TBF is ml/100g/min. TBF= tumor blood flow; PLDs= post-labeling delay times; PAs= pleomorphic adenomas; WTs= warthin’s tumors.
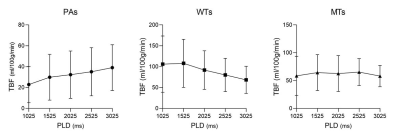
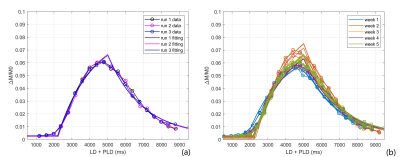
Figure 1. Line graphs showing the changes of TBF at different PLDs. TBF= tumor blood flow; PLDs= post-labeling delay times; PAs= pleomorphic adenomas; WTs= warthin’s tumors; MTs= malignant tumors.
-
Robust Implementation of a 3D Pulsed ASL Sequence for Assessment of Liver Perfusion
Jörn Huber1, Daniel Hoinkiss1, and Matthias Günther1,2
1Fraunhofer MEVIS, Bremen, Germany, 2University of Bremen, Bremen, Germany
Arterial Spin Labeling (ASL) allows non-invasive assessment of liver perfusion. However, breathing motion, low perfusion rates and off-resonance are challenges in liver ASL. In this work, a robust implementation for a pulsed ASL sequence using 3D GRASE is given, addressing these challenges.
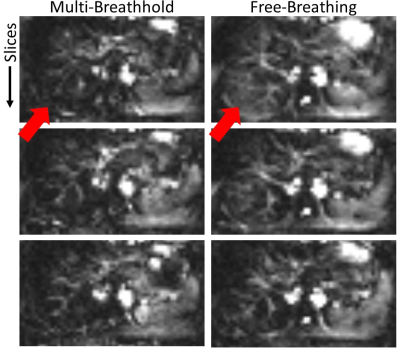
Figure 5: Perfusion weighted images using background suppression with two inversion pulses and the proposed multi-breathhold acquisition scheme and a free-breathing acquisition respectively. Arrows indicate areas with subtraction errors under free-breathing which are likely misinterpreted as perfusion signal.
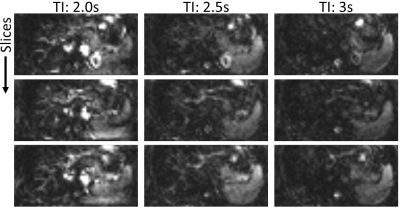
Figure 3: Three exemplary slices of perfusion-weighted images using two inversion pulses and different inflow times TI.
-
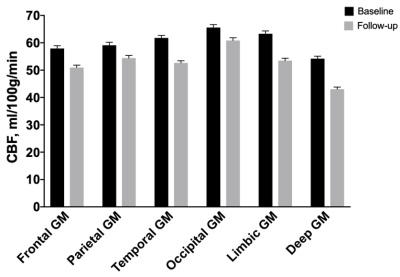
Depicting the developmental trajectories of brain cerebral blood flow using 3D ASL in children aged 28 days to 15 years.
Peiyao Chen1, Chao Jin1, Xianjun Li1, Miaomiao Wang1, Congcong Liu1, Xiaoyu Wang1, Fan Wu1, Yuli Zhang1, Cong Tian1, Mengxuan Li1, Xiaocheng Wei2, and Jian Yang1
1First Affiliated Hospital of Xi 'an Jiaotong University, Xi'an, Shaanxi, China, 2MR Research China, GE Healthcare, Beijing, China
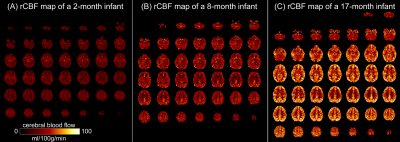
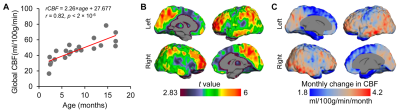
The
estimated age with highest cerebral blood flow is earliest in the occipital
lobe, followed by temporal and parietal lobe, at last in the frontal lobe. The
perfusion of basal ganglia shows a U-shaped curve, which slowly increases with
age.
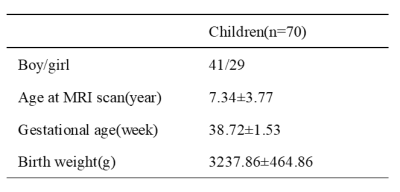
Table 1 Demographic
data Note: Mean±SD
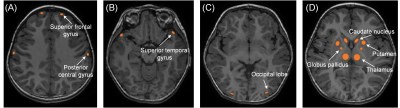
Figure
1. Manual regions of interest(ROIs)were placed on the CBF map by using the
aligned anatomical image as guidance. ROI was about 20-100mm2. (A)bilateral
superior frontal gyrus and posterior central gyrus .(B)bilateral superior
temporal gyrus.(C)bilateral occipital lobe(D)basal ganglia (bilateral thalamus,
globus pallidus, putamen, caudate nucleus )
-
Brain perfusion in dementia with Parkinson's disease and Alzheimer’s disease: an arterial spin labeling MRI study
Hongri Chen1, Weiqiang Dou2, and Wei yin Liu2
1Dalian Medical University, Northern Jiangsu People’s Hospital, Yangzhou, China, Yangzhou, China, 2GE Healthcare, MR Research China, Beijing, P.R. China, Beijing, China
The normalized cerebral blood flow (CBF) provided sensitive imaging-based markers that contribute to the differential diagnosis of the Parkinson's disease dementia (PDD) and Alzheimer’s disease (AD).
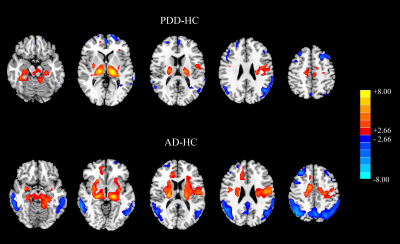
Figure 1 Results of two‐sample t‐test between dementia
patients and HC subjects. The above: PDD minus HC. The below: AD minus HC. Red color
represents the increased perfusion, while the blue color represents the
decreased perfusion (PFWE < 0.001).
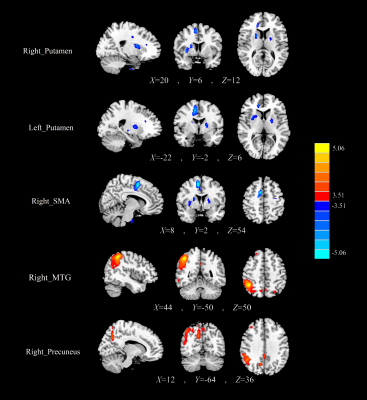
Figure
2 The normalized CBF differences between the PDD patients and the AD patients.
Compared with AD, the PDD patients showed decreased CBF in the bilateral putamen
and right SMA, as well as increased CBF in the right MTG, and right precuneus.
-
Relationship between global grey matter perfusion, damage and disability in multiple sclerosis
Daniele Mascali1, Antonio Maria Chiarelli1, Ilona Lipp2,3, Anna Digiovanni4, Valentina Tomassini1,3,4, and Richard Geoffrey Wise1,3
1Institute for Advanced Biomedical Technologies,Department of Neuroscience, Imaging and Clinical Sciences, "G. D'Annunzio University" of Chieti-Pescara, Chieti, Italy, 2Department of Neurophysics, Max Planck Institute for Human Cognitive and Brain Sciences, Leipzig, Germany, 3Cardiff University Brain Research Imaging Centre (CUBRIC) School of Psychology, Cardiff University, Cardiff, United Kingdom, 4MS Centre, Neurology Unit, SS. Annunziata University Hospital, Chieti, Italy
We found that a reduced global grey matter hypo-perfusion
in multiple sclerosis patients is associated with greater tendency to develop
irreversible tissue damage and with worse clinical scores.
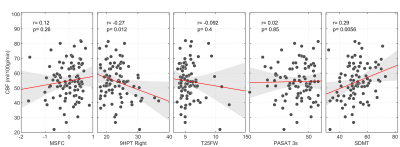
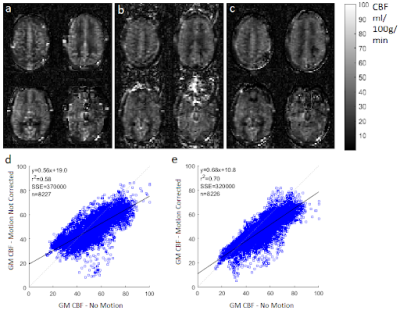
Figure 3. Scatter plots of
median GM CBF vs. clinical and cognitive
scores. R and p-values are obtained via Pearson’s correlation.
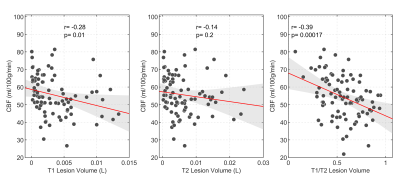
Figure 2. Scatter plots of median grey matter CBF vs. white matter lesion volumes, as
assessed by T1-weighted (left panel) or T2-weighted (central panel) images. The
right panel shows the correlation between CBF and the T1/T2 volume ratio. R and
p-values are obtained via Pearson’s correlation.
-
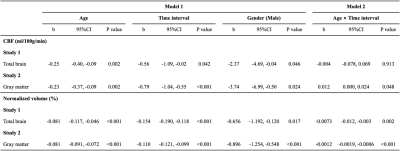
ASL perfusion and disability in primary progressive MS: an observational cohort study
Clara Delacour1, Ahmed-Ali El Ahmadi1, Gilles Brun1, Nadine Girard1,2, Christoph Heesen3,4, Arzu Ceylan Has3,4, and Jan-Patrick Stellmann2,3,4,5
1Neuroradiology, APHM La Timone, Marseille, France, 2Aix-Marseille Univ, CNRS, CRMBM, UMR 7339, Marseille, France, 3Institute of Neuroimmunology and MS (INIMS), University Medical Centre Hamburg-Eppendorf, Hamburg-Eppendorf, Germany, 4Neurology, University medical centre Hamburg-Eppendorf, Hamburg-Eppendorf, Germany, 5APHM La Timone, CEMEREM, Marseille, France
We notice no relevant change of brain perfusion over up to five years
in primary progressive MS population cohort (77 patients). An association between higher regional perfusion rates and cognitive
performance and hand functioning has been highlighted.
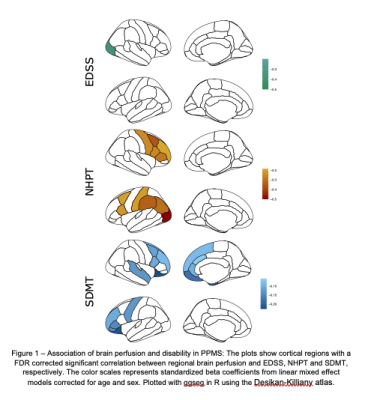
Figure 1
-
Reliability of Arterial Spin Labeling derived Cerebral Blood Flow measurements in Periventricular White Matter
Sudipto Dolui1, Audrey P. Fan2,3, Moss Y. Zhao3, Greg Zaharchuk3, and John A. Detre1,4
1Department of Radiology, University of Pennsylvania, Philadelphia, PA, United States, 2Departments of Biomedical Engineering and Neurology, University of California, Davis, CA, United States, 3Department of Radiology, Stanford University, Palo Alto, CA, United States, 4Department of Neurology, University of Pennsylvania, Philadelphia, PA, United States
Cerebral blood flow in periventricular white matter measured using state-of-the-art arterial spin labeling showed high intra-session reproducibility and correlated with measurements from concurrently acquired [15O]-water PET, demonstrating it can be measured reliably.
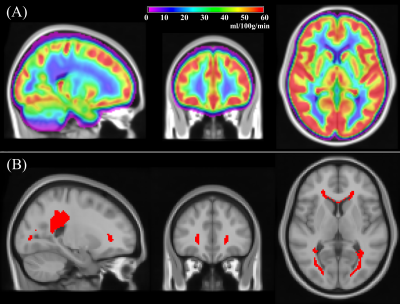
Figure 1: (A) Group averaged CBF obtained from 436 subjects (age=50.4±3.5 years, 54% female) from the NHLBI Coronary Artery Risk Development in Young Adults (CARDIA) study; (B) A periventricular white matter (PVWM) region of interest (ROI) obtained by thresholding the group averaged map in (A) to CBF<12.5ml/100g/min.
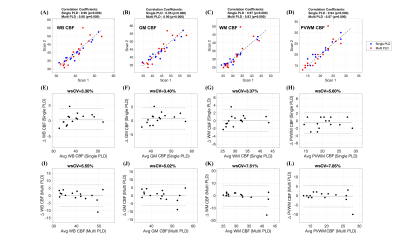
Figure 2: (A)-(D): Scatter plots comparing the (A) whole brain (WB), (B) gray matter (GM), (C) white matter (WM) and (D) periventricular WM (PVWM) CBF obtained from the two sessions using single-PLD (shown in blue) and multi-PLD (shown in red) ASL. The black lines correspond to the unity line and the titles show the correlation coefficients. (E)-(H) and (I)-(L) show Bland-Altman Plots corresponding to (E & I) WB CBF, (F & J) GM CBF, (G & K) WM CBF and (H & L) PVWM CBF using the two sessions of single and multi-PLD data respectively. The wsCV values are in the titles of the plots.
-
Reduced Cerebral Blood Flow in Patients with Pulmonary Arterial Hypertension
Bhaswati Roy1, Susana Vacas1, Kathy McCloy2, Rajan Saggar2, and Rajesh Kumar1,3,4,5
1Anesthesiology, University of California Los Angeles, Los Angeles, CA, United States, 2Medicine, University of California Los Angeles, Los Angeles, CA, United States, 3Bioengineering, University of California Los Angeles, Los Angeles, CA, United States, 4Radiological Sciences, University of California Los Angeles, Los Angeles, CA, United States, 5Brain Research Institute, University of California Los Angeles, Los Angeles, CA, United States
PAH
patients show cognitive and mood deficits, and brain changes in those sites. However,
the underlying cause of tissue damage in PAH patients remain unclear. We show
reduced regional CBF in PAH patients over controls, and correlations between CBF
and functional deficits in the condition.
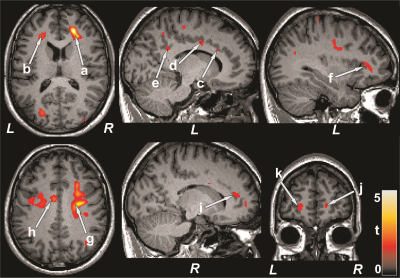
Figure 1: Brain regions with reduced CBF in PAH patients over
control subjects. The sites with reduced CBF in PAH patients included the
bilateral frontal white matter (a, b), left anterior (c), mid (d), and
posterior (e), and right anterior (i) cingulate, left insula (f), bilateral corona
radiata (g, h), and bilateral prefrontal cortices (j, k). All images are in
neurological convention (L = left; R = right). Color bar indicates t-statistic
values.
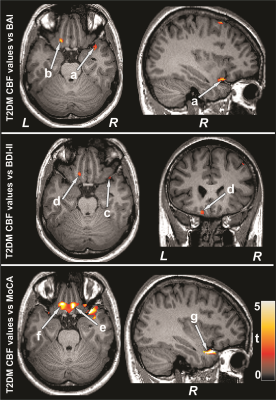
Figure 2: Negative correlations emerged between CBF and mood symptoms
and positive associations between cognition and CBF in PAH patients. Correlations
appeared between mood scores and CBF values of the right insula (a, c), and left
basal forebrain (b, d), and between MoCA scores and CBF values of the bilateral
basal forebrain (e, f) and right insula (g). Figure conventions are same as in
Figure 1.
-
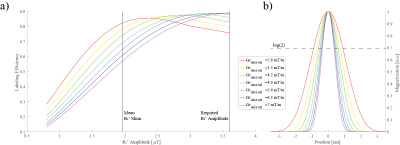
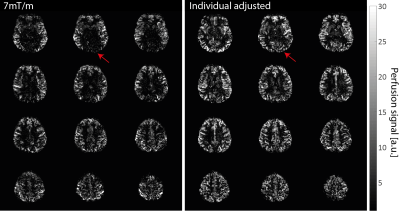
Moving Towards Robust Quantification of Cerebrovascular Reactivity (CVR) using Pseudocontinuous Arterial Spin Labelling (pCASL)
Colette C. Milbourn1, Thomas W. Okell2, and Nicholas P. Blockley1
1The School of Life Sciences, University of Nottingham, Nottingham, United Kingdom, 2Wellcome Centre for Integrative Neuroimaging, FMRIB, Nuffield Department of Clinical Neurosciences, University of Oxford, Oxford, United Kingdom
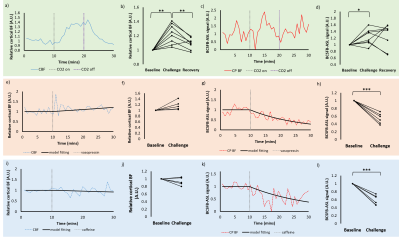
Cerebrovascular reactivity measured with Pseudocontinuous Arterial Spin Labelling (pCASL) systematically varies with different pCASL preparation parameters due to changes in blood velocity in the internal carotid and vertebral arteries.
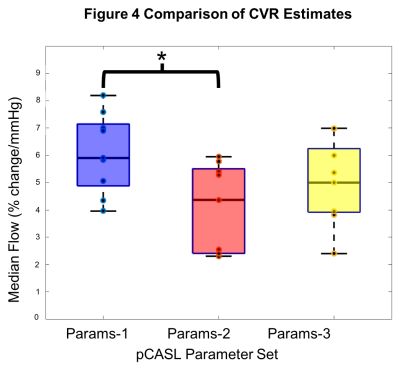
Figure 4 Comparison of CVR estimates. Box plots shows the median cerebrovascular reactivity (CVR) for each of the three pCASL (pseudocontinuous Arterial Spin Labelling) Parameter sets. CVR is the percentage change in cerebral blood flow per mmHg partial pressure of end-tidal carbon dioxide (PetCO2).
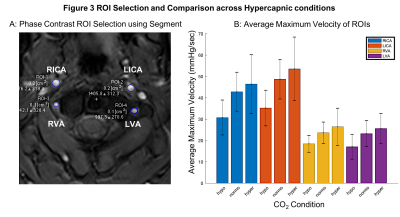
Figure 3 ROI Selection and Blood Velocity Results. A: Phase contrast velocity region of interest (ROI) selection of left/right (L/R) internal carotid arteries (ICA) and vertebral arteries (VA). B: Average maximum velocity of feeding arteries (N=9, F=4, mean±s.d.) at three carbon dioxide (CO2) levels: hypocapnia (hypo, -10mmHg below baseline), normocapia (normo) and hypercapnia (hypo, +10mmHg above baseline).
-
Arterial Spin Labeling Can Identify Cerebrovascular Reactivity Deficit in Patients with Vasculopathy: A Pilot Study Using Simultaneous PET/MRI
Moss Y Zhao1, Audrey P Fan2, David Chen3,4, Jia Guo5, Yosuke Ishii6, David Shin7, Mohammad Mehdi Khalighi1, Dawn Holley1, Kim Halbert1, Andrea Otte1, Brittney Williams1, Jun-Hyung Park1, Bin Shen1, Gary Steinberg8, and Greg Zaharchuk1
1Radiology, Stanford University, Stanford, CA, United States, 2Biomedical Engineering and Neurology, University of California Davis, Davis, CA, United States, 3Medical Imaging, Taipei Medical University – Shuan-Ho Hospital, New Taipei City, Taiwan, 4Department of Radiology, School of Medicine, College of Medicine, Taipei Medical University, Taipei, Taiwan, 5Bioengineering, University of California Riverside, Riverside, CA, United States, 6Neurosurgery, Tokyo Medical and Dental University, Tokyo, Japan, 7GE Healthcare, Melo Park, CA, United States, 8Neurosurgery, Stanford University, Stanford, CA, United States
ASL is effective in measuring CVR and can become a diagnostic tool to predict the risk of stroke for vasculopathy patients.
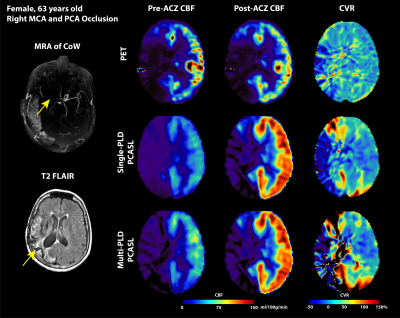
Figure 2: Structural and flow maps of an example patient. Occlusion are seen in right MCA and PCA territories in MRA of CoW and hyperintense focal spots in T2 FLAIR (marked by yellow arrows). In all PET and ASL modalities, CBF and CVR in the right MCA and PCA territories were lower than the right side.
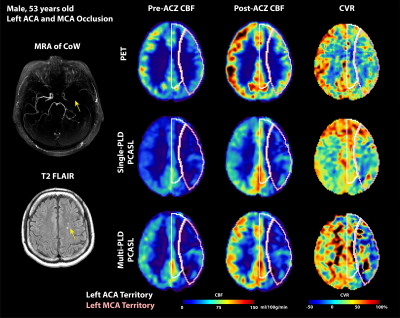
Figure 1: Structural and flow maps of an example patient. Severe stenosis and occlusion are seen in left ACA and MCA territories in MRA of CoW and hyperintense focal spots in T2 FLAIR (indicated by yellow arrows). In all PET and ASL modalities, CBF and CVR in the left ACA and MCA territories were lower than the right side.
-
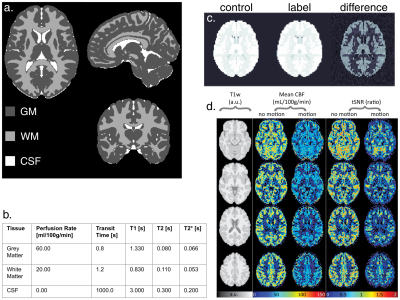
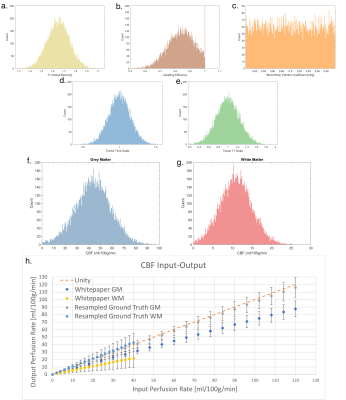
A digital brain perfusion phantom for validation of ASL data post-processing software
Chenyang Zhao1, Ze Wang2, and Danny Wang1
1Laboratory of Functional MRI Technology (LOFT), Mark & Mary Stevens Neuroimaging and Informatics Institute, University of Southern California, Los Angeles, CA, United States, 2Department of Diagnostic Radiology and Nuclear Medicine, School of Medicine, University of Maryland, Baltimore, MD, United States
This work
presented a digital brain perfusion phantom with flexible parameter settings to
achieve various ASL configurations. It provides a reliable reference to
validate ASL post-processing software.
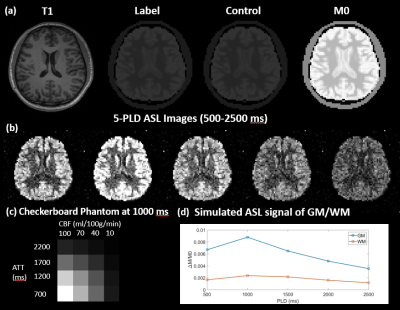
(a) A Sample slice for T1 weighted MPRAGE,
Label, Control, and M0 image. (b) A sample slice for 5-PLD ASL images. The PLD
ranges from 500 to 2500 ms with an interval of 500 ms. (c) The perfusion map of
the checkerboard phantom at PLD = 1000 that is embedded in a lower slice of the
phantom. (d) The simulated perfusion signal of GM and WM using a 5-delay 3D
pCASL protocol.
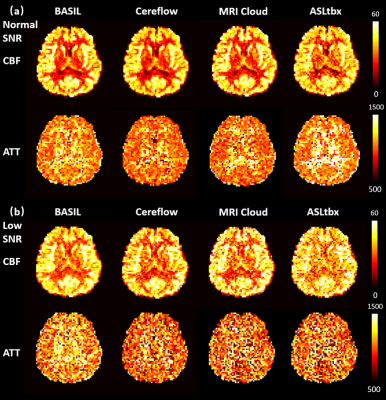
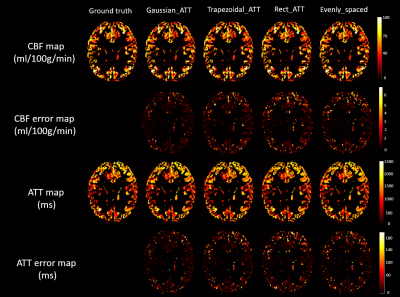
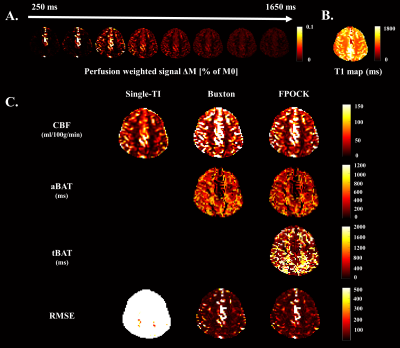
Resulted CBF (ml/100g/min) and ATT (ms) maps of
the digital realistic phantom from 4 different ASL data processing software, including
BASIL, Cereflow, MRI Cloud, and ASLtbx, under a normal SNR condition and a low
SNR condition.
-
Association of Arterial Spin Labeling Global Metrics and Attentional Processes
Shichun Chen1, Yakun Zhang1, Zongpai Zhang1, Wenna Duan1, George Weinschenk1, Brandon E. Gibb2, Wenming Luh3, and Weiying Dai1
1Department of Computer Science, State University of New York at Binghamton, Binghamton, NY, United States, 2Department of Psychology, State University of New York at Binghamton, Binghamton, NY, United States, 3National Institute on Aging, National Institutes of Health, Baltimore, MD, United States
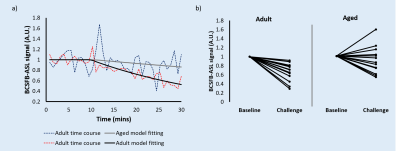
Brain global functional activity and global topology of brain networks, measured by dynamic arterial spin labeling, are associated with the P3 properties obtained from event-related potentials, indicating close correlation of brain global activity/connection efficiency and attention.
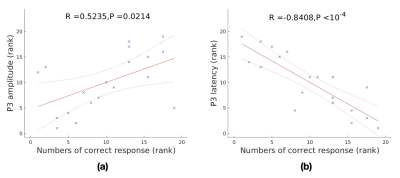
Fig. 1. Relationship between the P3 parameters and numbers of correct response. (a) rank correlation of between P3 amplitude and numbers of correct response. (b) rank correlation between P3 amplitude and numbers of correct response
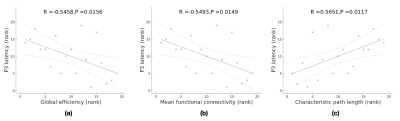
Fig. 3. Relationship between P3 latency and global topology of brain networks. (a) significant rank correlation between P3 latency and global efficiency. (b) significant rank correlation between P3 latency and mean function connectivity. (c) significant rank correlation between P3 latency and characteristic path length.
-
Mapping water exchange rate change after caffeine uptake using 3D diffusion prepared arterial spin labeled perfusion MRI
Qihao Zhang1, Jana Ivanidze2, Thanh Nguyen2, Pascal Spincemaille2, and Yi Wang1
1Cornell University, New York, NY, United States, 2Weill Cornell Medical College, New York, NY, United States
A 13% decrease in water exchange rate (kw) is observed after caffeine uptake, captured by a newly developed kw mapping sequence using arterial spin labeling (ASL) technique.
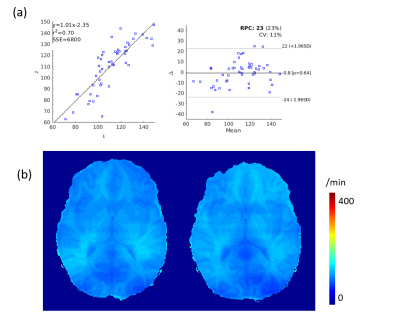
(a) Bland Altman plot of the selected 10 brain regions of the 5 subjects. (b) The test-retest for kw of a subject.
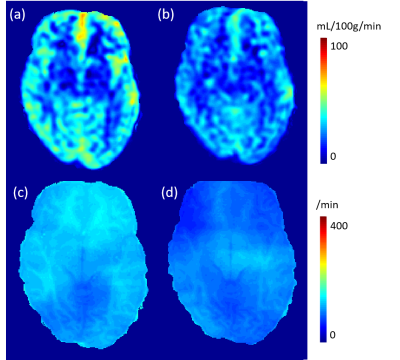
(a) and (c) CBF and kw maps before caffeine uptake. (b) and (d) CBF and kw maps after caffeine uptake. Averaged in whole brain, a 26% decrease in CBF and 13% decrease in kw are observed.
-
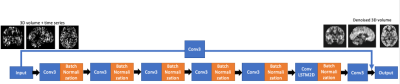
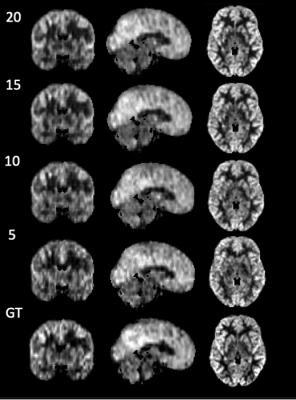
High spatio-temporal resolution 3D ASL renal perfusion with variable-density FSE and deep-learning reconstruction
Manuel Taso1, Uri Wollner2, Arnaud Guidon3, Rafi Barda2, Christopher J Hardy4, Sangtae Ahn4, and David C Alsop1
1Division of MRI research, Department of Radiology, Beth Israel Deaconess Medical Center, Harvard Medical School, Boston, MA, United States, 2GE Research, Herzliya, Israel, 3Global MR Applications and Workflow, GE Healthcare, Boston, MA, United States, 4GE Research, Niskayuna, NY, United States
Arterial spin labeling (ASL) has proven to be a powerful research and clinical technique for functional imaging of tissues. This work explores the feasibility and performance of Deep-Learning based reconstruction for fast volumetric perfusion imaging with ASL.
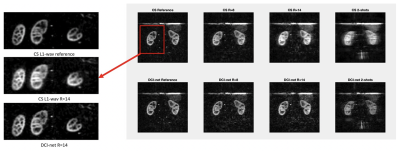
Figure 2 – comparison between L1-wavelet CS and DCI-net reconstructions at various rates
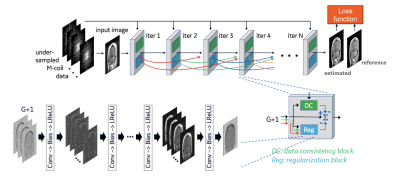
Figure 1 – Illustration of the architecture of DCI-Net with 2D convolution.
-
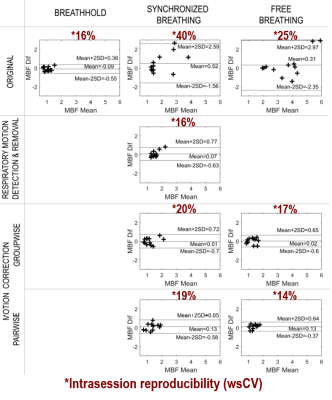
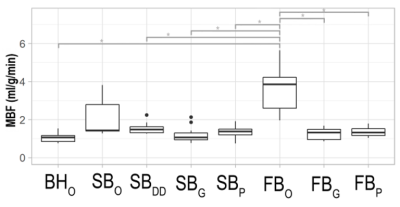
Reproducibility of multiparametric MRI in transplanted kidneys
Rebeca Echeverria-Chasco1,2, Marta Vidorreta3, Veronica Aramendia-Vidaurreta2,4, David Cano 1, Gorka Bastarrika2,4, Nuria Garcia-Fernandez2,5, Paloma L. Martin Moreno2,5, and Maria A. Fernandez-Seara2,4
1Radiology, Clínica Universidad de Navarra, Pamplona, NE, Spain, 2IdiSNA, Instituto de Investigación Sanitaria de Navarra, Pamplona, Spain, 3Siemens Healthineers, Madrid, Spain, 4Radiology, Clínica Universidad de Navarra, Pamplona, Spain, 5Nephrology, Clínica Universidad de Navarra, Pamplona, Spain
Reproducibility of multiparametric MRI (perfusion, diffusion and T1 mapping) was assessed in renal allograft

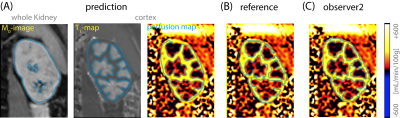
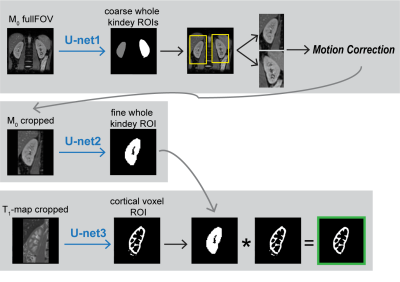
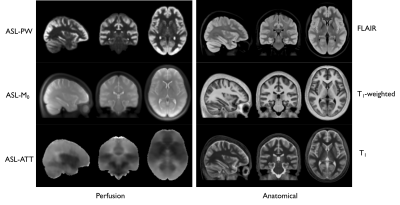
Figure 1: Example of multiparametric MRI maps acquired during
the two MRI exams: arterial spin labeling perfusion maps, diffusion coefficient
(D) maps, pseudo-diffusion coefficient (D*) maps, perfusion fraction maps
and longitudinal relaxation (T1) maps.
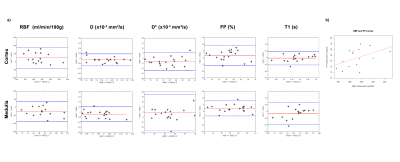
Figure 2: a) Bland-Almant plots for the RBF (ml/min/100g), D (×10−3 mm2/s), D* (×10−3 mm2/s), PF (%) and T1 (ms) calculated in the cortex and in the medulla. b) Correlation between cortical mean values of renal blood flow and perfusion fraction averaged for the two exams, with a correlation coefficient r = 0.47.
-
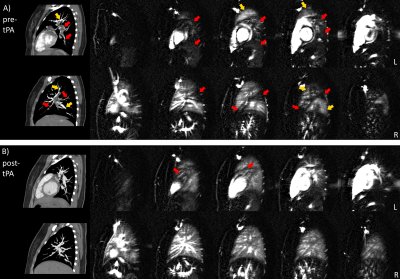
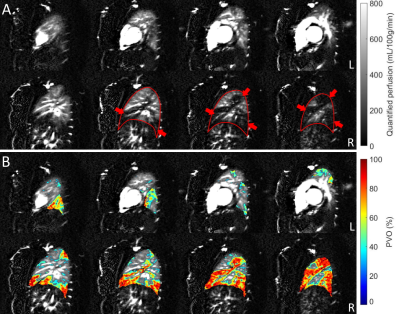
Measurement of Pulmonary Perfusion under Expiratory and Inspiratory Breathing Conditions using PCASL-bSSFP Imaging at 1.5 Tesla
Petros Martirosian1, Rolf Pohmann2, Martin Schwartz1,3, Thomas Kuestner4, Manuel Kolb4, Ahmed Othman4, Cecilia Zhang4, Klaus Scheffler2,5, Konstantin Nikolaou4, Fritz Schick1, and Ferdinand Seith4
1Section on Experimental Radiology, University of Tübingen, Tübingen, Germany, 2Max Planck Institute for Biological Cybernetics, Tübingen, Germany, 3Institute of Signal Processing and System Theory, University of Stuttgart, Stuttgart, Germany, 4Department of Diagnostic and Interventional Radiology, University of Tübingen, Tübingen, Germany, 5Department of Biomedical Magnetic Resonance, University of Tübingen, Tübingen, Germany
Pseudo-continuous
arterial spin labeling (PCASL) is able to detect changes of
parenchymal lung perfusion caused by alterations of the intrathoracic
pressure. Perfusion signal measured under end-inspiratory condition was noticeably
reduced as
compared to end-expiratory breath-hold.
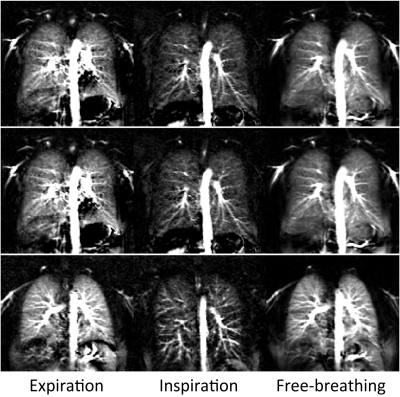
Figure
2: PCASL perfusion-weighted
images of three healthy volunteers acquired under expiratory, inspiratory and
free-breathing conditions. One pair and twelve pairs of label-control images
were measured in breath-hold and free-breathing examinations,
respectively.
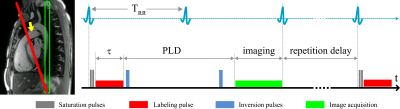
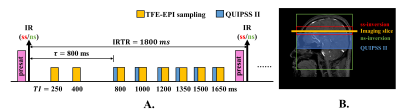
Figure
1: Spatial arrangement of
labeling and imaging planes on a sagittal image in PCASL measurements. The
labeling plane (red) was positioned nearly perpendicular to the pulmonary trunk
(yellow arrow) and images were acquired in coronal orientation (green). Time
course of ECG-triggered PCASL sequence: labeling duration (τ) was
limited to the systolic period and imaging was performed in diastole of successive
cardiac cycle by adapting post-labeling delay (PLD).
-
Prostate Perfusion Mapping using Fourier-Transform based Velocity-Selective Pulse Trains: Choice of Cutoff Velocity and Comparison with Brain
Dapeng Liu1,2, Dan Zhu3, Wenbo Li1,2, and Qin Qin1,2
1Department of Radiology, Johns Hopkins University School of Medicine, Baltimore, MD, United States, 2F.M. Kirby Research Center for Functional Brain Imaging, Kennedy Krieger Institute, Baltimore, MD, United States, 3Department of Biomedical Engineering, Johns Hopkins University School of Medicine, Baltimore, MD, United States
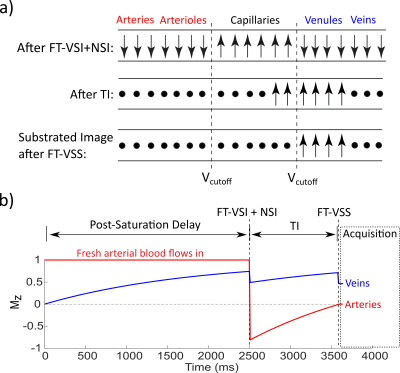
Prostate blood flow and blood volume mapping
using VSASL prepared by Fourier-transform
based velocity-selective pulse trains were compared among different cutoff
velocities (Vc). The results suggest that lower Vc of VSASL is demanded for
prostate than for brain.
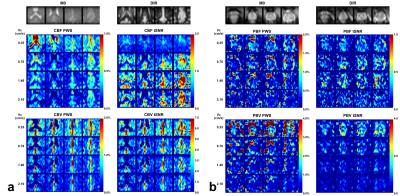
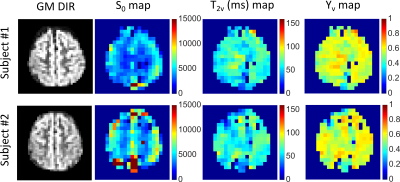
Figure 2: Brain (a) and prostate (b) PWS and corresponding
tSNR maps from one representative subject with four out of all ten slices. Both
blood flow (CBF for brain and PBF for prostate) and blood volume (CBV for brain
and PBV for prostate) maps were shown. M0
and DIR images were also shown above. Note that in the CBV PWS and tSNR images,
the CSF in leteral ventricles display dark as it has negative signal due to a
combination of long T2 values of CSF and the higher B1+ scale at the center of
the brain.
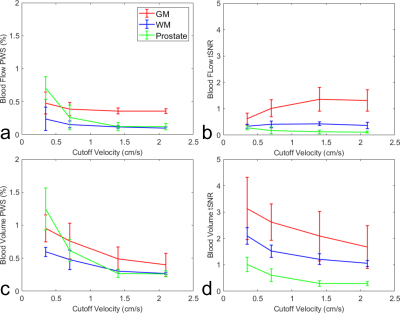
Figure 4: Averaged
blood flow PWS (a) and its tSNR (b), blood volume PWS (c) and its tSNR (d), in
ROIs of GM, WM and prostate from four subjects.