-
Application of QSM in SPIO - labeled stem cell transplantation in Beagles with acute spinal cord injury
Junting Zou1, Jilei Zhang2, Zhao Xiance2, Yuanyuan Xie1, Bing Zhang1, and Xiaoli Mai1
1Nanjing Drum Tower Hospital, Nanjing, China, 2Philips Healthcare, Shanghai, China
The SPIO-huc-MSCs are traced in vivo for 28 days by T2*WI. By quantifying iron concentration, QSM technology can be used to dynamically trace SPIO labeled stem cells in vivo.
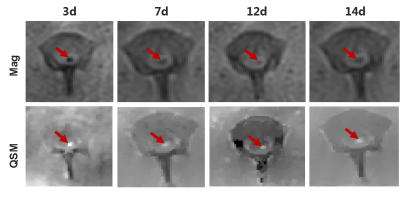
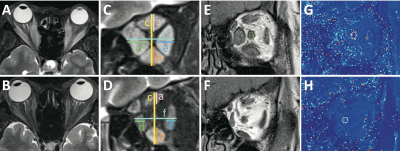
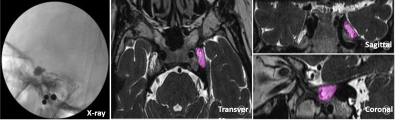
FIG. 4. QSM image of SPIO.Mag: Amplitude map, in which nano-iron oxide is black; QSM: The post-processed susceptibility distribution diagram, in which nano-iron oxide is white. We observed characteristic SPIO signals in the T2* hypointense signal region.
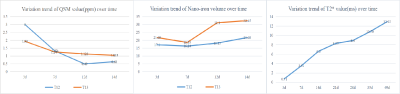
FIG. 5. Trend graphs of T2* values and susceptibility values changing over time.The susceptibility values per unit pixel decrease with time, and the total volume of iron increases with time. The T2* values also show a trend of increasing with time.
-
Neurometabolic Analysis in Amyotrophic Lateral Sclerosis: A 1H-[13C]-NMR investigation
Dipak Roy1 and Anant Bahadur Patel1
1NMR Microimaging and Spectroscopy Facility, Centre for Cellular and Molecular Biology, Hyderabad, India
In this study, we investigated the
neurometabolic and astroglial activity in the SOD1G37R mouse model
of ALS. Our findings suggest reduced neuronal and increased astroglial activity
in the spinal cord. However, the activities of astroglia and neurons were elevated
in the cerebral cortex.
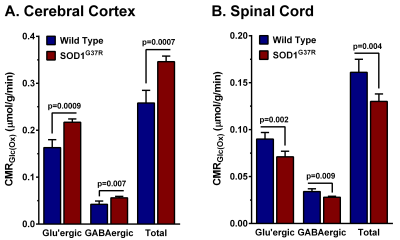
Figure 3: Cerebral Metabolic rates of glucose oxidation (CMRGlc(Ox))
in A. Cerebral cortex and B. Spinal cord. The
bar graph represents the mean±SD of the group.
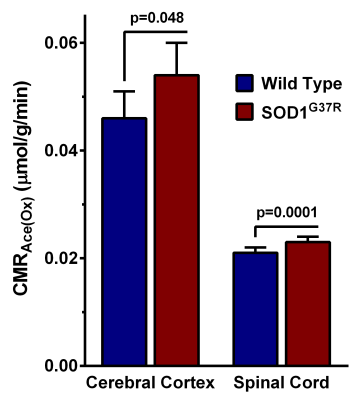
Figure 4: Cerebral Metabolic rates of acetate oxidation (CMRAce(Ox))
in A. Cerebral cortex and B. Spinal cord. The
bar graph represents the mean±SD of the group.
-
3D-MP2RAGE T1 mapping to characterize regional cervical spinal cord impairments in ALS and MS patients.
Samira Mchinda1,2, Sarah Demortière3, Henitsoa Rasoanandrianina4, Claire Costes1,2, Jean Pelletier2,5, Shahram Attarian6, Aude-Marie Grapperon6, Bertrand Audoin2,5, Annie Vershueren6, and Virginie Callot1,2
1Aix-Marseille Univ, CNRS, CRMBM, Marseille, France, 2APHM, Hôpital Universitaire Timone, CEMEREM, Marseille, France, 3APHM, Hôpital Universitaire Timone, Neurology Department, Marseille, France, 4Departement of Research and Innovation, Olea Medical, La Ciotat, France, 5. APHM, Hôpital Universitaire Timone, Neurology Department, Marseille, France, 6APHM, Hôpital Universitaire Timone, Reference Center for Neuromuscular Disorders and ALS, Marseille, France
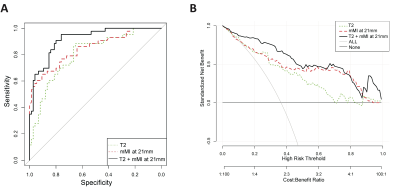
A 3D-MP2RAGE sequence previously optimized for 3T cervical cord imaging was applied for the first time to patients with MS and ALS, and their controls. Robust, allowing for cord CSA measurements, and potential specificity to disease, the MP2RAGE may be a technique of choice for clinical studies.
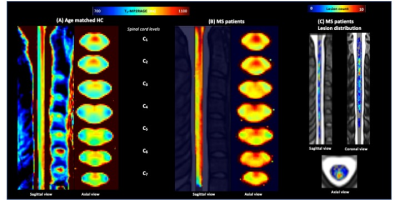
Fig.5: Mean normal appearing T1-MP2RAGE map calculated over all MS patients (B) (after lesion filling) and age matched HC (A) in the PAM50 space and lesion distribution map (C). T1 values in NA tissues were statistically higher in MS patients (NAWM= 969±64/NAGM=970±47ms) as compared to HC_MS (902±22 and 939±21). Impairments were more particularly marked in NAaiGM in the upper cervical levels and in the whole WM, especially in CST/LST (p<0.0001).
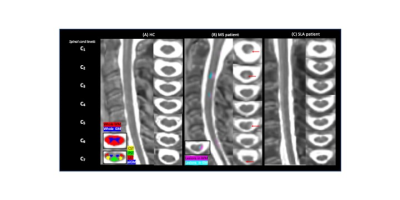
Fig.2: Representative T1-MP2RAGE maps obtained on HC (A), MS (B) and ALS (C) and the selected ROIs. For the MS patient, red arrows point on GM/WM lesions
-
Interpreting a machine learning model: radiomics in cervical spondylotic myelopathy postoperative recovery prediction
Mengze Zhang1, Hanqiang Ouyang1, Dan Jing1, Jiangfang Liu1, Chunjie Wang1, Huishu Yuan1, and Liang Jiang1
1Peking University Third Hospital, Beijing, China
Radiomics features are potential indicators
for predicting CSM patients’ postoperative recovery. The run variance was the
most important feature in the radiomic-feature-based model.
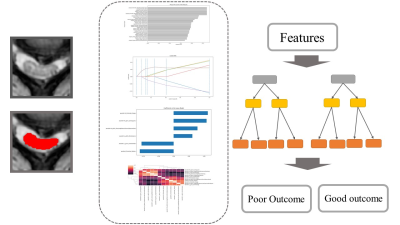
Fig 1. The pipeline of segment, normalization, scaling, feature extraction, feature selection, and model building.
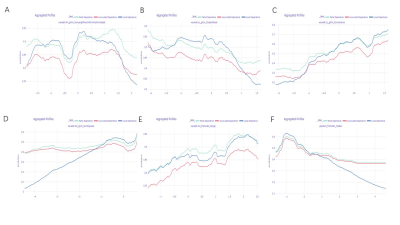
Fig 4. The partial dependence plots, the local dependence plots, and the accumulated dependence plots for each feature.
-
Characterizing 1-Year Development of Cervical Cord Atrophy Across Different MS Phenotypes: A Voxel-Wise, Multicenter Analysis
Paola Valsasina1, Maria A. Rocca1,2,3, Claudio Gobbi4,5, Chiara Zecca4,5, Alex Rovira6, Xavier Montalban7, Hugh Kearney8, Olga Ciccarelli8, Lucy Matthews9, Jacqueline Palace9, Antonio Gallo10, Alvino Bisecco10, Achim Gass11, Philipp Eisele11, and Massimo Filippi1,2,3,12,13
1Neuroimaging Research Unit, Division of Neuroscience, IRCCS San Raffaele Scientific Institute, Milan, Italy, 2Neurology Unit, IRCCS San Raffaele Scientific Institute, Milan, Italy, 3Vita-Salute San Raffaele University, Milan, Italy, 4Multiple Sclerosis Center, Department of Neurology, Neurocenter of Southern Switzerland, Civic Hospital, Lugano, Switzerland, 5Faculty of Biomedical Sciences, Università della Svizzera Italiana, Lugano, Switzerland, 6Section of Neuroradiology, Department of Radiology, Hospital Universitari Vall d’Hebron, Barcelona, Spain, 7Department of Neurology/Neuroimmunology, Multiple Sclerosis Center of Catalonia, Hospital Universitari Vall d’Hebron, Barcelona, Spain, 8NMR Research Unit, Queen Square MS Centre, Department of Neuroinflammation, UCL Institute of Neurology, London, United Kingdom, 9Nuffield Department of Clinical Neurosciences, University of Oxford, Oxford, United Kingdom, 10Department of Advanced Medical and Surgical Sciences, and 3T MRI Center, University of Campania “Luigi Vanvitelli”, Naples, Italy, 11Department of Neurology, Universitätsmedizin Mannheim, University of Heidelberg, Mannheim, Germany, 12Neurorehabilitation Unit, IRCCS San Raffaele Scientific Institute, Milan, Italy, 13Neurophysiology Service, IRCCS San Raffaele Scientific Institute, Milan, Italy
Longitudinal, voxel-wise
analysis of patients with
multiple sclerosis showed that
cervical cord atrophy progressed at 1-year follow-up, was more widespread in
relapsing-remitting MS than in other phenotypes and
predicted 1-year clinical disability.
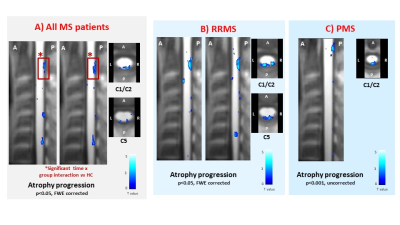
Figure 2. Sagittal and axial views at
various cervical cord levels showing clusters of significant cord atrophy progression
at 1-year follow-up (color-coded for t-values, p<0.001 for display purposes)
in: A) multiple sclerosis (MS) patients, considered as a whole; B)
relapsing-remitting (RR) MS patients; and C) progressive (P) MS patients. Red
boxes indicate clusters of cord atrophy progression significant at the time x group interaction vs HC. Abbreviations: L=left; R=right; A=anterior; P=posterior.
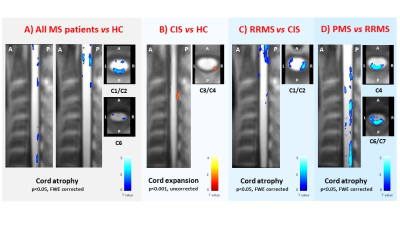
Figure 1. Sagittal and axial views at
various cervical cord levels showing clusters of significant cord atrophy
differences (color-coded for t-values, p<0.001 for display purposes) in: A)
multiple sclerosis (MS) patients, considered as a whole, vs healthy controls (HC); B) clinically isolated syndrome (CIS)
patients vs HC; C)
relapsing-remitting (RR) MS vs CIS
patients; and D) progressive (P) MS vs
RRMS patients. Abbreviations: L=left; R=right; A=anterior; P=posterior.
-
Free Water Eliminated White Matter Tract Integrity of Spinal Cord in Multiple Sclerosis and Neuromyelitis Optica Spectrum Disorder
Masaaki Hori1,2, Kouhei Kamiya1,2, Akifumi Hagiwara2,3, Kazumasa Yokoyama4, Issei Fukunaga5, Katsuhiro Sano2, Koji Kamagata2, Katsutoshi Murata6, Shohei Fujita2, Christina Andica2, Akihiko Wada2, Julien Cohen-Adad7, and Shigeki Aoki2
1Radiology, Toho University Omori Medical Center, Tokyo, Japan, 2Radiology, Juntendo University School of Medicine, Tokyo, Japan, 3Radiology, David Geffen School of Medicine, Los Angeles, CA, United States, 4Neurology, Juntendo University School of Medicine, Tokyo, Japan, 5Juntendo University School of Medicine, Tokyo, Japan, 6Siemens Japan K.K, Tokyo, Japan, 7NeuroPoly Lab, Polytechnique Montreal, Montréal, QC, Canada
Fractional anisotropy was
significant higher in spinal cord white matter in multiple sclerosis patients,
compared with Neuromyelitis optica patients using free water eliminated
kurtosis-based white matter tract integrity.
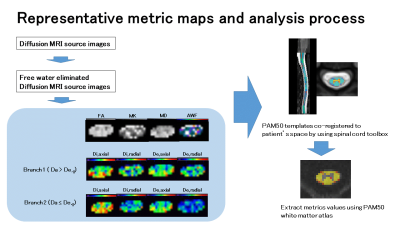
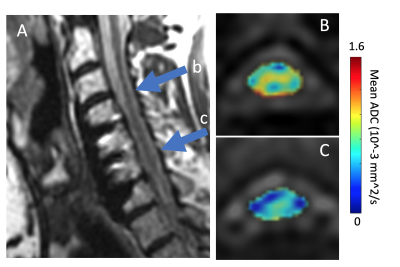
Figure1. Representative
metric maps of a case with multiple sclerosis (41-year-old woman) and analysis
process.
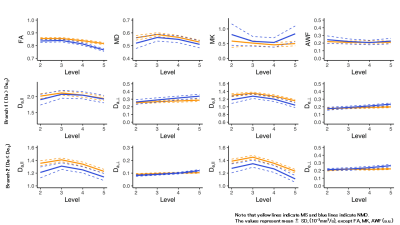
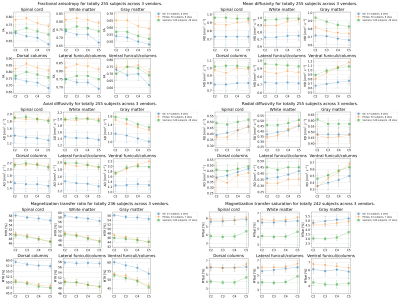
Figure
2. The results of all metrics values of white matter of spinal cords at each
spinal level in patients with MS and NMOSD.
-
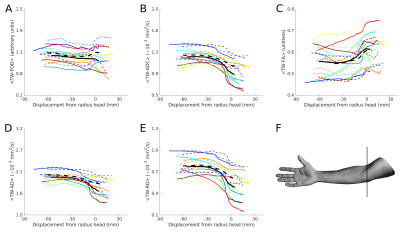
Spinal cord neurodegeneration rostral and caudal to a degenerative cervical myelopathy (DCM): a quantitative MRI study
Kevin Vallotton1, Gergely David1, Armin Curt1, Michael Fehlings2, Claudia A. M. Gandini Wheeler-Kingshott3,4,5, Rebecca S. Samson6, Julien Cohen-Adad7, Muhammad Ali Akbar2, Patrick Freund1,8,9, and Maryam Seif1
1Spinal Cord Injury Center, University Hospital Balgrist, University of Zurich, Zurich, Switzerland, Zuerich, Switzerland, 2University of Toronto Spine Program and Toronto Western Hospital, Toronto, Ontario, Canada, Toronto, ON, Canada, 3NMR Research Unit, Queen Square MS Centre, Department of Neuroinflammation, UCL Queen Square Institute of Neurology, Faculty of Brain Sciences, University College London (UCL), London, United Kingdom, 4Department of Brain and Behavioural Sciences, University of Pavia, Pavia, Italy, Pavia, Italy, 5Brain Connectivity Center Research Department, IRCCS Mondino Foundation, Pavia, Italy, 6Queen Square MS Centre, UCL Queen Square Institute of Neurology, Faculty of Brain Sciences, London, United Kingdom, London, United Kingdom, 7Functional Neuroimaging Unit, CRIUGM, University of Montreal, Montreal, QC, Canada, Montreal, QC, Canada, 8Department of Neurophysics, Max Planck Institute for Human Cognitive and Brain Sciences, Leipzig, Germany, 9Wellcome Trust Centre for Neuroimaging, UCL Institute of Neurology, London, United Kingdom
Based on T2*- and DTI-weighted MRI, similar structural changes were observed in cervical and lumbar cord of degenerative cervical myelopathy (DCM) patients. The extent of cervical and lumbar cord atrophy is associated between each other in individual DCM patients.
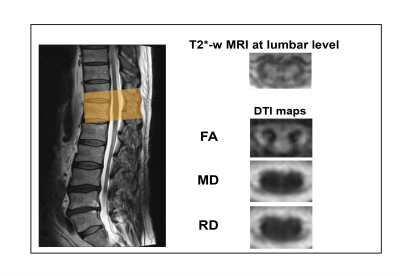
Figure 1. MRI protocol including T2*-weighted images and Diffusion Tensor-derived maps as conducted at the lumbar enlargement level (T11-L1).
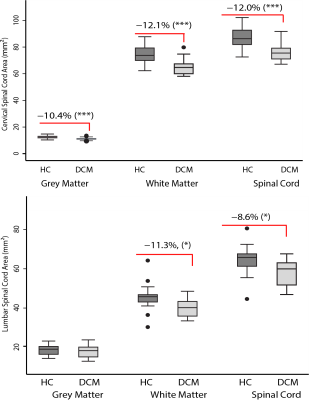
Figure 2. Box plots of cross-sectional areas of total spinal cord, grey and white matter areas in the cervical cord (at C2/3 level) and in the lumbar enlargement (at level T11-L2) of both DCM patients and healthy controls. ***p<0.001, *p<0.05.
-
Feasibility of cervical spinal cord cross-sectional measurements from 3D T1w sagittal head MRI at 7T
Vanessa Wiggermann1, Henrik Lundell1, Mads Alexander Just Madsen1, Christopher Fugl Madelung1, and Hartwig Roman Siebner1,2,3
1Danish Research Centre for Magnetic Resonance, Centre for Functional and Diagnostic Imaging and Research, Copenhagen University Hospital Hvidovre, Hvidovre, Denmark, 2Dept. of Neurology, Copenhagen University Hospital Bispebjerg, Copenhagen, Denmark, 3Institute for Clinical Medicine, Faculty of Medical and Health Sciences, University of Copenhagen, Copenhagen, Denmark
We showed that automated spinal cord measurements in healthy controls, multiple sclerosis and Parkinson’s patients at 7T are consistent between segmentation tools and with 3T data, if images with similar voxel sizes are used. At higher spatial resolution, smaller area estimates are obtained.
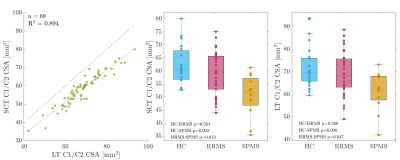
Figure 2: Comparison of average CSA measurements at the C1/C2 level using SCT and the in-house technique (LT). Although SCT generally obtained lower CSA measurements, the relative reproducibility of CSA was very high, both on an individual level (see left regression of individual data) and on a group level (compare middle and right). Statistical analysis involved a non-parametric Kruskal-Wallis test with post-hoc multiple comparison correction by Tukey-Kramer. P-values are uncorrected for testing both SCT and LT.
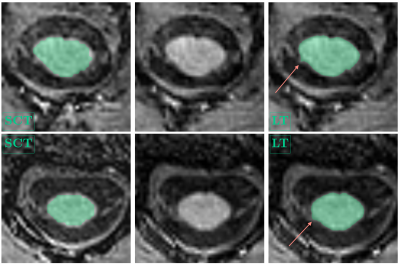
Figure 1: Example spinal cord segmentations at the C1/C2 level, SCT (left), LT (right). MPRAGE images without overlaid segmentation are shown for reference in the center. For display purposes, the SCT segmentations were upsampled to the LT standard and slices were visually matched. Arrows point toward partial segmentation of spinal nerve roots. For subject 1, (top row, female, RRMS, 33 years), mean SCT-CSA was 65.04 mm2, compared to LT-CSA=74.03 mm2. For subject 2, (bottom row, female, HC, 42 years), mean SCT-CSA was 53.49 mm2, compared to LT-CSA=61.26 mm2.
-
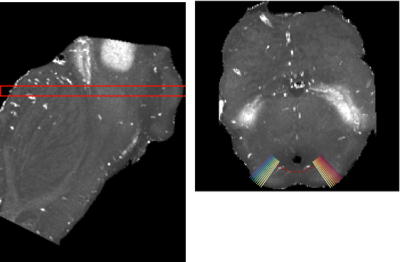
Quantitative Magnetic Resonance Imaging Assessment of Cervical Spinal Cord Injury in Rats
Seung Yi Lee1, Shekar Kurpad2, and Matthew Budde2
1Biophysics, Medical College of Wisconsin, Milwaukee, WI, United States, 2Neurosurgery, Medical College of Wisconsin, Milwaukee, WI, United States
The association of chronic motor function with the extent of edema, hemorrhage and axonal injury was investigated. Filtered-DWI improved axonal damage presentation and a rat-specific MRI template was constructed for inter-subject/modality registration.
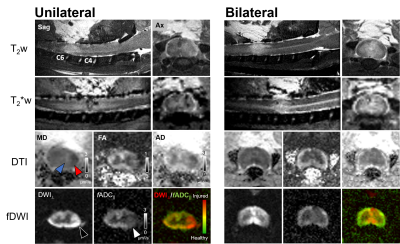
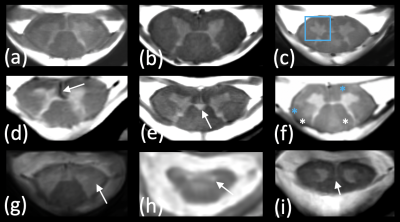
Figure 1 Multi-contrast
MRI in acute cervical cord contusion
The extent of the cord damage is captured
in different modalities in both unilateral- and bilateral contusion injury.
Edema (hyperintensity, T2w), hemorrhage (hypointensity, T2*w), vasogenic edema
(blue, black triangle), and cytotoxic edema (red, white triangle) are evident
in their respective contrasts. fDWI images clearly delineates focal axonal
damage compared to T2w, T2*w and DTI.
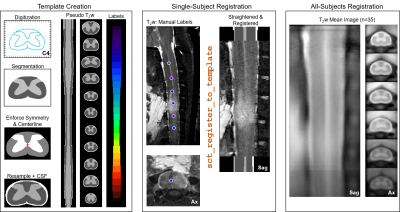
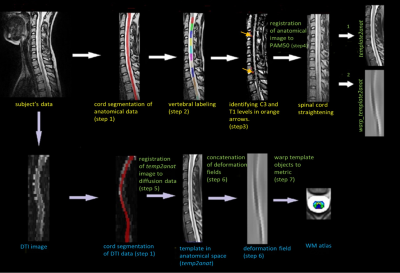
Figure 2 Inter-subject registration pipeline
A histologic spinal cord atlas was
digitized across all spinal cord levels to generate a template
with pseudo T2-weighted contrast used for MRI registration. Manually marked
spinal cord level aided initial z-level alignment and straightening followed by
x-y plane registration to the template. Registered single subject images were
averaged and registered iteratively across all subjects with the group mean image
showing clear spinal cord anatomy.
-
Increased Dorsal Network Functional Connectivity is Associated with DTI Indices in the Cervical Spinal Cord in Relapsing-Remitting MS
Anna JE Combes1,2, Kristin P O'Grady1,2, Baxter P Rogers1,2, Kurt G Schilling1,2, Richard D Lawless2,3, Mereze Visagie2, Delaney Houston2, Colin D McKnight1, Francesca R Bagnato4, John C Gore1,2,3,4, and Seth A Smith1,2,3
1Radiology & Radiological Sciences, Vanderbilt University Medical Center, Nashville, TN, United States, 2Vanderbilt University Institute of Imaging Science, Vanderbilt University Medical Center, Nashville, TN, United States, 3Biomedical Engineering, Vanderbilt University, Nashville, TN, United States, 4Neurology, Vanderbilt University Medical Center, Nashville, TN, United States
DTI and resting-state fMRI were acquired in the cervical cord in a relapsing-remitting MS group with low disability. Higher functional connectivity (FC) in the dorsal network was correlated with DTI markers of tissue damage, suggesting increased FC may be a pathological feature in this group.
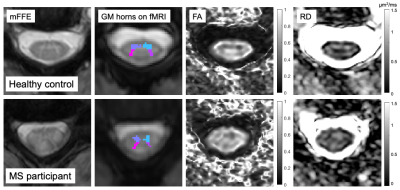
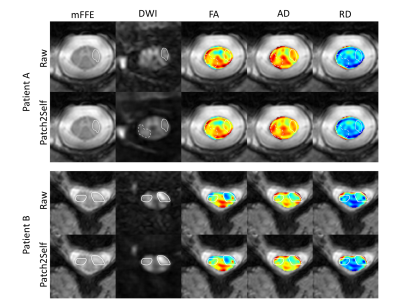
Figure 2. Example slices for a control (M, 35 years old) and a participant with MS (F, 42 years old, EDSS 1.5). Left to right: anatomical T2*-weighted mFFE for segmentation; grey matter horns regions of interest overlaid on average functional run; FA and RD diffusion maps. FA = Fractional Anisotropy. GM = Grey Matter. RD = Radial Diffusivity.
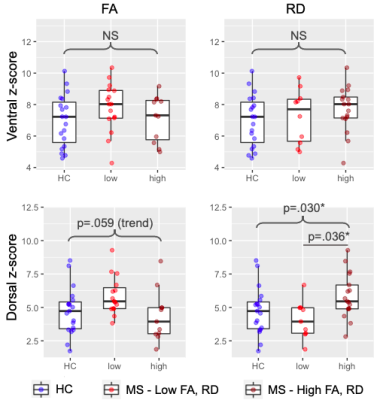
Figure 4. Ventral and dorsal network z-scores by subgroups: healthy controls (HC), MS with low FA/RD, MS with high FA/RD. FA = Fractional Anisotropy. RD = Radial Diffusivity. NS = Non Significant. *Significant at p<.05.
-
Preoperative Spinal Cord Perfusion has the ability to predict the postoperative prognosis for Patients with Cervical Spondylotic Myelopathy
Chunyao Wang1, Xiao Han2, Wen Jiang2, Guangqi Li1, Jinchao Wang2, Donghang Li2, Hua Guo1, and Huijun Chen1
1Center for Biomedical Imaging Research, School of Medicine, Tsinghua University, Beijing, China, 2Jishuitan hospital, Beijing, China
CSM is a chronic progressive disorder of spinal cord with
a relatively
ill-defined onset of pathogenesis. This study investigated the potential of preoperative blood supply
condition measured by DSC MRI with a nonparametric model in prediction of
postoperative prognosis for patients with CSM
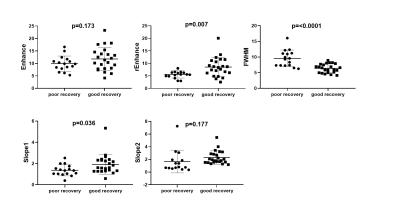
Fig 3. t-test results of 5 parameters between poor & good recovery
groups. Results show that patients in poor-recovery group have significant
lower rEnhance, slope1, but possess increased FWHM
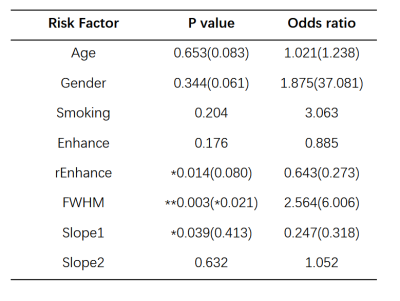
Table 2.
Univariate/multivariate Logistic Regression for prediction of
poor
postoperative recovery (mJOA≤15)
-
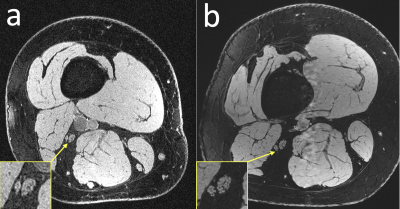
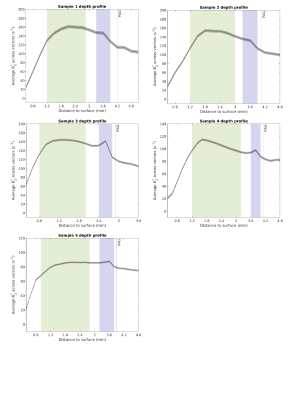
Analysis of signal and contrast in a multi-echo gradient-echo sequence of the lumbosacral cord: recommendations for number of echoes and averages
Silvan Büeler1, Patrick Freund2,3,4,5, Martina Liechti1, and Gergely David1,2
1Department of Neuro-Urology, Balgrist University Hospital, University of Zurich, Zurich, Switzerland, 2Spinal Cord Injury Center, Balgrist University Hospital Zurich, University of Zurich, Zurich, Switzerland, 3Department of Brain Repair and Rehabilitation, UCL Institute of Neurology, London, United Kingdom, 4Department of Neurophysics, , Max Planck Institute for Human Cognitive and Brain Sciences, Leipzig, Germany, 5Wellcome Trust Centre for Neuroimaging, UCL Institute of Neurology, London, United Kingdom
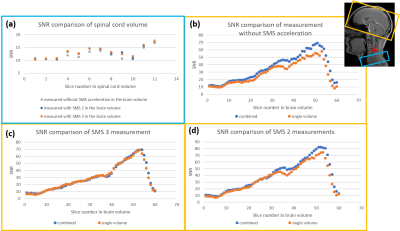
When imaging the lumbosacral cord with a multi-echo
gradient-echo sequence, we recommend a minimum of 3 and maximum of 4 echoes as
an optimal trade-off between segmentability and artifact level, and 6 signal
averages (or measurements) for robust segmentations of gray and white matter.
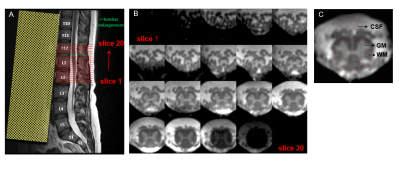
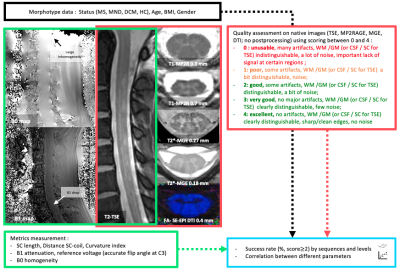
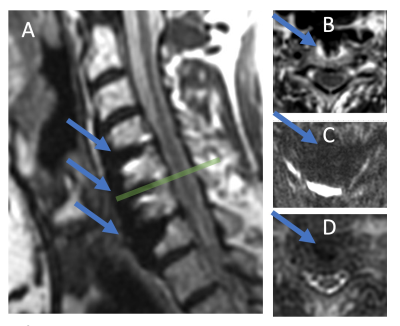
Fig. 1: A: T2-weighted sagittal turbo spin
echo image of the lower spine used for slice positioning. The 20 axial-oblique
slices are positioned individually in each subject to encompass the lumbar enlargement and the
conus medullaris. B: Corresponding axial
slices from caudal (slice 1) to rostral (slice 20) direction. C: In each
slice (here: slice 14 is shown), spinal cord and gray matter (GM) are segmented
manually and a cerebrospinal fluid (CSF) mask is defined anterior to the spinal
cord. The white matter (WM) mask is obtained by subtracting SC and GM masks.
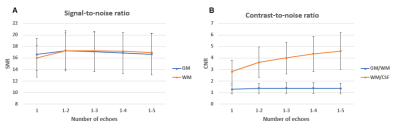
Fig. 3: Dependency of signal-to-noise ratio (SNR) of gray matter (GM) (blue curve) and white matter (WM) (orange
curve) on the number of echoes. The two curves run largely similar, increasing
from 1 to 2 echoes and minimally decreasing afterwards. B: Dependency of contrast-to-noise ratio (CNR) between
GM/WM (blue curve) and WM/CSF (orange curve) on the number of echoes. While
WM/CSF CNR steadily increases with more echoes, the WM/CSF contrast exhibits a
very flat peak at 3-4 echoes. In both subplots, error bars represent standard
deviation across subjects (n=10).
-
Lumbar disc degeneration changes in sedentary and prolonged-standing population assessed by T1ρ and T2 mapping Magnetic Resonance Imaging
Zeng qi1, Zhang ziwei1, Nie lisha2, Zhu xia1, Huang zaoshu1, and Song lingling1
1The affiliated hospital of Guizhou mdeical university, Guizhou guiyang, China, 2GE Healthcare,MR Resertch China, Beijing, China
We found that prolonged-standing is more likely to affect the L1 / 2 level discs, while sedentary is more likely to affect the lower segment discs (L4 / 5 and L5/S1).
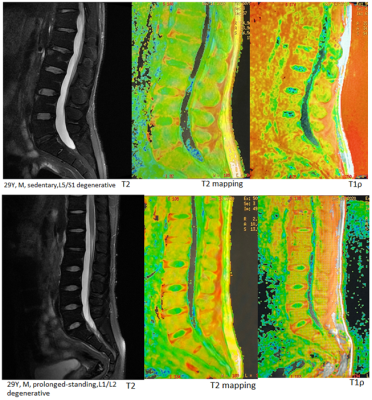
Figure2. Two 29-year-old men, prolonged-standing affected L1/2 disc, sedentary affected L5/S1 disc, the nucleus pulposus was poorly demarcated from the annulus fibrosus
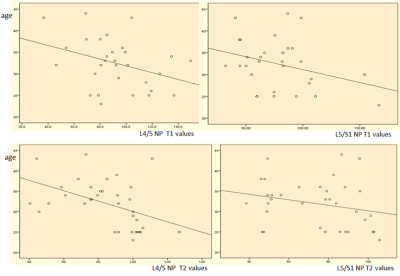
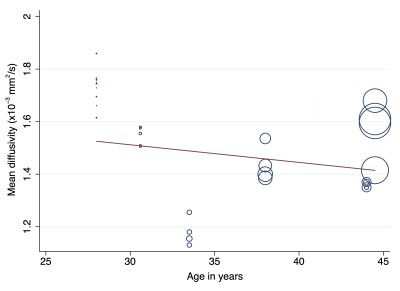
Figure 1. L4/L5、L5/S1 NP values were negatively correlated with age
-
Spinal Cord Compression is Associated with Brain Plasticity in Degenerative Cervical Myelopathy
Alicia Cronin1,2, Sarah Detombe3, Camille Duggal2, Neil Duggal3, and Robert Bartha1,2
1Medical Biophysics, University of Western Ontario, London, ON, Canada, 2Centre for Functional and Metabolic Mapping, Robarts Research Institute, London, ON, Canada, 3Clinical Neurological Sciences, University Hospital, London Health Sciences Centre, London, ON, Canada
This study found that degenerative
cervical myelopathy (DCM) patients with severe spinal cord compression also
demonstrated larger regions of cortical activation in the primary motor cortex
during a controlled finger-tapping task.
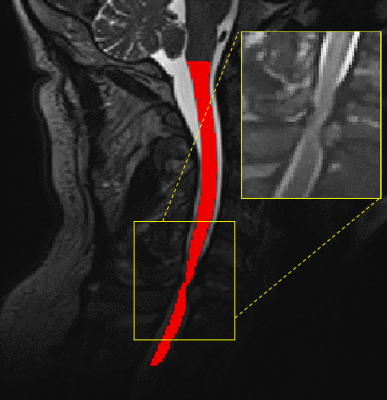
Figure 1: T2-weighted image of the cervical spinal cord of a DCM
patient showing the segmented cord in red and the compression site displayed on
the inset.
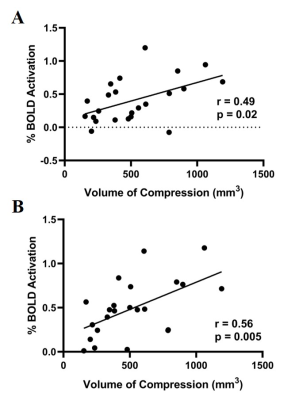
Figure 2: A: % BOLD signal correlation with spinal cord compression volume when
tapping with left hand. B: % BOLD signal correlation with spinal cord compression volume when
tapping with right hand.
-
An optimized MP2RAGE sequence for studying both brain and cervical spinal cord
Arash Forodighasemabadi1,2,3,4, Henitsoa Rasoanandrianina1,2,3,4, Mohamed Mounir El Mendili1,2, Maxime Guye1,2, and Virginie Callot1,2,4
1Aix-Marseille Univ, CNRS, CRMBM, Marseille, France, 2APHM, Hopital Universitaire Timone, CEMEREM, Marseille, France, 3Aix-Marseille Univ, Université Gustave Eiffel, LBA, Marseille, France, 4iLab-Spine International Associated Laboratory, Montreal, Canada, Marseille, France
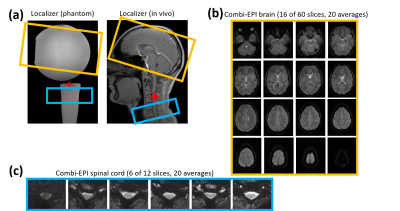
This work proposes an optimized MP2RAGE protocol and postprocessing pipeline for simultaneous brain and cervical spinal cord (BCSC) T1 mapping at 3T, providing large spatial coverage, high CNR, low B1+ sensitivity, and short acquisition time, while benefiting from high reproducibility.
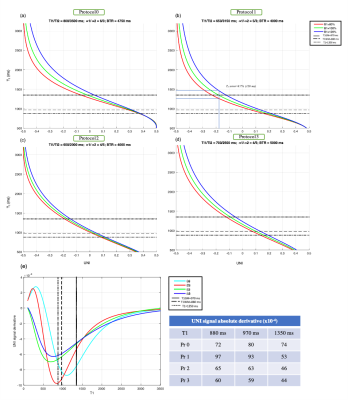
Figure 1: Relationships between UNI signal and estimated T1 value. (a) The protocol Pr0, provides the highest CNR at the expense of acquisition time. (b) The protocol Pr1 provides a high CNR, while allowing to cover brain and CSC in less than 8 minutes. It should be noted that a ±20% B1+ variation for a T1 of 1350 (brain GM) for instance, leads to an estimation error of 8.7%, showing the necessity for B1+ correction. Protocols previously optimized for (c) studying brain2,14, and (d) SC7, independently. (e) Derivative of the UNI signal, providing an indication on tissue discrimination.
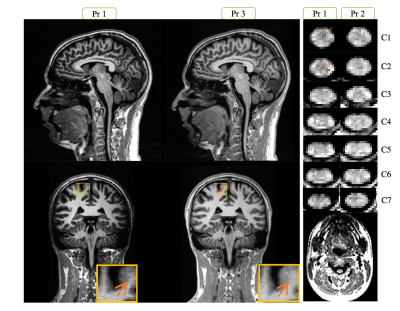
Figure 3 : A representation of the UNI-denoised image (no unit) for Pr1 and 3 on brain and Pr1 and 2 along the cervical SC. In the bottom-right image we can see a zoomed-out section of spine, which shows the need for sub-millimetric resolution for imaging SC. We can observe a nice delineation between different structures of brain and SC, with a higher signal difference (contrast) between GM and WM for the optimized protocol 1 (arrows).
-
Single-Shot Inner-Field-of-View Fast Spin Echo Imaging with MAVRIC: Access to the Spinal Cord Close to Metallic Implants
Caspar Florin1 and Jürgen Finsterbusch1
11Department of Systems Neuroscience, University Medical Center Hamburg–Eppendorf, Hamburg, Germany
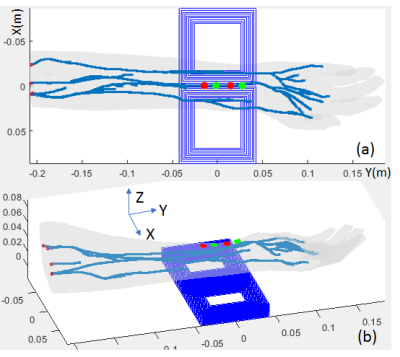
Single-shot
inner-field-of-view fast spin-echo imaging with MAVRIC is more robust close to metallic
implants than EPI and could be used for DWI of the spinal cord.
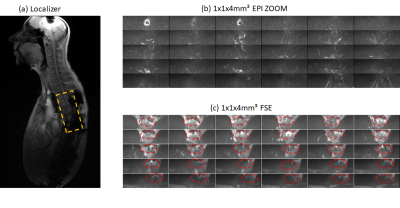
(a)
Localizer of a volunteer with metallic implants and
measured slice stack highlighted in orange. (b) 30 1x1x4mm³ transversal ZOOM
EPI acquisitions (c) 30 1x1x4mm³ transversal ZOOM MAVRIC FSE acquisitions with
a frequency increment of 500 Hz and 9 steps. The spinal cord is highlighted by
red dotted ellipsoids.

(a)
Localizer of water phantom with a diameter of 2.8 cm,
surrounded by 4 aluminum screws, with 2.9 cm and 3.3 cm to each other. (b) 7
out of 20 inner FOV FSE MAVRIC acquisitions with a resolution of
1x1x4mm³ (c) 7 out of 20 inner FOV FSE MAVRIC acquisitions with a resolution of
1x1x4mm³ and 81 MAVRIC frequency steps of Δω 500 Hz
-
Impact of manual segmentation on the non-linear registration of a spinal cord atlas to functional space
Mark A Hoggarth1, Max C Wang2, Kimberly J Hemmerling1,2, Zachary A Smith3, Kenneth A Weber II4, and Molly G Bright1,2
1Physical Therapy and Human Movement Sciences, Northwestern University, Chicago, IL, United States, 2Biomedical Engineering, Northwestern University, Evanston, IL, United States, 3Neurosurgery, Oklahoma University, Oklahoma City, OK, United States, 4Anesthesiology, Perioperative and Pain Medicine, Stanford University, Palo Alto, CA, United States
Performing
non-linear registration of fMRI improved DSC and agreement at the edges
of the spinal cord between an expert rater and 8 raters with varied
levels of experience.
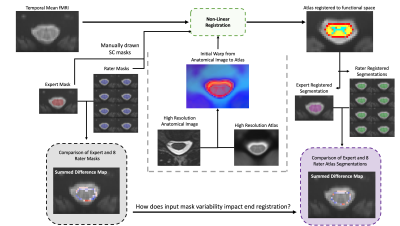
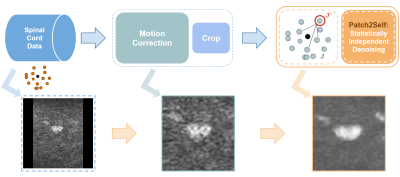
Outline
of data processing, starting with temporal mean of fMRI time series,
manually drawn spinal cord masks and comparison; then non-linear registration
using the Spinal Cord Toolbox; then the post-registration segmentations
and comparison.
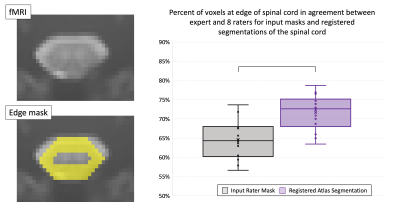
Illustration
of edge masks and box plots of percent of voxels in agreement along the
edges in input masks and registered segmentations across all raters and
participants. Edge masks were created by a 2-pixel erosion subtracted
from 2-pixel dilation of the expert mask. Bar in box plot equates
significance (p < 0.01).
-
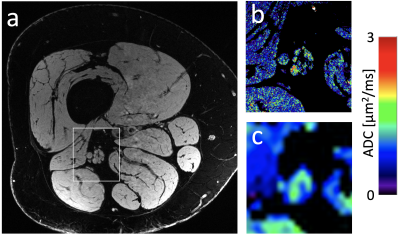
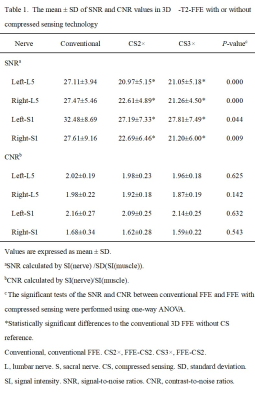
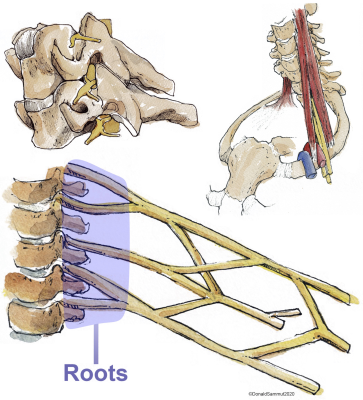
Quantitative Evaluation of Normal Lumbosacral Plexus Nerve Using Diffusion Tensor Imaging with Multiband SENSE
Nan Zhang1, Qingwei Song2, Ailian Liu2, Renwang Pu2, Haonan Zhang2, Jiazheng Wang3, and Liangjie Lin3
1The First Affilliated Hospital of Dalian Medical University, Dalian, China, 2The First Affiliated Hospital of Dalian Medical University, Dalian, China, 3Philips Healthcare, Beijing, China, Beijing, China
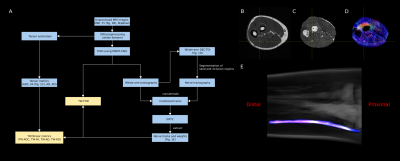
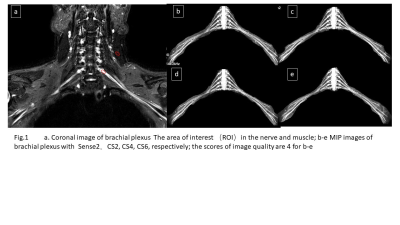
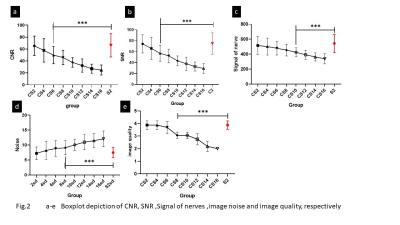
This study indicated that MB SENSE=2 was recommended
for DTI on normal lumbosacral plexus nerve, which facilitated a 50% reduction
in scan time than conventional SENSE accelerated DTI.
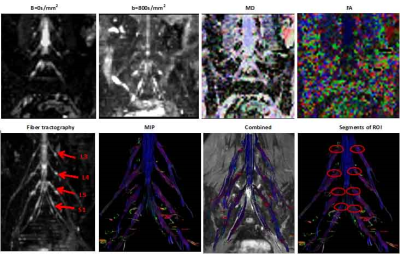
Figure1
Upper
row:b=0s/mm2,b=800s/mm2,mean diffusivity(MD),and fraction
anisotropy(FA)map.Bottom row:Fiber tractography(FT)results of the iumbosacral
nerves,a maximal intensity projection(MIP),FT and T2WI FFE combined,and disply
of the segments at each level region of interest(ROI) placement.Dates obained
by using diffusion tensor imaging based on SENSE1.6.
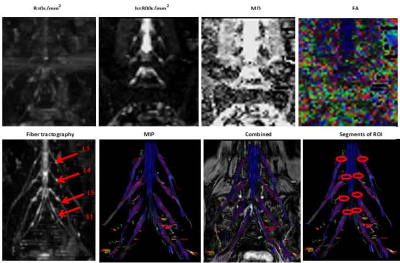
Figure2
Upper
row:b=0s/mm2,b=800s/mm2,mean diffusivity(MD),and fraction
anisotropy(FA)map.Bottom row:Fiber tractography(FT)results of the iumbosacral
nerves,a maximal intensity projection(MIP),FT and T2WI FFE combined,and disply of
the segments at each level region of interest(ROI) placement.Dates obained by
using diffusion tensor imaging based on mutiband SENSE 2.
-
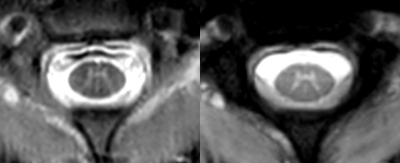
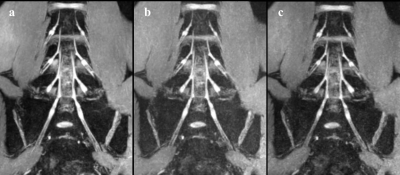
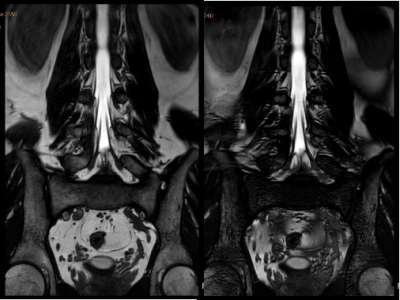
Clinical Feasibility Study of Accelerated 2D Magnetic Resonance Spinal Imaging Using Compressed Sensing Algorithm
Jianxing Qiu1, Jing Liu1, Qingping Gu2, Peng Sun2, and Naishan Qin1
1Peking University First Hospital, Beijing, China, 2Philips Healthcare, Beijing, China, Beijing, China
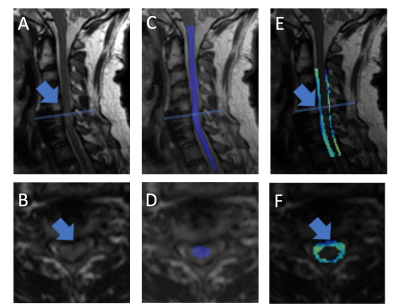
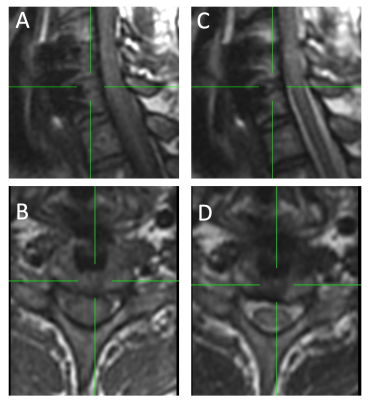
CS-MRI was valuable for improving the overall workflow of 2D spinal MRI with scanning time saved and image quality improved.
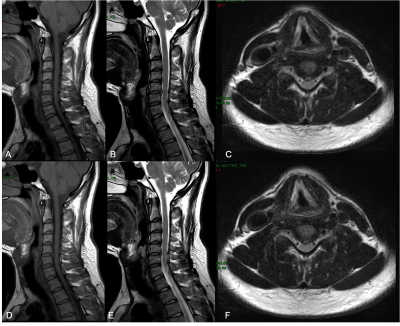
Image quality comparisons of cervical MRI between Con-MRI and CS-MRI.A-C: Con-MRI. D-F: CS-MRI.
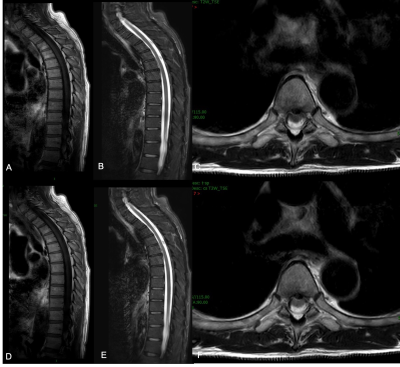
Image quality comparisons of thoracic MRI between Con-MRI and CS-MRI.A-C: Con-MRI. D-F: CS-MRI
-
Multi-parameter model proposes a comprehensive imaging index for degenerative cervical myelopathy diagnosis: a preliminary study
Yuancheng Jiang1, Xiao Han2, Jinchao Wang2, Sisi Li3, Ke Wang4, Yandong Liu5, Wei Liang5, Wen Jiang5, and Hua Guo3
1Department of Biomedical Engineering, School of Medicine, Tsinghua University, Beijing, China, 2Department of spine surgery, Beijing Jishuitan Hospital, Beijing, China, 3Center for Biomedical Imaging Research, Department of Biomedical Engineering, School of Medicine, Tsinghua University, Beijing, China, 4Electrical Engineering and Computer Sciences, University of California, Berkeley, Berkeley, CA, United States, 5Department of Radiology, Beijing Jishuitan Hospital, Beijing, China
We find that study for metrics in different ROIs is necessary. By designing a multi-parameter model, we aim to propose a comprehensive imaging index that correlates well with mJOA.
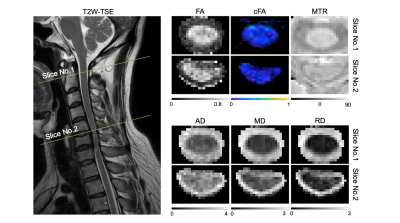
Fig.
2 Calculated DTI and MTR metrics for
the non-compressed slice (No. 1) and the compressed slice (No. 2).
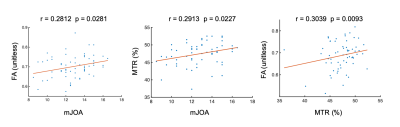
Fig.
3 Spearman
correlation between mJOA and FA (left), mJOA, and MTR (middle). Both 2 metrics
are extracted from DC at C2 level. The direct correlation between FA and MTR is also significant (right).