-
Correcting B0 inhomogeneity-induced distortions in whole-body diffusion MRI of bone metastases
Leonardino A. Digma1, Christine H. Feng1, Christopher C. Conlin2, Ana E. Rodriguez-Soto2, Kanha Batra3, Aaron Simon1, Roshan Karunamuni1, Joshua Kuperman2, Rebecca Rakow-Penner2, Michael E. Hahn2, Anders M. Dale2, and Tyler M. Seibert1,4
1Department of Radiation Medicine and Applied Sciences, UCSD School of Medicine, La Jolla, CA, United States, 2Department of Radiology, UCSD School of Medicine, La Jolla, CA, United States, 3Department of Electrical and Computer Engineering, UC San Diego, La Jolla, CA, United States, 4Department of Bioengineering, UC San Diego, La Jolla, CA, United States
In this work, we demonstrate that DWI of bone metastases undergo spatial distortions due to static magnetic field inhomogeneities. We also show that these distortions can be efficiently corrected using the reverse polarity gradient technique.
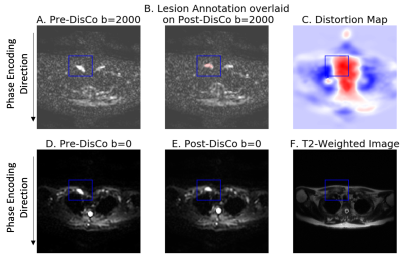
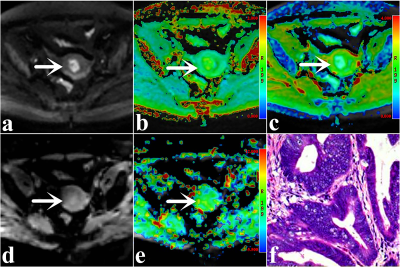
Figure 1. Example bone metastasis illustrating B0 inhomogeneity induced distortion on DWI. (A) Pre-DisCo DWI b=2000 s/mm2 (B) Lesion annotation (pink) overlaid on post-DisCo DWI b=2000 s/mm2 (C) Distortion map; voxel values represent extent of displacement at each voxel. Red and blue values denote displacement in the posterior and anterior direction, respectively. (D) Pre-DisCo DWI b=0 s/mm2 (E) Post-DisCo DWI b=0 s/mm2. F. T2-weighted image. In each subfigure, bounding box was drawn 10 voxels from the lateral edge of the lesion. Abbreviations: DisCo=distortion correction.
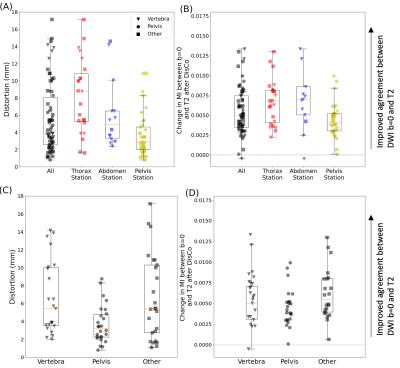
Figure 3. Distribution of RMS distortion and MI between b=0 s/mm2 and T2-weighted images. (A) RMS distortion for all lesions (black) as well as the distribution within specific imaging stations. (B) Change in MI values between the b=0 s/mm2 and T2 images after DisCo. A value larger than 0 indicates improved agreement between b=0 and T2 images. (C) RMS distortion for lesions broken down by anatomic group. (D) Change in MI values after DisCo by anatomic group. Abbreviations: RMS=root mean square, MI=mutual information.
-
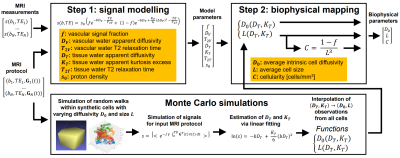
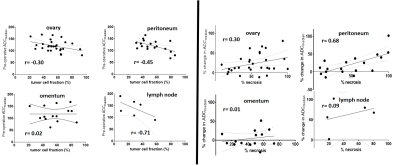
Developing a multi-parametric model of response based on biomarkers derived from Whole-Body Diffusion Weighted Imaging
Antonio Candito1, Matthew D Blackledge1, Fabio Zugni2, Richard Holbrey1, Sebastian Schäfer3, Matthew R Orton1, Ana Ribeiro4, Matthias Baumhauer3, Nina Tunariu1, and Dow-Mu Koh1
1The Institute of Cancer Research, London, United Kingdom, 2IEO, European Institute of Oncology IRCCS, Milan, Italy, 3Mint Medical, Heidelberg, Germany, 4The Royal Marsden NHS Foundation Trust, London, United Kingdom
Developing a multi-parametric model of response in patients with metastatic bone disease based on biomarkers derived from Whole-Body Diffusion Weighted Imaging. A change in median ADC showed significance in identifying response. The model predicted response with an accuracy of 87%.
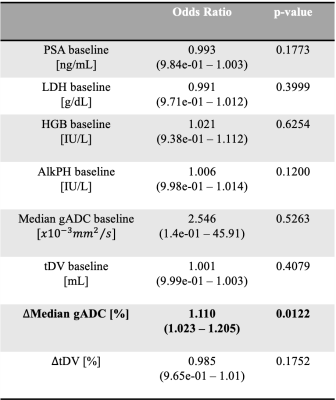
Table 1. Baseline characteristics for all the 41 patients. The blood-based biomarkers investigated were the Prostate-Specific Antigen (PSA), Hemoglobin level (HGB), Lactate dehydrogenase level (LDH) and Alkaline phosphatase level (AlkpH).
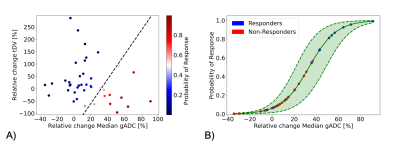
Figure 1. A) Probability of response derived from the trained logistic regression model which expects as features the relative change of Median gADC and tDV. B) Probability of response and 95% confidence interval (dashed lines) derived from fitting the logistic regression model input only the relative change of Median gADC. Estimates of the probability of response higher than 60% and lower than 40% showed low uncertainty. However, samples with a probability of response from 40 to 60% (and around the decision boundaries as showed in Figure 1A) shown higher uncertainty.
-
Developing a deep learning model to classify normal bone and metastatic bone disease on Whole-Body Diffusion Weighted Imaging
Antonio Candito1, Matthew D Blackledge1, Fabio Zugni2, Richard Holbrey1, Sebastian Schäfer3, Matthew R Orton1, Ana Ribeiro4, Matthias Baumhauer3, Nina Tunariu1, and Dow-Mu Koh1
1The Institute of Cancer Research, London, United Kingdom, 2IEO, European Institute of Oncology IRCCS, Milan, Italy, 3Mint Medical, Heidelberg, Germany, 4The Royal Marsden NHS Foundation Trust, London, United Kingdom
Developing a transfer learning model to classify normal bone and metastatic bone disease on Whole-Body Diffusion Weighted Imaging. The model shows promising results in classifying normal/metastatic bone on individual WBDWI slices, potentially without the requirement of Dixon imaging
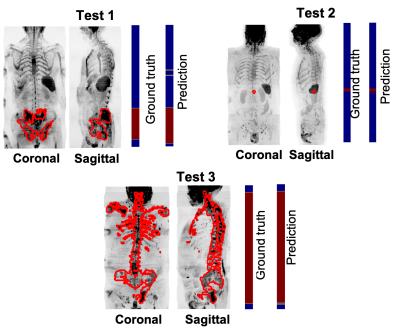
Figure 3. Assess model performance on 3 patients of the test data. Coronal and sagittal Maximum-Intensity-Projection (MIP) of SNRmap. The manual delineation of bone lesions performed by an experienced radiologist was overlayed on the MIP of SNRmap (in red). The first colormap shows the ground truth, annotated axial images with (in red) and without (in blue) metastatic bone disease. The second colormap shows the prediction performed by the trained transfer learning model.
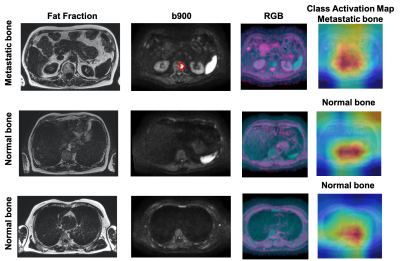
Figure 5. Axial Fat fraction, b900, RGB image and CAM from test patient 2 in Figure 3. Fat fraction combined with b900 images are typically used for manual detection of bone disease. However, using the DWI data alone, our model was able to predict presence of disease in one slice (top-row, red outline), and absence of disease in two different slice locations. CAM emphasizes where the model is ‘looking’ to derive the relevant regions within the images that lead to a particular decision. From the heatmap, red = important and blue = not important.
-
Improved assessment of prostate-cancer bone metastases through multicompartmental analysis of whole-body DWI data
Christopher C Conlin1, Christine H Feng2, Leonardino A Digma2, Ana E Rodriguez-Soto1, Joshua M Kuperman1, Dominic Holland3, Rebecca Rakow-Penner1, Tyler M Seibert1,2,4, Michael E Hahn1, and Anders M Dale1,3,5
1Department of Radiology, UC San Diego School of Medicine, La Jolla, CA, United States, 2Department of Radiation Medicine and Applied Sciences, UC San Diego School of Medicine, La Jolla, CA, United States, 3Department of Neurosciences, UC San Diego School of Medicine, La Jolla, CA, United States, 4Department of Bioengineering, UC San Diego Jacobs School of Engineering, La Jolla, CA, United States, 5Halıcıoğlu Data Science Institute, UC San Diego, La Jolla, CA, United States
An optimized 4-compartment model
better characterized whole-body diffusion than conventional DWI methods. Compartmental
signal-contributions revealed by this model may help to detect and quantify prostate-cancer
bone involvement.
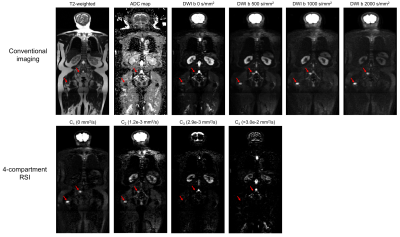
Figure 3: Coronal
whole-body images of a patient with metastatic bone lesions in the pelvis and
femur (red arrows). Conventional MR images are shown in the top row. The bottom
row shows the signal-contribution (Ci) maps for the optimized 4-compartment
RSI model. The corresponding Di
of each model compartment is listed in parentheses next to the compartment
label.
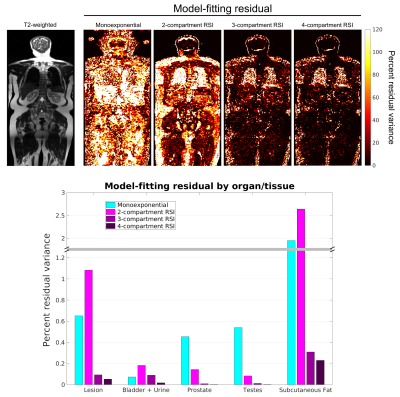
Figure 2: Model-fitting
residual at the voxel- and ROI-level. The top row shows voxel-wise maps of
fitting residual in a coronal plane of the same patient using different models.
A T2-weighted image of the same plane is included for reference. The bottom
figure graphs the fitting residual within all lesion and tissue-specific ROIs. A
better fit to the data was observed with the 4-compartment RSI model than with
the conventional monoexponential model or the lower-order RSI models.
-
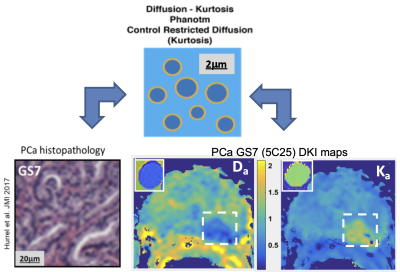
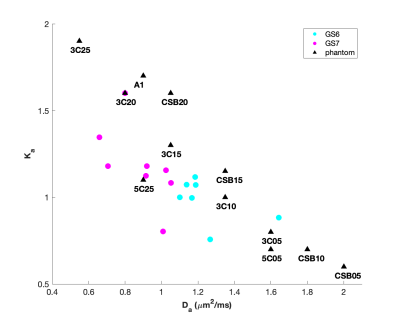
Assessment the Preponderant Diagnostic Performances of Oligometastatic Prostate Cancer Using Diffusion Kurtosis Imaging
Suhong Qin1, Ailian Liu1, SHUANG MENG1, Lihua Chen1, Qinhe Zhang1, Qingwei Song1, and Yunsong Liu1
1The First Affiliated Hospital of Dalian Medical University, Dalian, China
The performances of DKI cannot differentiate between oligometastatic and
widely metastatic PCa, but it has the potential to assess tumor load and
aggressiveness in metastatic PCa.
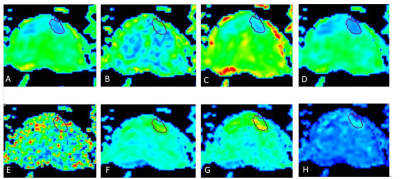
Figure 1 A 69-year-old male with PCa.ROI was manually placed on the local
lesion of MK map (A). The Ka, Kr, FAk, MD, Da, Dr and
FA maps of DKI were shown(B-H).

Table 2 Results
of correlation analysis of DKI parameters and PSA
* P value
is statistically significant.
-
Methodological considerations on segmenting MRI data of rhabdomyosarcoma
Cyrano Chatziantoniou1,2, Reineke Schoot2, Roelof van Ewijk2, Simone ter Horst2, Rick van Rijn3, Hans Merks2, Alexander Leemans1, and Alberto de Luca1
1Image Science Institute, UMC Utrecht, Utrecht, Netherlands, 2Princess Máxima Center for Pediatric Oncology, Utrecht, Netherlands, 3Department of Radiology, Academic Medical Centre Amsterdam, Amsterdam, Netherlands
In surveying recent literature on sarcomas, we found that segmentation strategies vary strongly. In comparing these strategies on a toy example, we found that the choice of segmentation method can yield a difference in measured diffusion of up to 23%.
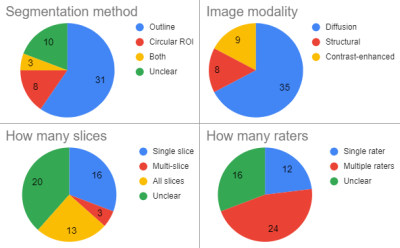
Figure 1: Segmentation methods as used in 52 recent papers on sarcoma shows a large variety in important aspects of the segmentation strategy.
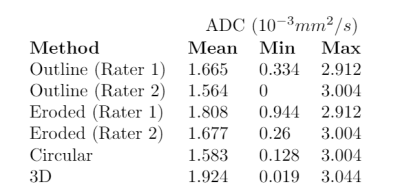
Choice of the segmentation strategy can have large impact on mean and minimum ADC (apparent diffusion coefficient) measured over the segmented area. Segmentation performed by two experienced radiologists (rater 1 and 2, outline) and a trained researcher (circular and 3D) on an ADC map of pediatric rhabdomyosarcoma. Segmented areas are shown in figure 3.
-
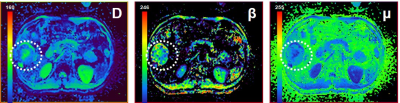
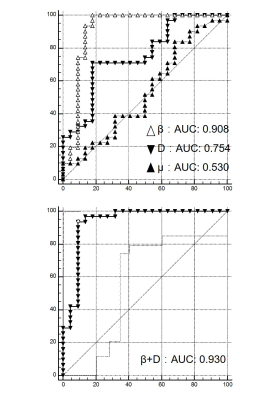
Non-gaussian IVIM DW-and fast exchange regime DCE- MRI for predicting of locoregional failure in nasopharyngeal carcinoma
Ramesh Paudyal1, Linda Chen2, Jung Hun Oh1, Kaveh Zakeri2, Vaios Hatzoglou3, Chiaojung Jillian Tsai2, Nancy Lee2, and Amita Shukla-Dave1,3
1Medical Physics, Memorial Sloan Kettering Cancer Center, New York, NY, United States, 2Radiation Oncology, Memorial Sloan Kettering Cancer Center, New York, NY, United States, 3Radiology, Memorial Sloan Kettering Cancer Center, New York, NY, United States
Quantitative
imaging metrics derived from NG-IVIM DW- and FXR DCE-MRI could predict the patients with LRF in NPC using the cumulative incidence analysis .
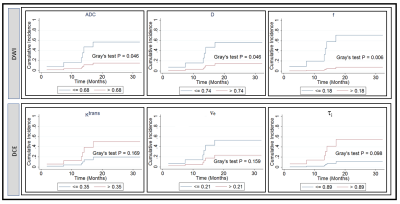
Figure 4. Cumulative
incidence analysis for pretreatment apparent diffusion coefficient, ADC (mm2/s),
true diffusion coefficient, D (mm2/s), perfusion fraction, f, volume transfer
constant, Ktrans (min-1), the volume fraction of
extravascular extracellular, ve, and mean lifetime of intracellular
water protons, τi (sec). Gray’s
test revealed a significant difference for ADC, D, and f (P <0.05), and a
borderline significance for τi (sec) (P=0.098).
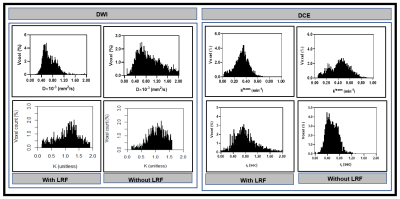
Figure 3. Left:
Representative histogram plot of true diffusion coefficient, D, and kurtosis
coefficient, K), in patients with and without LRF of nasopharyngeal cancer
(Figure 2). D values spread out towards higher in a patient without LRF than
compared to with LRF. In contrast, K values spread to a higher value in a
patient with LRF than without LRF. Right: Ktrans values spread out
towards higher in a patient without LRF as compared to with LRF. In contrast, τi values spread to
higher in a patient with LRF as compared without LRF.
-
Repeatability of VERDICT diffusion MRI in a model of human neuroendocrine tumour
Lukas Lundholm1, Mikael Montelius1, Oscar Jalnefjord1, Eva Forssell-Aronsson1, and Maria Ljungberg1
1Department of Radiation Physics, Institute of Clinical Sciences, Gothenburg, Sweden
VERDICT
dMRI showed a good overall repeatability of the mean estimated parameter values
within the studied tumours. However, some local clusters of voxels showed
larger differences between repeated scans.
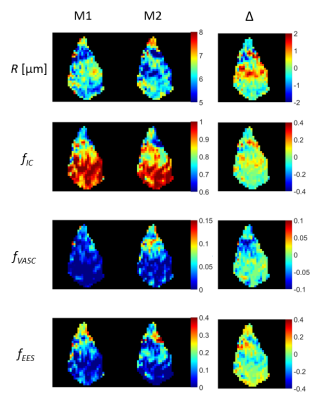
Figure 2.
Colormaps of cell radius index (R), intracellular volume fraction (fIC),
vascular volume fraction (fVASC), and extracellular extravascular
volume fraction (fEES) as estimated by VERDICT in the central slice
of an example tumour. Colormaps are shown for two repeated measurements (M1 and
M2) and the difference between the repeated measurements (Δ)
-
Qualitative and quantitative comparison between IVIM-DKI and PET/CT imaging in lymphoma
Archana Vadiraj Malagi1, Devasenathipathy Kandasamy2, Kedar Khare3, Deepam Pushpam4, Rakesh Kumar5, Sameer Bakhshi4, and Amit Mehndiratta1,6
1Centre for Biomedical Engineering, Indian Institute of Technology Delhi, New Delhi, India, 2Department of Radiodiagnosis, All India Institute of Medical Sciences Delhi, New Delhi, India, 3Department of Physics, Indian Institute of Technology Delhi, New Delhi, India, 4Department of Medical Oncology, Dr. B.R. Ambedkar Institute-Rotary Cancer Hospital (IRCH), All India Institute of Medical Sciences Delhi, New Delhi, India, 5Department of Nuclear Medicine, All India Institute of Medical Sciences Delhi, New Delhi, India, 6Department of Biomedical Engineering, All India Institute of Medical Sciences Delhi, New Delhi, India
Correlation analysis showed no significant
relationship between IVIM-DKI and PET parameters. IVIM parameters with Total-Variation
model produced substantial reproducibility with better quality parameter maps.
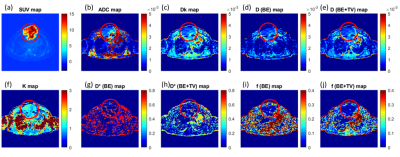
Figure2 (a) SUV map, (b) ADC map, (c, k) DKI parameter maps, (d, e) diffusion parameters
and (g-j) perfusion parameters from IVIM analysis of a 32-year-old male was
diagnosed for NHL; the tumour was present in sternum encircled in red.
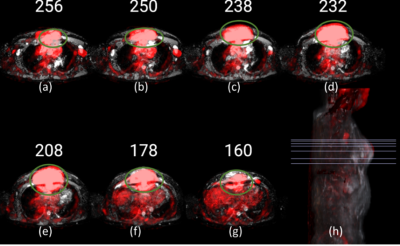
Figure1 PET images (red) overlapped onto ADC images of a patient with NHL, where the tumour is encircled (green). (a) to (g) represents
baseline scans at axial view. (h) Representative 3D sagittal view with lines
indicating slices (a-g) selected for visualization.
-
Preliminary Study on Monitoring Drug Resistance of Colon Cancer with Intravoxel Incoherent Motion MRI In Vivo
Qi Xie1, Wenjuan He1, Zhilin Tan1, Yajie Wang1, Jinbin Wu1, Xiyan Shao2, Yiming Yang3, Jing Zhang4, Kangwei Wang5, Guiqin Wang6, Qifeng Pan1, and Yunzhu Wu7
1Medical Imaging Department, Nansha Hospital, Guangzhou First People's Hospital, School of Medicine, South China University of Technology, Guangzhou, China, 2Ultrasound Imaging Department, Longgang District People’s Hospital, Shenzhen, China, 3Department of Radiology, The Second Affiliated Hospital of Guangzhou University of Chinese Medicine, Guangdong Provincial Hospital of Traditional Chinese Medicine, Guangzhou, China, 4Department of Pathology, Cancer Center, Sun Yat-sen University, Guangzhou, China, 5Department of Pathology, Nansha Hospital, Guangzhou First People's Hospital, School of Medicine, South China University of Technology, Guangzhou, China, 6Medical Record Department, Nansha Hospital, Guangzhou First People's Hospital, School of Medicine, South China University of Technology, Guangzhou, China, 7MR Scientific Marketing, SIEMENS Healthcare Ltd., Guangzhou, China
The ADC value of DWI and diffusion coefficient D of IVIM were moderate valuable for discriminating 5-FU-response and resistance of colon cancer in vivo.
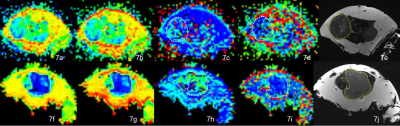
IVIM DWI parametric maps of ADC, D, D* and f values and T2WI images for SW480 (A-E)and SW480/5-FU(F-J).
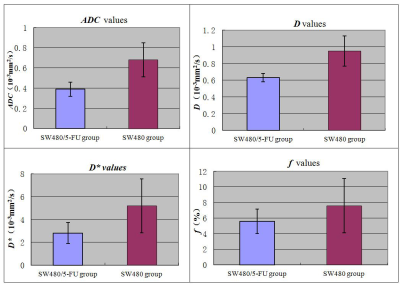
The Comparison of The ADC(a), D(b), D*(c) and f(d) values between SW480/5-FU and SW480 xenografts.
-
Evaluation of bone marrow infiltration in the newly diagnostic Multiple Myeloma with Intravoxel Incoherent Motion Diffusion-weighted MRI
Xiaojiao Pei1, Tao Jiang1, Zhenyu Pan1, Yufei Lian1, Yueluan jiang2, and qinglei Shi 3
1Radiology, Beijing Chaoyang Hospital Affiliated to Capital Medical University, Beijing, China, 2MR Scientific Marketing, Diagnosis Imaging, Siemens Healthineers China, Beijing, China, 3Scientific Marketing, Diagnosis Imaging, Siemens Healthineers China, Beijing, China
This
study used IVIM parameters to quantitatively diagnose MM vertebral bone marrow and normal bone marrow. For diagnosing MM patients from healthy
volunteers, the D showed
the highest sensitivity was 90.0%,
and its Specificity was
94.7%,with the cutoff value of 141.8×10⁻³㎜2/s.
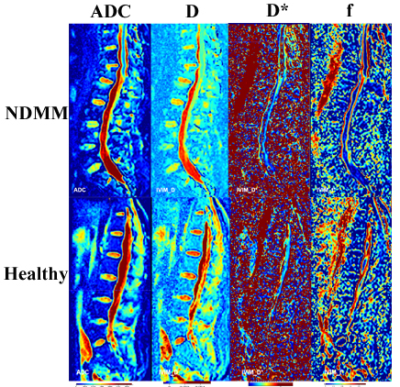
Fig1. Exemplary Sagittal IVIM parametric maps
of lumbar
spine in NDMM group and healthy group.
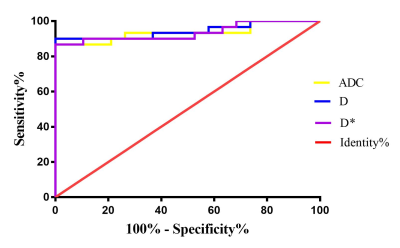
Fig3. Analysis
of ROC curve between ADC, D and D*.
The
area under the receiver operating characteristic (ROC) curve of ADC, D and D* were
0.935±
0.037, 0.944± 0.034, and 0.935± 0.036, respectively. Among these, the IVIM-dfast
showed the highest sensitivity was 90.0%,
and its Specificity
was
94.7%, with the cutoff value of 141.8×10⁻³㎜2/s.
-
Diffusion and perfusion MRI predicts response preceding and shortly after stereotactic radiosurgery to brain metastases
Amaresha Shridhar Konar1, Akash Deelip Shah2, Ramesh Paudyal1, Jung Hun Oh1, Eve LoCastro1, David Aramburu Nuñez1, Nathaniel Swinburne2, Robert J. Young2, Andrei I. Holodny2, Kathryn Beal3, Vaios Hatzoglou2, and Amita Shukla-Dave1,2
1Medical Physics, Memorial Sloan Kettering Cancer Center, New York, NY, United States, 2Radiology, Memorial Sloan Kettering Cancer Center, New York, NY, United States, 3Radiation Oncology, Memorial Sloan Kettering Cancer Center, New York, NY, United States
The present
prospective study aims to determine the ability of DW- and DCE-MRI to predict the long-term response of Brain Metastases
within 72 hours of SRS. The results are promising as it will inform
the treating physicians at an early time point about which patients will
benefit from SRS (or not).
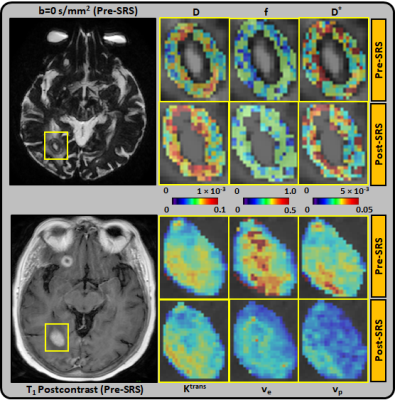
Figure 1: Representative pre-SRS and post-SRS (within 72 hours of treatment)
MR images from an 80 year-old female with right occipital lobe brain
metastasis, which demonstrated progressive disease (PD). Top panel: D(×10-3 mm2/s), D*(×10-3 mm2/s), and f maps are zoomed in at the
locations of ROIs (pre-SRS b=0 s/mm2 image). The lesion volume was
unchanged at post-SRS. Bottom panel: Ktrans (min-1), ve, and
vp maps are zoomed in at the locations of ROIs (pre-SRS T1-postcontrast
image).
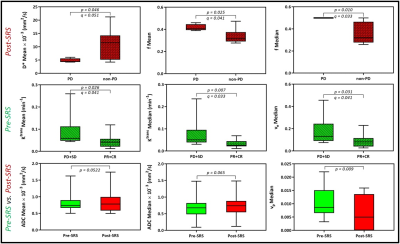
Figure 4: Lesions that progressed had a higher f mean and median than those
that did not. Lesions that responded to SRS had a lower pre-SRS Ktrans
mean, Ktrans median, and ve median than those that did
not. ADC mean and median trended higher in lesions post-SRS than pre-SRS. vp
was lower in lesions post-SRS than pre-SRS. ADC, apparent diffusion
coefficient. Ktrans, index of tumor vascular permeability. ve,
volume fraction of extracellular extravascular space. vp, vascular
volume.
-
The utility of IVIM maps in the assessment of microvascular perfusion of brain glioma
Andre Monteiro Paschoal1,2, Raquel Andrade Moreno3,4, Antonio Carlos dos Santos5, and Renata Ferranti Leoni6
1LIM44, Instituto e Departamento de Radiologia, Faculdade de Medicina, Universidade de Sao Paulo, Sao Paulo, Brazil, 2InBrain Lab, University of Sao Paulo, Ribeirao Preto, Brazil, 3Instituto do Cancer do Estado de Sao Paulo, Sao Paulo, Brazil, 4Memorial Sloan-Kettering Cancer Center, New York, NY, United States, 5Departamento de Clinica Medica, Faculdade de Medicina de Ribeirao Preto, Universidade de Sao Paulo, Ribeirao Preto, Brazil, 6InBrain Lab - University of Sao Paulo, Ribeirao Preto, Brazil
IVIM fD* maps were able to detect small perfusion changes in early stages of low grade gliomas, suggesting its use as an early biomarker for this parameter. In high grade glioma, it may provide complementary information to contrast agent perfusion.
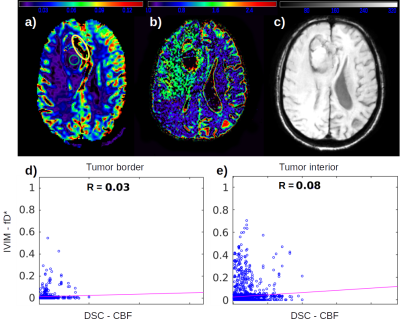
Figure 1: High grade glioma. a) DSC CBF map; b) IVIM fD* map; c) SWI map; d) Correlation between fD* and CBF at the tumor ROI in yellow at the tumor border; e) Correlation between fD* and CBF at the tumor ROI in green at the tumor interior.
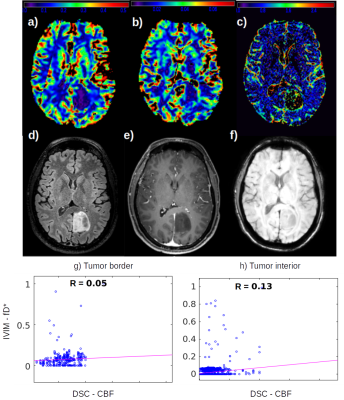
Figure 2: Low grade glioma. a) DSC CBF map; b) DSC CBV map; c) IVIM fD* map; d) FLAIR; e) Post contrast T1 image; f) SWI; g) Correlation between fD* and CBF at the tumor ROI at the tumor border; h) Correlation between fD* and CBF at the tumor ROI at the tumor interior.
-
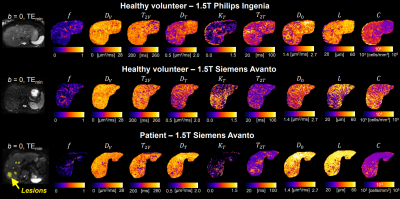
Diffusion-time-dependent diffusion MRI based microstructural mapping for grading and categorizing in pediatric brain tumor
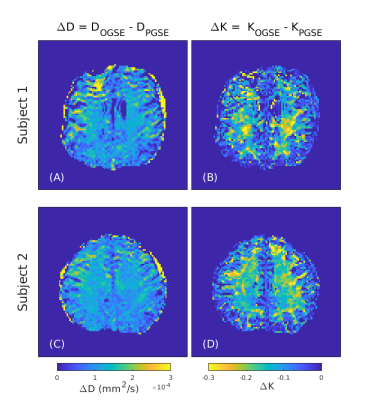
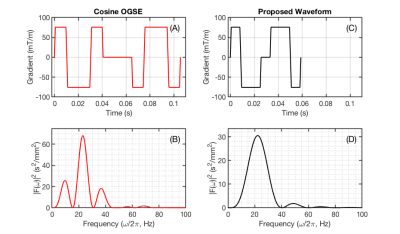
ruicheng ba1, Hongxi Zhang2, Zhongwei Gu3, Yuhao Liao1, Xingwang Yong1, Zhiyong Zhao1, Yi Zhang1, and Dan Wu1
1Key Laboratory for Biomedical Engineering of Ministry of Education, Department of Biomedical Engineering, College of Biomedical Engineering & Instrument Science, Zhejiang University, Hang zhou, Zhejiang, China, 2Children's Hospital, Zhejiang University School of Medicne,Department of Radiology, Hang zhou, Zhejiang, China, 3Children's Hospital, Zhejiang University School of Medicne, Department of Pathology, Hangzhou, Zhejiang, China
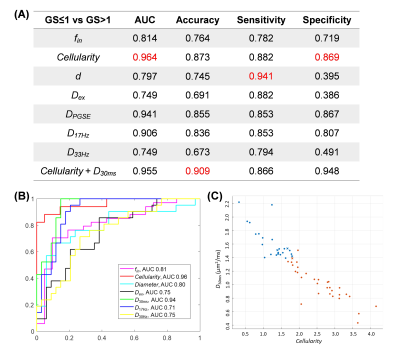
Tumor microstructure was estimated based on
time-dependent dMRI and IMPULSED model. Cellularity and intracellular
fraction increased from low-grade to high-grade glioma, and further increased
in medulobastom. Cellularity achieved the highest area-under-the-curve in
grading glioma.
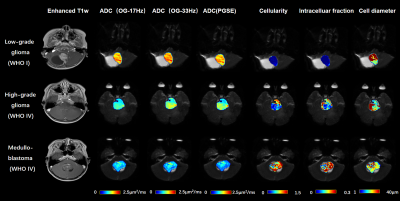
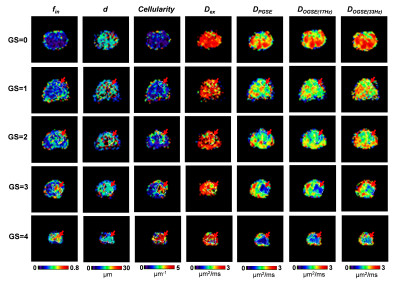
Figure 1: Gd-enhanced T1w images
and the maps of ADC(OGSE-17Hz, OGSE-33Hz, PGSE), cellularity,
intracelluar fraction and cell diameter as obtained from the IMPULSED model.
The
ADC and microstructural maps were overlaid on the b0 image for reprehensive
low-grade glioma, high-grade glioma, and medulloblastoma cases.
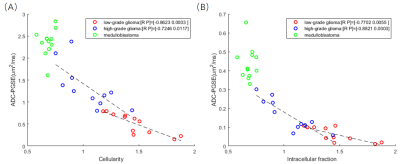
Figure 4: (A) Correlation between ADC (PGSE)
and cellularity. Regression analysis revealed correlation was strongest for low-grade glioma (r = -0.8623, p = 0.0003), followed by high-grade
glioma (r = -0.7246, p = 0.0117); whereas not significant correlation were
found for medulloblastoma (p=0.4095).
(B) Similar correlations patterns were found between ADC (PGSE) and Intracellular
fraction.
-
Imaging attributes of H3K27M mutation in Diffuse Midline Gliomas on Multiparametric MRI
Richa Singh Chauhan1, Nihar Kathrani2, Jitender Saini1, Maya D Bhat1, Karthik Kulanthaivelu1, Vani Santosh3, Nishanth S4, and Subhas Konar4
1Neuroimaging and Interventional Radiology, NIMHANS, BENGALURU, India, 2Interventional Radiology, Paras Hospital, Gurgaon, India, 3Neuropathology, NIMHANS, BENGALURU, India, 4Neurosurgery, NIMHANS, BENGALURU, India
H3K27M mutation in diffuse midline
gliomas can be predicted on multiparametric MRI using the conventional and
advanced (diffusion and perfusion) sequences.
(A to I) T1w, T2w,
FLAIR, DWI, ADC, SWI, post-contrast T1w images, rCBV map, and perfusion curve of
a bithalamic H3K27M mutant DMG.
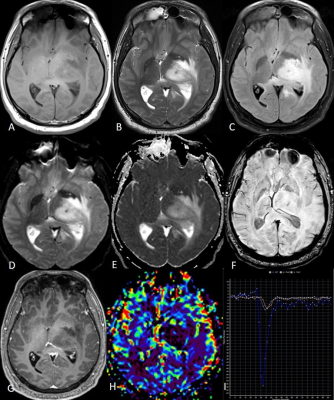
(A to I) T1w, T2w,
FLAIR, DWI, ADC, SWI, post-contrast T1w images, rCBV map, and perfusion curve of
a left thalamic H3K27M wild-type DMG.
-
Grading of glioma with histogram analysis of multiparameter using advanced diffusion models
Gao Eryuan1, Gao Ankang1, Zhang Huiting2, Wang Shaoyu2, Yan Xu2, Bai Jie1, and Cheng Jingliang1
1Dept. of MRI, The First Affiliated Hospital of Zhengzhou University, Zhengzhou, China, Zhengzhou, China, 2MR Scientific Marketing, Siemens Healthcare, Shanghai, China, Shanghai, China
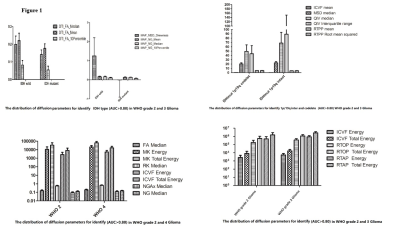
Histogram Analysis based on multiple diffusion
models was helpful in glioma grading., especially for the maximum values of DTI and MAP methods.
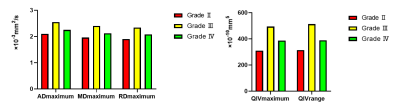
Fig.
1. Bar
graphs of ADmaximum, MDmaximum, RDmaximum, QIVmaximum
and QIVrange values averaged across grade Ⅱ (n=33), grade Ⅲ (n=11) and grade Ⅳ (n=54) gliomas. All parameters are significant with P<0.05.
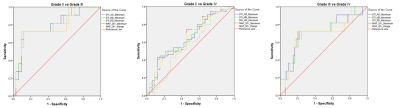
Fig.
2. ROC analysis for ADmaximum, MDmaximum,
RDmaximum, QIVmaximum and QIVrange in three
comparisons (GradeⅡ VS GradeⅢ, GradeⅡVS Grade Ⅳ and GradeⅢ VS Grade Ⅳ)
-
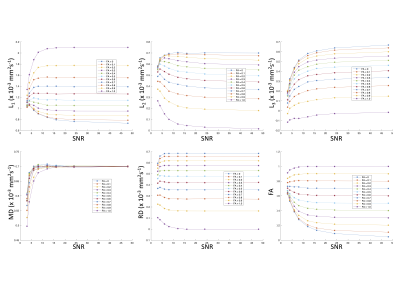
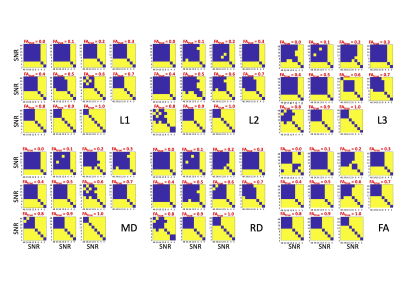
Histogram analysis in prediction of Isocitrate Dehydrogenase Genotype in Gliomas with MRI: The Gaussian versus non-Gaussian Diffusion Models
Gao Ankang1, Gao Eryuan1, Zhang Huiting2, Wang Shaoyu2, Yan Xu2, Bai Jie1, and Cheng Jingliang1
1Dept. of MRI, The First Affiliated Hospital of Zhengzhou University, Zhengzhou, China, 2MR Scientific Marketing, Siemens Healthcare, Shanghai, China, Shanghai, China
MAP as an advanced
diffusion model has more advantages than other models in
prediction of glioma Genotype. Histogram analysis
is a useful method in quantitative analysis of diffusion parameters and shows a
great potential in glioma research.
The distribution of mean and SD of useful
parameters
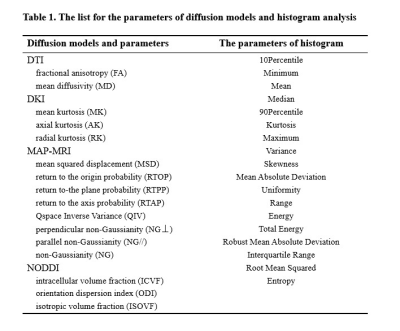
The list for the parameters of diffusion models and histogram analysis
-
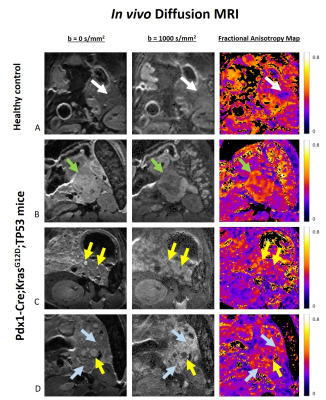
Neurite Orientation Dispersion and Density Imaging in Evaluation of Glioma-induced Corticospinal Tract Injury
Rifeng Jiang1, Kaiji Deng1, Yixin Guo2, and Zhongshuai Zhang3
1Fujian Medical University Union Hospital, Fuzhou, China, 2Fujian Medical University, Fuzhou, China, 3MR Scientific Marketing, Siemens Healthcare, Shanghai, China
This study found that NODDI seems to be a more potent approach in evaluating the early CST infiltration by HGG, and can evaluate the CST destruction with a similar performance to MD by providing additional information about neurite density for HGG-induced CST injury.
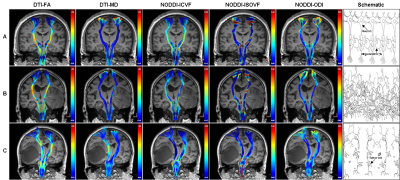
Three representative subjects demonstrating the CST
changes in HGG patients. The
subject A was a 39-year-old healthy male. All the CST features have good bilateral
symmetry. The patient B was a 72-year-old male with glioblastoma,
and his motor function was normal. The ICVF of the affected CST decreased
obviously, but changes of the affected CST were not obvious in the other
diffusion parameters. The patient C was a 62-year-old female with glioblastoma, and she had motor weakness (grade 2). Changes of the affected
CST were obvious in FA, MD and ICVF, but not in ISOVF and ODI.
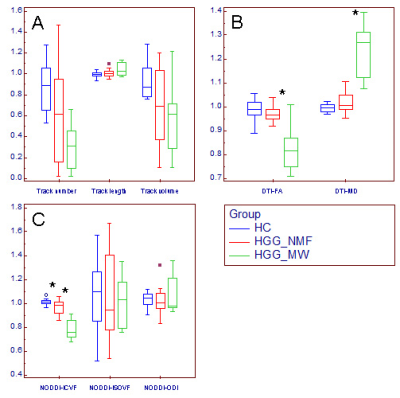
Changes of relative CST features in HGG patients.
Box and whisker plot (A-C) showed that compared with the relative CST features
in HGG_NMF, the relative MD was significantly
higher, where the relative FA and ICVF were significantly lower (*) in HGG_MW; compared with the relative CST features in HC, the relative ICVF was significantly lower (*) in HGG_NMF; in contrast, no significant changes were found in
the relative CST morphological characteristics, ISOVF or ODI.
HGG_MW = HGG patients with motor weakness, HGG_NMF = HGG
patients with normal motor function,
HC = healthy subject.
-
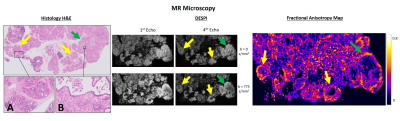
Beyond cellularity: Which microstructural features determine the mesoscopic mean diffusivity in meningiomas?
Jan Brabec1, Filip Szczepankiewicz2, Jaromír Šrámek3, Elisabet Englund4, Johan Bengzon5, Linda Knutsson1,6, Carl-Fredrik Westin7,8, Pia C Sundgren2,9, and Markus Nilsson2
1Medical Radiation Physics, Lund University, Lund, Sweden, 2Diagnostic Radiology, Lund University, Lund, Sweden, 3Institute of Histology and Embryology, First Faculty of Medicine, Charles University, Prague, Czech Republic, 4Division of Oncology and Pathology, Department of Clinical Sciences, Lund University, Lund, Sweden, 5Division of Neurosurgery, Department of Clinical Sciences, Lund University, Lund, Sweden, 6Russell H. Morgan Department of Radiology and Radiological Science, Johns Hopkins University School of Medicine, Baltimore, MD, United States, 7Harvard Medical School, Boston, MA, United States, 8Radiology, Brigham and Women’s Hospital, Boston, MA, United States, 9Lund University Bioimaging Center, Lund University, Lund, Sweden
Cellularity poorly explains intra-tumor variability of mean diffusivity on mesoscopic scale in meningiomas. Other microstructural features such as microcysts, macrocysts, vessels, psammoma bodies, collagen fibers or need to be considered.
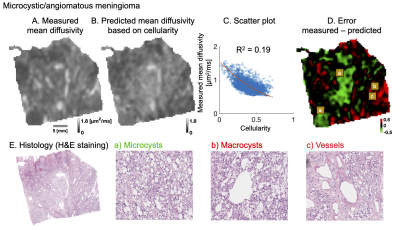
Figure 1. Analysis of microcystic/angiomatous meningioma. The upper row shows measured (A) and predicted mean diffusivity based on cellularity (B): a second-degree polynomial yielded R2 of 0.19 (C). The error map (D) shows large negative (green area) and positive (red) errors where the predicted diffusivity is over/under-estimated. Overestimation was related to high prevalence of microcysts (a; bottom row) because these provide restrictions. Underestimation was found in regions that contained macrocysts and vessels (b and c) because these provide free water compartments.
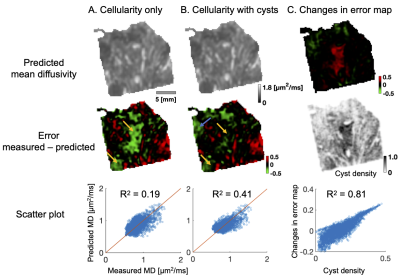
Figure 3. Quantitative analysis. Part A shows predicted diffusivity omitting and part B including microcysts. The error maps reveal large systematic error areas (yellow arrows) that disappears when cysts are included in the fit already as an additional linear term. In addition, R2 increases from 0.19 to 0.41. The blue part marks newly emerged error area that was not previously there. Part C highlights the changes in the error maps. The changes are strongest in the middle part where the cyst density is also the highest. The changes overall strongly correlate with cyst density (R2 = 0.81).
-
Diffusion MRI based on a gamma distribution model for the differentiation of primary central nervous system lymphomas and glioblastomas
Osamu Togao1, Akio Hiwatashi2, Toru Chikui3, Kazufumi Kikuchi2, Yukiko Kami3, Kenji Tokumori4, and Kousei Ishigami2
1Molecular Imaging & Diagnosis, Kyushu University, Fukuoka, Japan, 2Clinical Radiology, Kyushu University, Fukuoka, Japan, 3Oral and Maxillofacial Radiology, Kyushu University, Fukuoka, Japan, 4Clinical Radiology, Teikyo University, Omuta, Japan
The gamma distribution (GD) model analysis revealed that the κ, f2, and f3 values were smaller and the f1 values were larger in the primary CNS lymphomas than in the glioblastomas. The GD model may contribute to the characterization of brain tumor from the histological viewpoint.
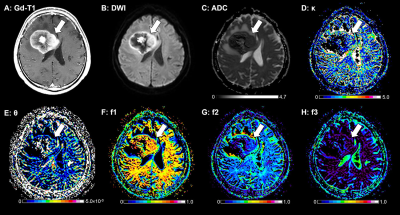
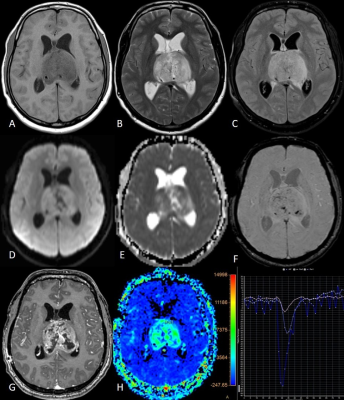
Figure 2. A 62-year-old-male with a PCNSL. A: The post-contrast T1-weighted image shows a ring-like enhancing mass lesion in the right frontal lobe (arrow). The enhancing lesion shows high signal intensity on the DWI (B) and a low ADC (0.70×10⁻³ mm2/sec, C). This lesion shows a small κ (1.76, D), a large θ (4.85×10⁻⁶ mm2/sec, E), a large f1 (0.626, F), a small f2 (0.270, G), and a small f3 (0.104, H).
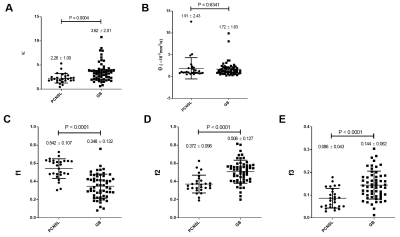
Figure 1. Comparisons of the GD model-derived parameters between the PCNSLs and GBs in the gadolinium-enhancing lesion. A: The κ was significantly smaller in the PCNSL group than in the GB group. B: The θ was not significantly different between the groups. C–E: The f1 was significantly larger and the f2 and f3 were significantly smaller in the PCNSL group than in the GB group.