-
fMRI with a Zero Echo Time (ZTE) Pulse Sequence
Martin John MacKinnon1,2,3,4, Yuncong Ma1,2,4, Sheng Song1,2,4, Tzu-Hao Harry Chao1,2,4, Tzu-Wen Winnie Wang1,2,4, SungHo Lee2,4, SungHo Lee1,2,4, Wei-Tang Chang2,5, and Yen-Yu Ian Shih1,2,4
1Center for Animal MRI, University of North Carolina at Chapel Hill, Chapel Hill, NC, United States, 2Biomedical Research Imaging Center, University of North Carolina at Chapel Hill, Chapel Hill, NC, United States, 3The Joint Department of Biomedical Engineering, University of North Carolina at Chapel Hill, Chapel Hill, NC, United States, 4Department of Neurology, University of North Carolina at Chapel Hill, Chapel Hill, NC, United States, 5Department of Radiology, University of North Carolina at Chapel Hill, Chapel Hill, NC, United States
We study the feasibility of using ZTE to detect functional activations
with endogenous contrast using a rat forepaw electrical stimulation
paradigm. We show that ZTE-fMRI has a 67% greater sensitivity than the
gold-standard BOLD-weighted EPI.
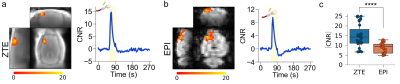
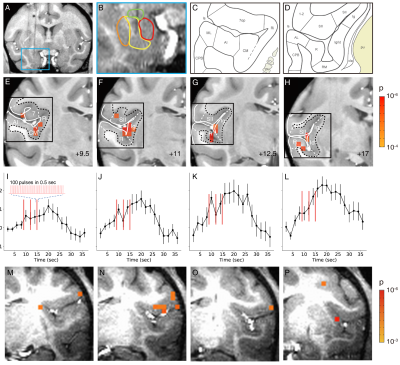
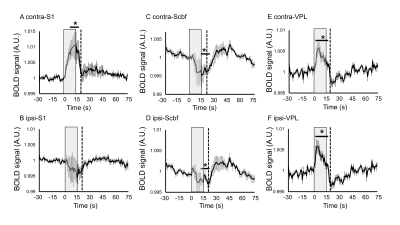
Figure 4.
ZTE and EPI functional
responses to forepaw electrical stimulation. a) ZTE-fMRI and b) BOLD-weighted
fMRI activation maps and averaged timcourses. Time courses were extracted from the mean of 3 voxel3 ROIs in contralateral S1. ZTE-fMRI exhibited a 67 % greater
CNR than that of BOLD-weighted EPI ( t(52)=4.80,P=1.37x10⁻⁵).
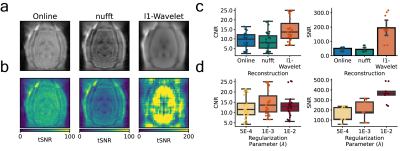
Figure 2: Effect of reconstruction algorithm on ZTE functional data. Coronal (scanner coordinate system) views of raw ZTE-fMRI data (a) following online reconstruction, nufft and l1-Wavelet regularization and (b) the corresponding tSNR maps. Comparison of CNR of evoked response and SNR of functional data during rat forepaw electrical stimulation (c). Effect of l1-wavelet regularization parameter on CNR and SNR of functional ZTE data. For both c) and (d) n=3 subjects, 27 trials.
-
Functional MRI of mice olfactory bulbs using novel fMRI methodologies at 15.2T
Odélia Jacqueline Chitrit1, Qingjia Bao1, Silvia Chuartzman2, Noga Silkha2, Tali Kimchi2, and Lucio Frydman1
1Department of Chemical and Biological Physics, Weizmann institute of Science, Rehovot, Israel, 2Department of Neurobiology, Weizmann institute of Science, Rehovot, Israel
Spatiotemporal Encoding (SPEN) MRI was used in fully and non fully-refocused modes, to capture the activation of Olfactory Bulbs in mice, in response to odors. At the 15.2T field, the image quality largely exceeded that arising in GE or even SE EPI and responses on the order of 10% could be observed.
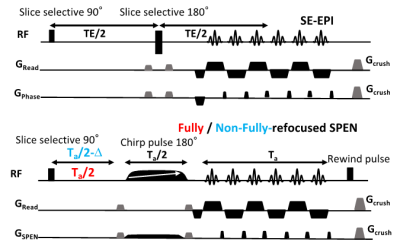
Figure 1: Representative
Spin Echo EPI (top) and Fully/Non-Fully-Refocused SPEN (bottom) acquisitions
used in this study. The latter included a 180˚ chirp pulse acting in the
presence of a gradient that encodes the more artifact-prone, low bandwidth
dimension, and lasts half the duration of the readout acquisition train Ta. This is preceded by a pre-encoding delay; if
set to Ta/2 full-refocusing is achieved, and T2*
effects are largely attenuated (red); if set to a shorter time (blue) a T2*
weighting is partially reintroduced.
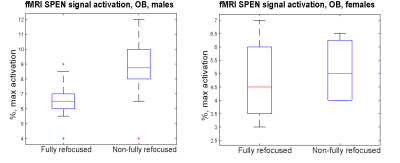
Figure 5: Box-whiskers plots describing the maximal signal activation
observed for the mice examined by SPEN in this work.
-
High Resolution EPI-based rs-fMRI Performed at 21.1 T
David C. Hike1,2, Lauren C. Daley1,2, Frederick A Bagdasarian1,2, Shannon Helsper1,2, and Samuel Colles Grant1,2
1National High Magnetic Field Laboratory, Florida State University, Tallahassee, FL, United States, 2Chemical & Biomedical Engineering, FAMU-FSU College of Engineering, Tallahassee, FL, United States
This work utilizes resting
state fMRI and graph theory as methods for detecting functional changes following
a middle cerebral arterial occlusion model. Segmented EPI were acquired at 21.1
T out to 21 d post ischemia to assess resting state activation and correlated neural
regions.
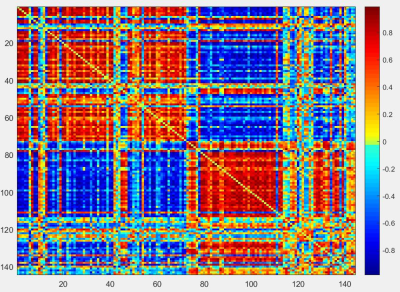
Figure 3: Correlation matrix of rs-fMRI data. This figure shows an adjacency matrix
of the 144 nodes where red indicates a positive correlation and blue indicates
a negative correlation. Nodes from 1-72 are located on the left side of the
brain while nodes 73-144 are located on the right side of the brain. Correlations
can be seen generally split by hemisphere. Positive correlations tend to appear
within hemispheres while negative correlations appear across hemispheres.
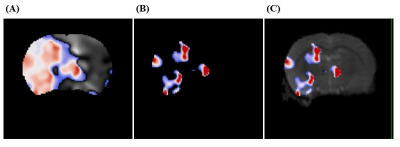
Figure
2: Activation map of
filtered and corrected data highlighting the areas of activation, informed by
the anatomical ROI identification. (A) all rs-fMRI signals detected (red
= higher intensity), whereas (B) displays only the areas of highest
intensity after removal of residual noise. (C) activation data overlaid
on original EPI with the areas of activation to identify anatomical regions of interest.
-
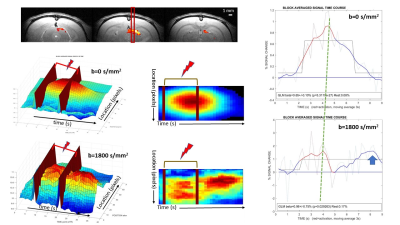
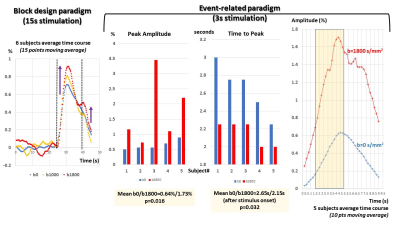
Comparison of 2D-EPI, 3D-EPI and ERASE in terms of physiological noise, SNR and tSNR
Jae-Kyun Ryu1,2 and Jang-Yeon Park2,3,4
1Biomedical Institute for Convergence at SKKU, Sungkyunkwan University, Suwon, Korea, Republic of, 2Center for Neuroscience Imaging Research, Institute for Basic Science, Suwon, Korea, Republic of, 3Department of Biomedical Engineering, Sungkyunkwan University, Suwon, Korea, Republic of, 4Department of Intelligent Precision Healthcare Convergence, Sungkyunkwan University, Suwon, Korea, Republic of
ERASE sequence showed better tSNR than 2D and 3D GE-EPI, whereas it provided
intermediate SNR between them. ERASE showed less physiological noise
contribution (σP/σ0
and l)
than both 2D and 3D GE-EPI.
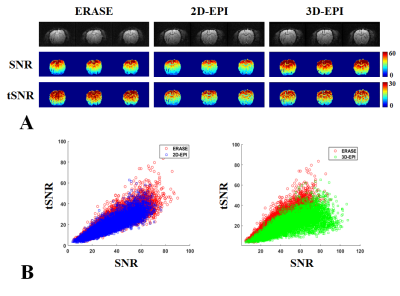
Figure2. (A) show SNR and tSNR maps from
2D/3D-EPI (blue/green squares) and ERASE (red circles) in the color scale range between 0~60 and 0~30. As shown in (B) where
total voxel values of tSNR and SNR were scatter plotted. SNR: signal-to-noise ratio, tSNR: temporal SNR, error bars
by ±
standard error of mean (SEM).
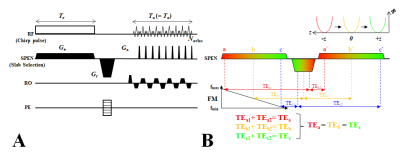
Figure1. ERASE
sequence diagram (A) and schematic
description of its sequential and local excitation and refocusing mechanism in
the SPEN direction (B). In the ERASE
sequence, the excitation duration of the chirp pulse (Te) is
set to be same as total acquisition duration (Ta) and, with a
re-phasing gradient between them, all spins experience constant TE across an
object (B). SPEN is applied for slab encoding in the slab-selective direction.
Ge: excitation gradient, Ga: acquisition
gradient, Gr: re-phasing gradient, RO: read-out, PE: phase-encoding,
FM: frequency-modulation.
-
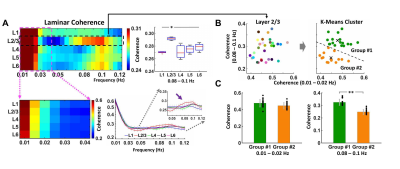
Denoise functional magnetic resonance imaging with variance-stabilizing transformation and optimal singular value shrinkage (VST-SVS)
Wei Zhu1, Xiaodong Ma1, Xiao-Hong Zhu1, Kamil Uğurbil1, Wei Chen1, and Xiaoping Wu1
1University of Minnesota, Minneapolis, MN, United States
Our method when used to denoise single-run fMRI data
enhances the performance for estimation of BOLD activations to a level
comparable to what is achievable with averaged 20 runs but using conventional
Gaussian smoothing.
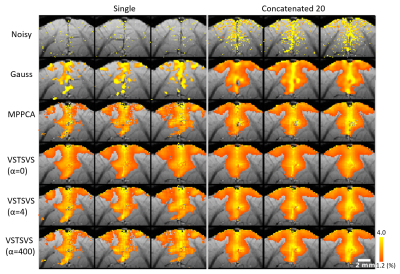
Fig. 4 In-vivo
experiment: comparing denoising performances for VST-SVS vs Gaussian smoothing
(Gauss) vs MPPCA in terms of BOLD percent change. Note that the proposed
VST-SVS method outperformed the conventional Gaussian smoothing when both used
to denoise a single run, increasing activation areas to a level visually
comparable in size to what was achievable with Gaussian smoothing but using all
20 runs.
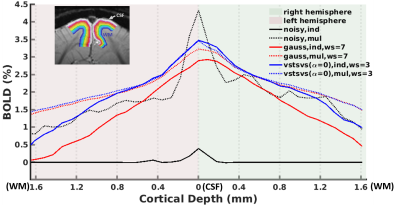
Fig. 5 In-vivo experiment: laminar BOLD profiles are shown for both
hemispheres and are displayed for noisy data (black lines), Gaussian smoothing
(red lines), and VST-SVS (α=0,
patch averaging) (blue lines) derived from either single run (ind,
solid lines) or concatenated 20 runs (mul, dashed lines). Note that the use of
VST-SVS to denoise a single run gave rise to a laminar profile comparable to
that achievable with 20 runs using conventional Gaussian smoothing.
-
Enhanced conventional and ultrafast responses in preclinical functional MRI using MP-PCA denoising
Francisca F. Fernandes1, Rita Gil1, Jonas L. Olesen2,3, Sune N. Jespersen2,3, and Noam Shemesh1
1Champalimaud Research, Champalimaud Centre for the Unknown, Lisbon, Portugal, 2Center of Functionally Integrative Neuroscience (CFIN) and MINDLab, Department of Clinical Medicine, Aarhus University, Aarhus, Denmark, 3Department of Physics and Astronomy, Aarhus University, Aarhus, Denmark
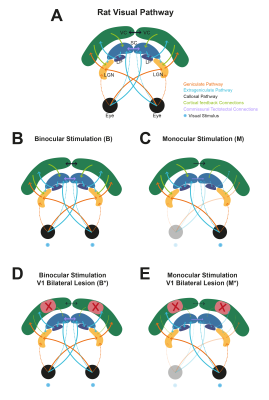
MP-PCA denoising increased the sensitivity of fMRI towards BOLD signal changes in response to visual stimulation in the mouse as well as the tSNR of the measurements, thereby improving the capacity of BOLD fMRI to image brain activity.
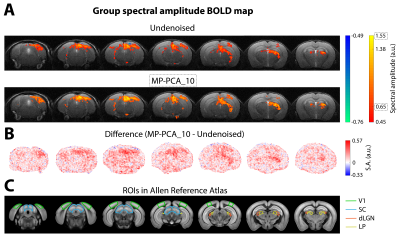
Fig. 3 – Group conventional fMRI results (n=3). (A) Group BOLD Fourier maps computed from data of 9 individual scans without denoising (top) and after MP-PCA_10 denoising (bottom). (B) Difference of spectral amplitude maps at the fundamental frequency between MP-PCA_10 and undenoised data. (C) Regions of interest (ROIs) of the mouse visual pathway delineated on the Allen Reference Atlas.
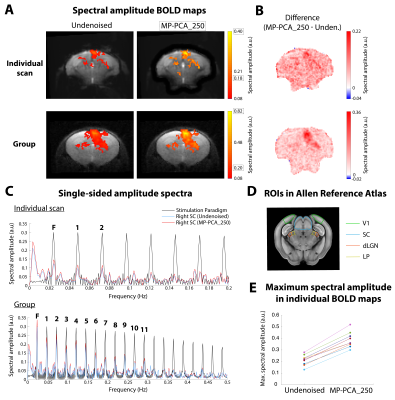
Fig. 4 – Ultrafast fMRI results. (A) Individual (top) and group (bottom, n=3, 9 scans) BOLD Fourier maps from ultrafast data, before and after MP-PCA_250 denoising. (B) Difference between spectral maps. (C) Amplitude spectra from the stimulation paradigm and from the right SC’s signal, using undenoised and MP-PCA_250 data from an individual scan (top) or all scans (bottom). (D) ROIs in the oblique brain slice. (E) Variation of maximum spectral amplitude in 9 individual maps with denoising.
-
High Resolution Functional Mapping of Orientation Domains in the Cat Visual Cortex using Denoising with NORDIC
Shinho Cho1, Steen Moeller1, Mehmet Akçakaya2, Logan Dowdle1, Luca Vizioli1, Djaudat Idiyatullin1, Wei Chen1, and Kâmil Uğurbil1
1Center for Magnetic Resonance Research and Department of Radiology, University of Minnesota, Minneapolis, MN, United States, 2Center for Magnetic Resonance Research and Department of Electrical and Computer Engineering, University of Minnesota, Minneapolis, MN, United States
NORDIC denoising to suppress thermal noise in zero-mean
Gaussian distribution, yielding improved functional CNR and T-statistics with
minimal increase in spatial smoothing and equivalent results in the signal
stability of 3-4 times averaging of single fMRI acquisition.
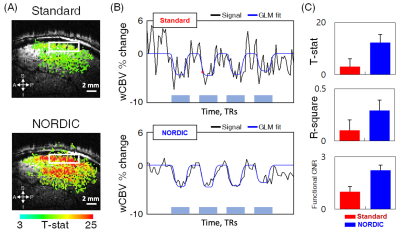
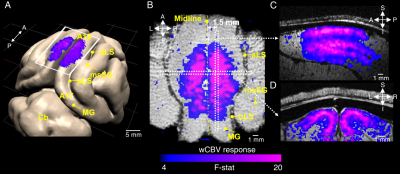
Fig.
1. wCBV fMRI results improved by NORDIC denoising. (A) wCBV activation map (T-statistics (T ≥ 3), sagittal slice, single subject) induced by stimuli.
(B) The mean time course from the region-of-interest (ROI) denoted by white
rectangles in (A); stimulus-induced wCBV signal changes shown during
stimulus on epochs (blue/gray rectangles). The raw EPI signal times series
(black) is shown together with the GLM fit (blue). (C) Effect of NORDIC on
the average T-stats in the
region-of-interest (ROI), R-square, and functional CNR; the error
bars are SEM.
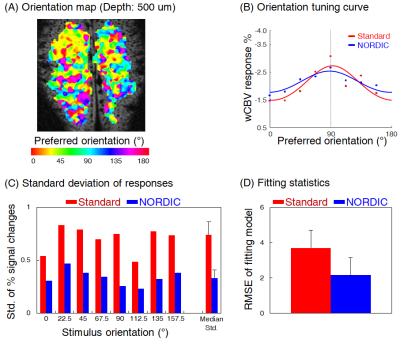
Fig. 4. Orientation preference
mapping and statistics improved before and after NORDIC denoising. (A) Orientation preference mapped by NORDIC denoised wCBV responses to
8-orientation (single subject); colors indicate the orientation
preference in degree. (B) Representative tuning curve of a single voxel before-
(red) and after-NORDIC denoising (blue). (C-D)
The standard deviations of multiple wCBV responses repeatedly measured and goodness-of-fit of curve fitting (root-mean-square-error) were compared between before and after NORDIC denoising.
-
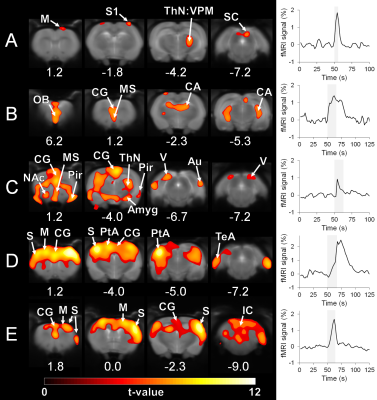
Automatic detection of BOLD oscillations in the anesthetized brain
Henriette Lambers1, Lydia Wachsmuth1, Ping Zheng1, and Cornelius Faber1
1Translational Research Imaging Center, Clinic for Radiology, University Hospital Muenster, Muenster, Germany
We developed a detection tool for
periodic BOLD oscillations in fMRI data with a detection specificity of 96 %
. Analysis of high temporal resolution rat fMRI data showed that
BOLD oscillations occur brain wide during long-term anaesthesia, which should
be considered for brain network analyses.
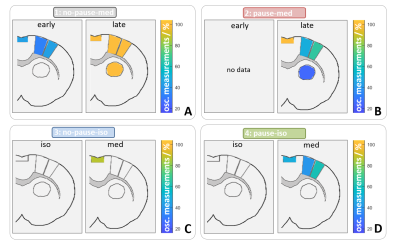
fig. 5: Color coding for number of measurements that showed
oscillations for resting state. Regions in which at least 20 % of the data
showed oscillation are shown for the right hemisphere at bregma 1.0. For group
1 and 2 (A and B), data was separated into early (first 3 hours) and late. Only
late datasets showed oscillations in all regions. In group 3 and 4 (C and D), oscillation
occurred not under isuflurane, but under medetmidine in cortical regions.
Stimulation data showed similar results.
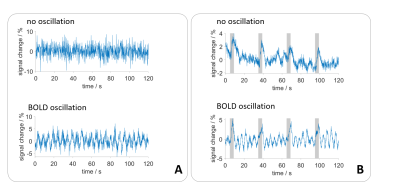
fig. 1: Exemplary time courses without and with BOLD
oscillations for both, (A) resting state and (B) electrical paw stimulation.
Stimulation phases are indicated by a grey bar.
-
Global Signal vs. Global Noise in Rat rs-fMRI
Nmachi Anumba1,2, Wenju Pan1,2, Eric Maltbie1,2, and Shella Keilholz1,2
1Biomedical Engineering, Emory University, Atlanta, GA, United States, 2Biomedical Engineering, Georgia Institute of Technology, Atlanta, GA, United States
We performed a voxel-wise analysis of the BOLD global signal in rat rs-fMRI and found that contributions to the global signal are not uniformly distributed throughout the brain. We also compared the signal to nonneural tissue and found that it contains attributes that are unique to the brain.
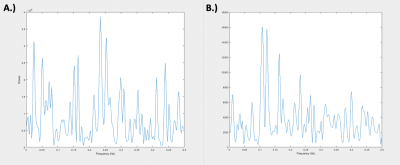
Figure 1. Averaged Global Signals for Muscle and Brain. A.) Shows the frequency power spectrum of the averaged brain global signal of 49 scans, each 10 minutes in length, taken across 8 rats. B.) Shows the frequency power spectrum of the averaged muscle “global signal” of 49 scans, each 10 minutes in length, taken across 8 rats. It is important to note the relative difference in magnitude between the two signals with the muscle global signal displaying much lower power.
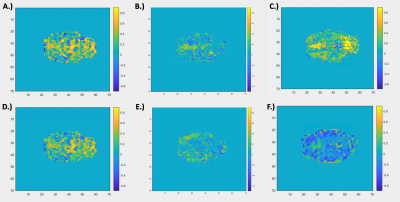
Figure 2. Voxel-wise Correlation to Brain and Muscle Global Signal. Panels A – C show a voxel-wise map of Pearson correlation coefficients for 3 individual rats for which the timecourse of each voxel was compared to the global signal of the brain. Panels D – E show the same analysis comparing voxels to the “global signal” of the muscle. Panels D – E display the same rat and slice number as the corresponding panel in the first row (A – C, respectively). Correlation values for muscle to brain global signals for each rat, from left to right, were R = 0.7313, R = -0.0839, and R = -0.1345, respectively.
-
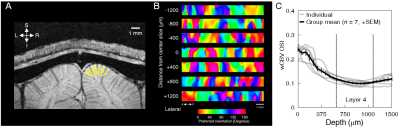
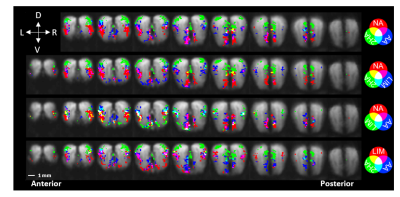
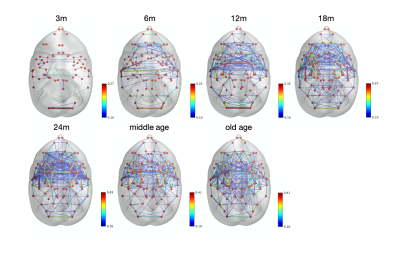
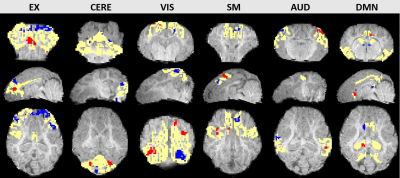
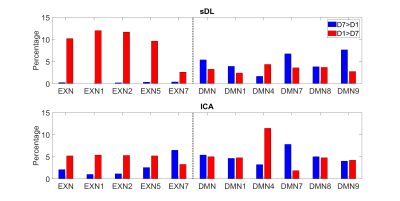
Accurate Brain Parcellation of Individual Marmosets Based on Awake Resting-State fMRI Data and Deep Neural Networks
Xiaoguang Tian1, Zhifeng Liang2, Afonso C Silva1, and Cirong Liu2
1Dept. of Neurobiology, University of Pittsburgh, Pittsburgh, PA, United States, 2Institute of Neuroscience, Chinese Academy of Sciences, Shanghai, China
Our new parcellation pipeline and classifier provides
significant improvements over existing parcellation methods, and can be a useful
tool to understand the structural and functional architecture of the primate cerebral
cortex and its variability across individuals.
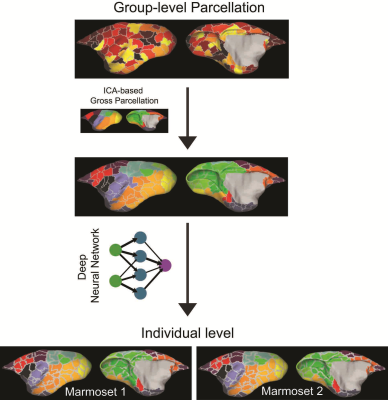
Visual
outline of analysis methods
-
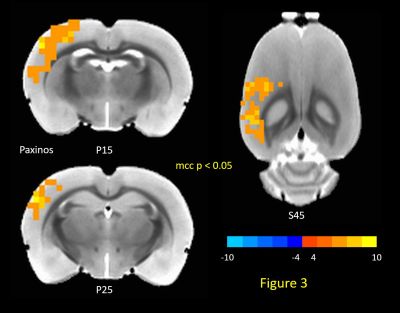
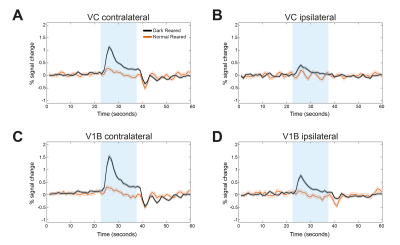
Functional cerebral blood volume imaging of the mouse visual cortex using vascular space occupancy
Naman Jain1, Atena Akbari1, Markus Barth1,2, and Kai-Hsiang Chuang1,3
1Centre for Advanced Imaging, The University of Queensland, Brisbane, Australia, 2School of Information Technology and Electrical Engineering, The University of Queensland, Brisbane, Australia, 3Queensland Brain Institute, The University of Queensland, Brisbane, Australia
We tested the feasibility of CBV - weighted VASO fMRI in mouse models and results sho that it is possible to do VASO in mouse. An expected negative signal change was observed as reported in the literature.
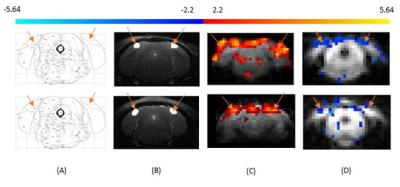
Figure
1: Primary visual cortex is specified with reference to
Paxinos and Franklin Mouse Brain Atlas (Figure 1A), V1 is marked with orange
arrows in T2-weighted structural scan (Figure 1B). Primary visual cortex
indicated by the arrows. (C) BOLD and (D) VASO functional maps of mouse primary
visual cortex. Row 1 (Top) and Row 2 (Bottom) are the results acquiried from
two different mice.
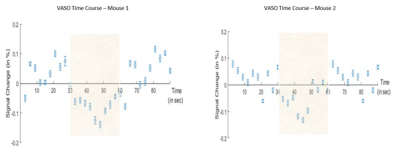
Figure 2: VASO signal time course of averaged across all
stimulation blocks (shaded area) of 4 runs for 2 different mice, errorbars
represents the standard error of mean.
-
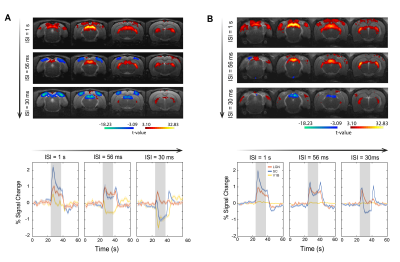
Combined RS-fMRI and calcium recordings show stabile brain states in mice after switching anesthetic regimen
Bruno Pradier1,2, Lydia Wachsmuth1, Daniel Segelcke2, Nina Nagelmann1, Esther Pogatzki-Zahn2, and Cornelius Faber1
1Department of Clinical Radiology, University Hospital Münster, Münster, Germany, 2Department of Anesthesiology, University Hospital Münster, Münster, Germany
We find that brain states quickly reach a
steady state after switching anesthetic regimen. We show that most changes in
functional connectivity were relative to the initial isoflurane anesthesia. We
conclude that brain states and networks are stable from 30min after switching
anesthetics.
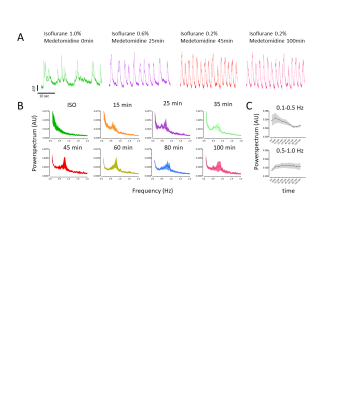
Calcium recordings show different brain
states in S1HL depending on anesthetic condition. (A) Under ISO anesthesia,
calcium transients show frequent UP-DOWN transitions (green) while changing to
a persistent state at 25 (purple), 45 (red), and 100 (pink) minutes after
switching to ISO/MED anesthesia. (B) Fourier-transformed calcium transients
show an emerging peak between 0.5Hz and 1.0 Hz 15 to 100 minutes after
switching anesthetic regimens. (C) Frequencies of calcium transients between
0.1-0.5Hz decreased (p=0.002), while frequencies from 0.5-1.0Hz increased (p=0.02).
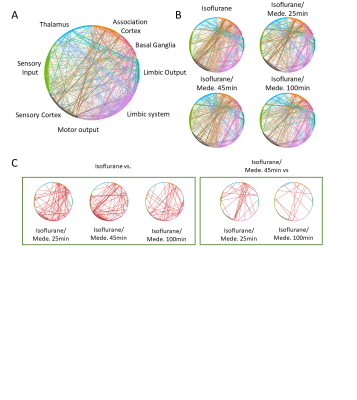
Changes in functional connectivity were
mostly related to a decrease in ISO concentration. (A) Circular network
representation. Each dot represents a brain region, color codes functional
groups, and lines represent functional connectivity based on pearson’s
correlation coefficient. (B) Averaged networks for each group. (C) Differences
in networks, obtained from statistical analysis of ISO vs. later time points
(left panel) and ISO/MED 45 min vs. ISO/MED 25min and ISO/MED 100 min (right panel).
-
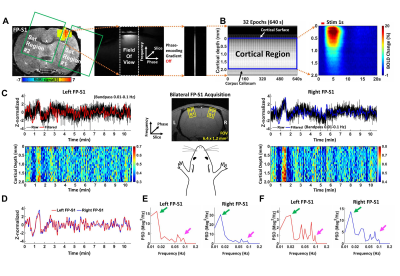
Optimize Simultaneous Multi-channel Calcium Recording and fMRI in Mouse Brain
Shabnam Khorasani Gerdekoohi1, Pankaj Sah2, and Kai-Hsiang Chuang1,3
1Queensland Brain Institute, Brisbane, Australia, 2Quuensland Brain Institute, Brisbane, Australia, 3Center for Advanced Imaging, Brisbane, Australia
This study established a method to measure high quality BOLD and calcium
activation in mouse with multiple implants. This enables studying functional
connectivity in the future.
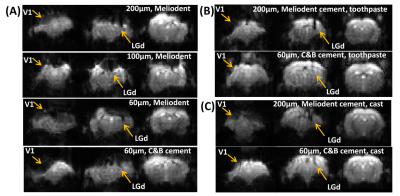
Fig.1. GE-EPI of the
mouse brain. Susceptibility artefacts under different combinations of fiber
diameters (200/100/60 µm) and dental cements (Meliodent/C&B), with (A) no
covering materials, (B) toothpaste, or (C) kwik-cast.
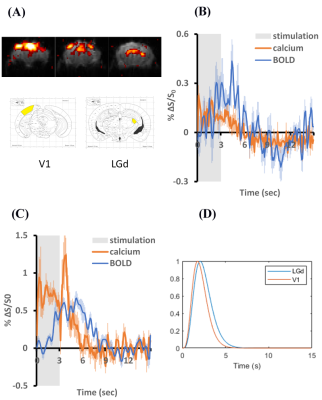
Fig.3. Calcium and BOLD
responses under visual stimulation. (A) BOLD activation map (top
panel), stereotaxic coordinates of targeted regions for injecting GCaMP6f
(bottom panel). (B) LGd (n=3
scans), and (C) V1 (n=6 scans) activations, (D) Transfer
functions calculated from the averaged BOLD and calcium signals.
-
Dynamic Functional Connectivity of Focused Ultrasound-induced Neuromodulation in Normal Rat Model
Yu-Chieh Hung1, Yi-Cheng Wang1, Hao-Li Liu2, and Hsu-Hsia Peng1
1Biomedical Engineering and Environmental Sciences, National Tsing Hua University, Hsinchu, Taiwan, 2Electrical Engineering, National Taiwan University, Taipei, Taiwan
We quantitatively evaluated
the evolution of altered probability% of dynamic functional connectivity in
seven states at Pre-focused ultrasound (FUS), FUS-35min, and FUS-3hr, suggesting the potential of FUS-neuromodulation.
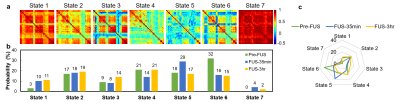
Figure
3. (a) The
correlation coefficients
of 7 centroids represented 7 states of dynamic functional connectivity of Pre-FUS,
FUS-35min, and FUS-3hr groups. (b,c) The
bar charts and spider chart illustrated the probability of 7 states occurring
in each group.
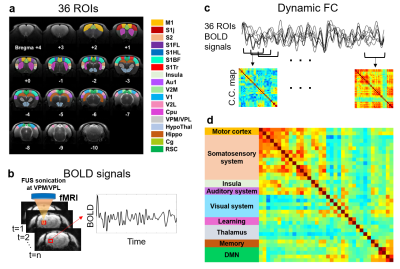
Figure
1. The flow chart of computing correlation
coefficients of
functional connectivity maps. (a) The determined 36 ROIs of rat brain. (b) Extracting BOLD signal from each
ROI. (c)
To evaluate
dynamic FC maps,
a sliding window method was performed to calculate Pearson’s
correlation coefficients between 36 ROIs.
(d) 36 ROIs were divided into 9 groups on FC map.
-
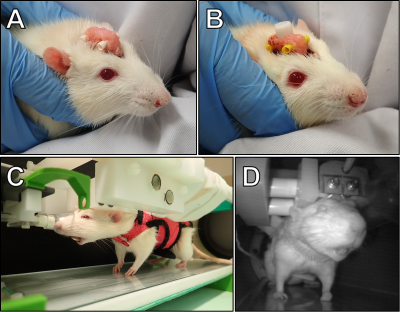
Restraint System for Motion Reduction in MRI studies of Awake Mice
Derek Prusener1, Maysam Nezafati1, Gloria Perrin Clavijo1, and Shella Keilholz1
1Biomedical Engineering, Emory University/Georgia Institute of Technology, Atlanta, GA, United States
We designed a head restraint system for image acquisition in awake mouse fMRI studies that minimized head motion. The system consists of a head implant, combined with a customized cradle and head holder.
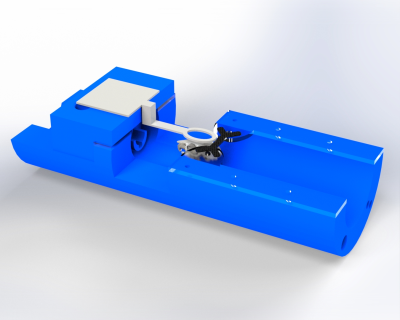
A rendering of the cradle assembly with coil
holder, coil, acrylic pieces, and X-shaped head-bar. A rendering of a mouse skull is
inserted to show scale.
Renderings of the I-shaped (left) and
X-shaped (right) head-bar designs. Both head-bars are fabricated out of carbon fiber.
-
Extra low dose pancuronium bromide for fMRI improves survival and recovery times while suppressing translational motion
Muhammad Danial Afiq Bin Abdullah1, Isaac Huen1, Redha Boubertakh1, Xing Qi Teo1, and Kuan Jin Lee1
1SBIC, Agency for Science, Technology and Research (A*STAR), Singapore, Singapore
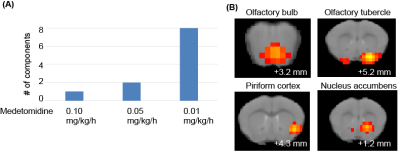
Reducing the infusion dose of pancuronium bromide to 0.05 mg/kg/h in mouse fMRI improves survival while suppressing translational motion.
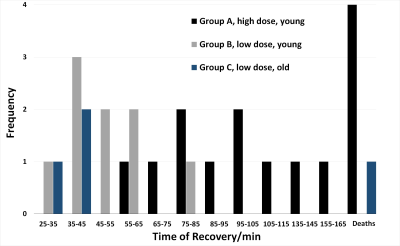
Histogram of mice recovery duration
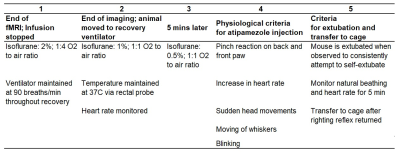
Animal recovery timeline. A description of the animal recovery process from the end of fMRI scans
-
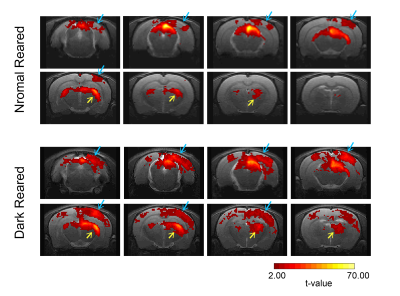
Light sedation with short habituation time for large-scale fMRI studies in rat
Lenka Dvořáková1, Petteri Stenroos1, Ekaterina Zhurakovskaya1, Raimo Salo1, Jaakko Paasonen1, and Olli Gröhn1
1A.I.V. Institute for Molecular Sciences, University of Eastern Finland, Kuopio, Finland
The aim of this study was to investigate a light sedation pre-clinical fMRI protocol with a
short habituation period. We found that apart from slightly modified thalamic
connectivity light sedation provides results comparable to the data obtained in the awake state.
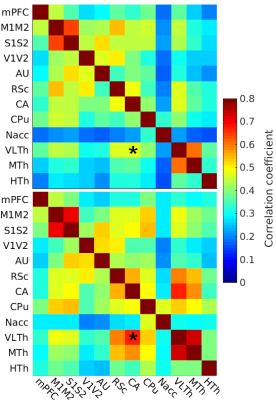
Fig 1: The
FC of light sedated animals (top, N = 102) and awake (bottom, N = 10) were
compared with the FDR-corrected studentized permutation test, *p<0.05; medial
prefrontal cortex (mPFC), motor cortex (M1M2), somatosensory cortex (S1S2), visual
cortex (V1V2), auditory cortex (AU), retrosplenial cortex (RSc), hippocampus (CA),
striatum (CPu), nucleus accumbens (Nacc), ventrolateral thalamus (VLTh), medial
thalamus (MTh), hypothalamus (HTh).
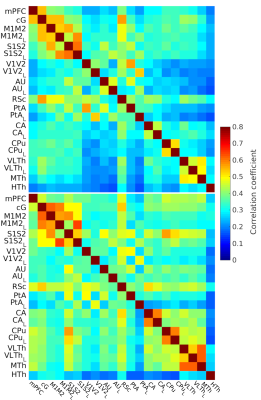
Fig 2: The
FC of on-site measured light sedated animals (top, N = 100) and data from
awake rat database (bottom, N = 159). ROI annotations are the same as in Fig 1 with the addition of the cingulate cortex (cG). The bilateral ROIs are denoted by L and R for the left and right sides
respectively.