-
How to Benchmark DSC-MRI: the technical development of an anthropomorphic phantom for software validation
Laura C. Bell1, Natenael B Semmineh1, Sudarshan Ragunathan1, and C. Chad Quarles1
1Barrow Neurological Institute, Phoenix, AZ, United States
The technical development of a DSC anthropomorphic phantom enables image analysis and software platform validation. To demonstrate its applicability, this newly developed phantom is used to benchmark two different leakage correction methods.
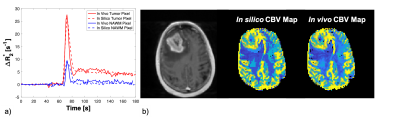
Figure 2: An example of matched ∆R2*(t) curves between in vivo and in silico data within a tumor and NAWM pixel (Fig 2a) and the corresponding anatomical T1-weighted and CBV maps (Fig 2b).

Table 1: Preliminary data demonstrating the ability to use the DRO as a benchmark for leakage correction algorithms. Using the consensus acquisition protocol, we computed CBV for an intact-BBB and a disrupted-BBB. We chose two leakage correction methods to compare for CBV calculation: Boxerman-Schmainda-Weisskoff (BSW) and the gamma-variate (GV) methods. Using our ground truth CBV maps, we can compute the concordance correlation coefficient (CCC) between various estimated CBVs across the 10,000 pixels.
-
Reproducibility and Validation of Water Permeability in Human Brain using Magnetization Transfer based ASL at 7T
Sultan Zaman Mahmud1,2, Thomas S. Denney1,2, and Adil Bashir1,2
1Department of Electrical and Computer Engineering, Auburn University, Auburn, AL, United States, 2Auburn University MRI Research Center, Auburn University, Auburn, AL, United States
Blood-brain barrier (BBB) plays very important role in protecting the brain tissue and regulates the exchange of water from intra to extravascular space. This study demonstrates the reproducibility and validation of a non-invasive technique to assess the BBB using the MT effect on ASL signal.
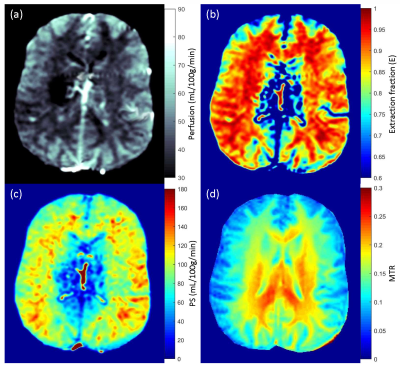
Figure 1:
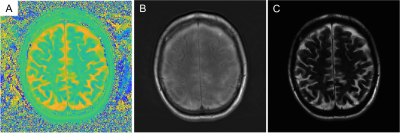
Perfusion (a), water extraction fraction (b), permeability surface area product
(c) and magnetization transfer ratio (d) maps from one control subject.
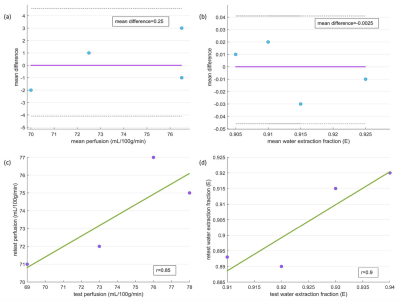
Figure 2: Bland-Altman
plots for test-retest results for perfusion (a) and water extraction fraction
(b). Correlation plots for test-retest results for perfusion (c) and extraction
fraction (d).
-
Cross-Vendor Test-Retest Analysis of 3D pCASL Cerebral Blood Flow
Kay Jann1, Xingfeng Shao1, Samantha J Ma1,2, Karl G Helmer3, Michael Magaletta3, Mitchell J Horn4, Andrew D Warren4, Vanessa A Gonzalez4, Hanzhang Lu5, Yang Li5, Zixuan Lin5, Kaisha Hazel5, George Pottanat5, and Danny JJ Wang1
1Laboratory of Functional MRI Technology (LOFT), USC Stevens Neuroimaging and Informatics Institute, Keck School of Medicine, University of Southern California (USC), Los Angeles, CA, United States, 2Siemens Medical Solutions USA, Inc., Los Angeles, CA, United States, 3Department of Radiology, Massachusetts General Hospital and Athinoula A Martinos Center for Biomedical Imaging, Harvard Medical School, Charlestown, MA, United States, 4Department of Neurology, Massachusetts General Hospital and Athinoula A Martinos Center for Biomedical Imaging, Harvard Medical School, Charlestown, MA, United States, 5The Russell H. Morgan Department of Radiology & Radiological Science, Johns Hopkins University School of Medicine, Baltimore, MD, United States
Standardized 3D background suppressed pCASL scans were performed on a traveling cohort of 10 volunteers. Regional CBF can be reliably estimated across four major MR vendor platforms when accounting for differences in global CBF.
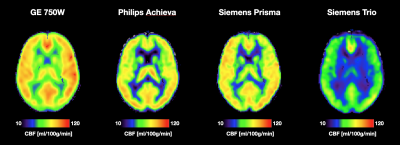
Figure 1: Average CBF maps for all four scanner platforms. All maps are scaled the same which makes the baseline difference in global CBF calculation evident. The perfusion pattern however looks consistent across scanners.
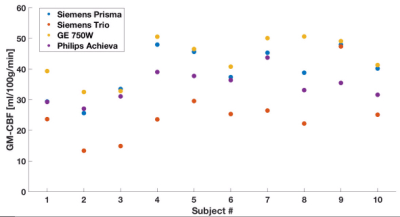
Figure 2: Gray Matter CBF
for each participant and site, highlighting scanner platform bias as
well as covariation of CBF measurements across subjects despite the
global bias.
-
Velocity-Selective Inversion prepared Arterial Spin Labeling: Examination in a Commercial Perfusion Phantom
Feng Xu1,2, Dan Zhu3, Hongli Fan2,3, Hanzhang Lu1,2, Dapeng Liu1,2, Wenbo Li1,2, and Qin Qin1,2
11The Russell H. Morgan Department of Radiology and Radiological Science, Johns Hopkins University, Baltimore, MD, United States, 2F.M. Kirby Research Center for Functional Brain Imaging, Kennedy Krieger Institute, Baltimore, MD, United States, 3Biomedical Engineering, Johns Hopkins University, Baltimore, MD, United States
Velocity-selective inversion (VSI)
prepared arterial spin labeling was examined using a commercial perfusion phantom. Careful selection of
velocity-encoding directions along the major feeding arteries is recommended
for VSASL applications to attain optimal labeling efficiency.
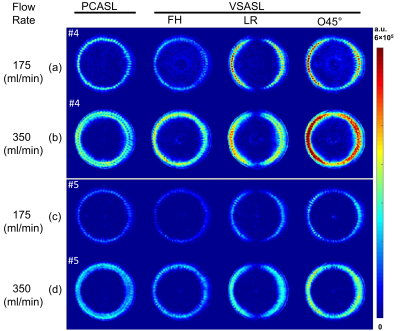
Figure 3. ASL difference images of the slice #4 (a-b)
and #5 (c-d) at flow rates of 175 (a) and 350 (b) mL/min. The slice
#4 is at the second layers of porous material with 60 channels extended axially
(off-center) in a circle. These 60 channels stop prior to slice #5. PCASL (1st
column), VSASL using encoding directions of foot-head (FH, 2nd column),
left-right (LR, 3rd direction) and oblique 45° (O45°, 4th column).
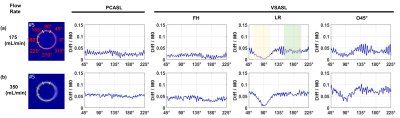
Figure
4. Ring ROIs and their normalized difference of slice #5 as a function of
angular locations at flow rates of (a) 175 and (b) 350 mL/min, respectively.
Normalized difference signal was averaged along the radius direction at every
0.5° from 0° to 360°. Half circle signal ranging from 45° to 225° was displayed
for PCASL, VSASL with encoding directions of FH, LR and O45°. Green and yellow bars
on the ring ROIs, corresponding to the green and yellow shades centered around 180°
and 90° angles in VSASL (LR), indicate left and top sectors selected for
labeling efficiency estimation in Figure 5.
-
A separate RF Neck Coil for Arterial Spin Labeling at 7T MRI
Salem Alkhateeb1, Tales Santini2, Tiago Martins2, nadim farhat2, and Tamer S. Ibrahim2
1Bioengineering, University of Pittsburgh, Pittsburgh, PA, United States, 2University of Pittsburgh, Pittsburgh, PA, United States
A dedicated labeling coil for arterial spin labeling (ASL) technique can alleviate the challenges at 7T MRI, in this work we propose a separate 16-channel RF neck coil for transmit only. Finite-difference time-domain (FDTD) simulations and RF shimming have demonstrated the feasibility of this design to produce a homogeneous B1+ fields in the labeling region (left and right common carotid arteries) while minimizing SAR to within safe limits.
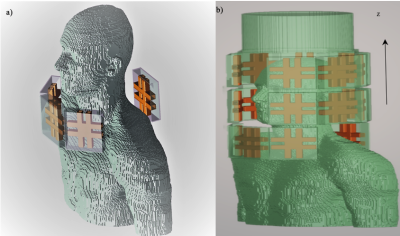
Figure (1), In a) The arrangement of the neck coil alone around the neck of Duke model. In b) Configuration of the single system to be simulated.
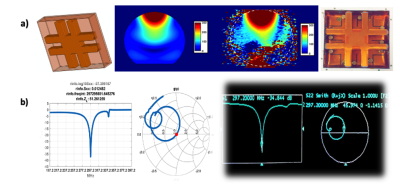
Figure (2): Simulation data vs Experimental data. In (a) left, B1 simulation on a shperical phantom using the FDTD software, in (a) right, an actual B1 map from an MRI scanner after implementing the same shim. In (b) left, simulation of tuning and matching of a TTT panel, in (b) right, actual tuning and matching measurements of TTT panel on network analyzer
-
Increased labeling efficiency with Maxmin pTx B1+ shimming for pseudo-continuous Arterial Spin Labeling at 7T
Kai Wang1, Samantha J Ma2, Xingfeng Shao1, and Danny JJ Wang1
1University of Southern California, Los Angeles, CA, United States, 2Siemens Medical Solutions USA, Inc, Los Angeles, CA, United States
The Maxmin transmit B1 shimming implemented with parallel transmission for the labeling of the pseudo-continuous Arterial Spin Labeling sequence is a promising approach to increase the labeling efficiency.
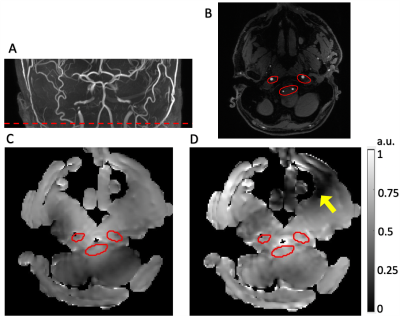
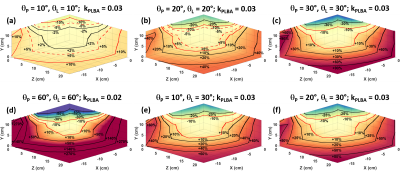
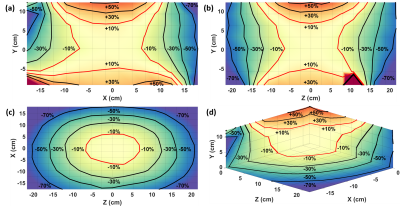
Figure 3 (A) The location of the labeling plane (red dashed line) shown on the Maximum Intensity Projection in the coronal view of the Time-of-Flight sequence. (B) The ROI was manually drawn on the Time-of-Flight image to cover the four inflow arteries (left and right Vertebral Arteries and left and right Internal Carotid Arteries). The simulated combined B1+ field of the (C) Bcg shimming and the (D) Maxmin shimming. The minimum B1+ amplitude within ROI was increased by 58% for Maxmin shimming. A dark band formed (yellow arrow), which would not affect the labeling efficiency.
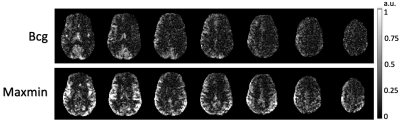
Figure 4 Perfusion map acquired by pCASL sequences with labeling of Bcg shimming and Maxmin shimming. Increased perfusion was observed for Maxmin shimming. The top and bottom slices were discarded since they were cropped during preprocessing of motion correction.
-
Blood flow measurements in diabetic kidney disease: A comparison of phase contrast, arterial spin labelling and dynamic contrast enhanced MRI
Bashair Alhummiany1, David Shelley1,2, Margaret Saysell1,2, Maria-Alexandra Olaru3, Bernd Kühn3, David L. Buckley1, Julie Bailey2, Michael Mansfield2, Steven Sourbron4, and Kanishka Sharma4
1Department of Biomedical Imaging Sciences, University of Leeds, Leeds, United Kingdom, 2Leeds Teaching Hospitals, NHS Trust, Leeds, United Kingdom, 3Siemens Healthcare GmbH, Erlangen, Germany, 4Department of Imaging, Infection, Immunity and Cardiovascular Disease, The University of Sheffield, Sheffield, United Kingdom
Renal blood flow (RBF) from PC, ASL and DCE agreed well on average but agreement on the single-subject level is poor. Further optimization is required before renal perfusion measurements can be used in patient management
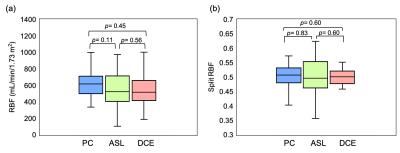
Figure 2 Box and whisker plots depicting distribution of RBF (a) and split-RBF (b) measured with PC-MRI, ASL and DCE-MRI. The p-values for pairwise comparisons of means are given above the plots.
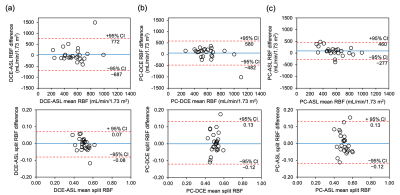
Figure 3 Bland-Altman plots comparing DCE-ASL (a), PC-DCE (b) and PC-ASL (c) for RBF (top panel) and split-RBF (bottom panel). Dashed lines indicate upper and lower 95% confidence intervals (CI) calculated as: mean difference ± 1.96 (SD). Solid lines represent the mean difference between two techniques.
-
High Temporal Resolution Wideband Dynamic Contrast-Enhanced Magnetic resonance imaging : The Mice Renal Function Study
Wei-Hao Huang1, Chia-Ming Shih1, Po-Wei Cheng1, and Jyh-Horng Chen1,2
1Graduate Institute of Biomedical Electronics and Bioinformatics, National Taiwan University, Taipei, Taiwan, Taipei, Taiwan, 2Interdisciplinary MRI/MRS Lab, Department of Electrical Engineering, National Taiwan University, Taipei, Taiwan, Taipei, Taiwan
In this study, we aim to combine dynamic contrast enhanced magnetic resonance imaging (DCE-MRI) and Wideband technique to improve temporal resolution. We compare the quantitative results to the conventional DCE and validate the feasibility of high temporal resolution Wideband DCE.
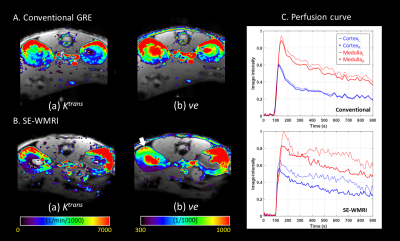
Figure2.
(A)(B) represent the result of conventional GRE and SE-WMRI respectively. In Ktrans maps, the cortex
region has higher values. (Ktrans
are 5544 and 5760 (1/min/1000) in conventional GRE and SE-WMRI.). In ve maps, the medulla area has high ve which is around 900 (1/1000)
(Conventional GRE: 929, SE-WMRI:898 (1/1000)) but it is lower in the white
arrow area. (C) shows the multi-region perfusion curves. The SE-WMRI curves are
inconsistent because of physiological differences which also correspond to quantitative analysis.
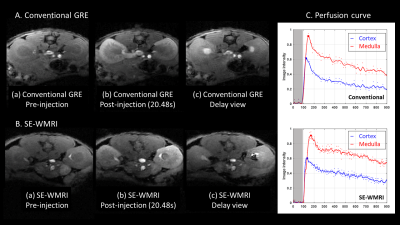
Figure1.
(A) demonstrates the three different stages of image result of conventional GRE.
Same as (A), (B) show the image result of SE-WMRI. (C) presents the perfusion
curves of conventional GRE and SE-WMRI. The image intensity is normalized to
the pre-injection image intensity and apply the Gaussian low-pass filter to
relieve the effect caused by motion. The blue line and red line represent the
cortex and medulla region and the dots are the original data. The time delay of
intensity peaks between the cortex and the medulla is 20.24s in conventional
GRE, 30.72s in SE-WMRI.
-
Free-breathing Renal Perfusion Imaging with Multi-Delay Arterial Spin Labeling Using Subspace-Based Fast MR
Paul Han1, Thibault Marin1, Yanis Djebra1,2, Georges El Fakhri1, Jinsong Ouyang1, and Chao Ma1
1Gordon Center for Medical Imaging, Department of Radiology, Massachusetts General Hospital and Harvard Medical School, Boston, MA, United States, 2LTCI, Télécom Paris, Institut Polytechnique de Paris, Paris, France
This work presents a subspace-based fast MR method for free-breathing multi-delay ASL imaging of the kidney. The feasibility of the proposed method is shown using in vivo data obtained from a healthy volunteer on a 3T MR scanner.
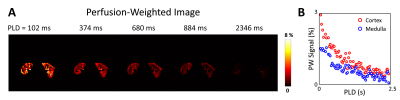
Figure 5. Perfusion-Weighted Image and Signal of
Kidney. A: Perfusion-weighted
images of the kidney over different PLD times. B: Mean perfusion-weighted
signal of the kidney cortex (red circle) and medulla (blue circle) over
different PLD times.
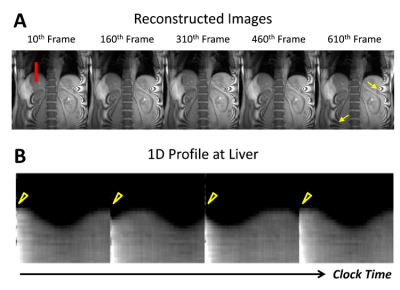
Figure 3. Results of reconstructed images over time. A: Reconstructed images at the 10th, 160th, 310th,
460th, and 610th frames. Yellow arrows indicate Moiré artifacts physically existing in the image due to the acquisition settings, which
are not originating due to subspace-based reconstruction. B: Evolution of 1D profile at the center of liver (red line in A) over clock time (frame rate 34 ms, frames 301 to 600). Notice the
change in liver position across time reflecting respiratory motion and the discontinuity in the liver position across time (yellow arrowhead) due to pCASL pulse.
-
Quantification of Relative Cerebral Blood Volume in Aging Collapsin Response Mediator Protein 1 Gene Knockout Mice
Tzu-Ming Hung1, Sheng-Min Huang2, Yun-Chieh Tsai3, Ting-Yu Chin4, and Hsu-Hsia Peng1
1Department of Biomedical Engineering and Environmental Sciences, National Tsing Hua University, Hsinchu, Taiwan, 2Institute of biomedical engineering and nanomedicine, National Health Research Institutes, Miaoli, Taiwan, 3Graduate Institute of Life Sciences, National Defense Medical Center, Taipei, Taiwan, 4Department of Bioscience Technology, Chung Yuan Christian University, Taoyuan, Taiwan
Mice deficient in collapsin response mediator protein 1 (CRMP-1) gene possessed significantly higher rCBV in the hippocampus than wild type mice, indicating the increased blood volume in the hippocampus of CRMP-1 knockout mice.
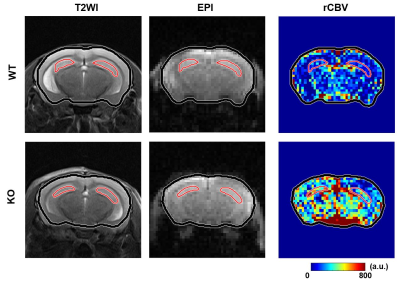
Figure
2. The T2WI, EPI, and rCBV
maps of a wild
type (WT) and a
knockout (KO) mouse
overlaid with hippocampus ROIs (red) and whole brain ROIs (black).
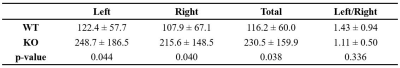
Table
1. The
mean rCBV
in left, right, and total (left + right) hippocampus and the ratio of rCBV
in left to right hippocampus in wild type (WT) and knockout
(KO)
mice.
-
Robust blood brain barrier integrity measurements in clinically significant short scan time
Amnah Mahroo1, Nora-Josefin Breutigam1, Jörn Huber1, and Matthias Günther1,2
1MR Physics, Fraunhofer MEVIS, Bremen, Germany, 2MR-Imaging and Spectroscopy, University of Bremen, Bremen, Germany
The proposed sampling scheme provides robust exchange time estimation as a measure of blood brain barrier integrity. Furthermore, we used time efficient Hadamard ASL accelerated 3D‐GRASE imaging sequence to reduce the ASL scan times to as short as 6 min.
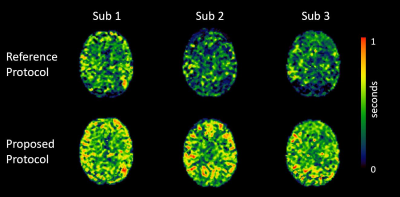
Figure 1:
Improved exchange time estimates. The proposed protocol provided improved
fitting of exchange time parameter for brain regions with longer ATTs such as
border zone areas.
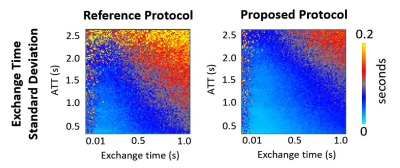
Figure 3:
Comparison of simulated exchange time standard deviation (SD) as a measure of estimate
error. By concatenating datasets of two different sub-bolus duration, the
resulting TIs provided lower exchange time estimate errors for later ATTs.
-
An increased Normal Appearing White Matter perfusion: a possible radiological inflammatory marker in relapsing-remitting multiple sclerosis
Caterina Lapucci1,2, Marco Fiorelli3, Annunziata Stefanile4, Silvana Zannino4, Maria Maddalena Filippi5, Antonio Cortese3, Carlo Piantadosi6, Marco Salvetti7, Matilde Inglese1,8, and Tatiana Koudriavtseva4
1DINOGMI, University of Genoa, Genoa, Italy, 2Department of Experimental Neurosciences, Ospedale Policlinico San Martino IRCCS, Genoa, Italy, 3Department of Human Neurosciences, Sapienza University of Rome, Rome, Italy, Rome, Italy, 4Department of Clinical Experimental Oncology, IRCCS Regina Elena National Cancer Institute, IFO, Rome, Italy, Rome, Italy, 5Fatebenefratelli Foundation, Afar Division, Fatebenefratelli Hospital, Isola Tiberina, Rome, Italy, Rome, Italy, 6Neurology Unit, San Giovanni-Addolorata Hospital, Rome, Italy, Rome, Italy, 7Department Of Neuroscience Mental Health And Sensory Organs (NEMOS), Sapienza University, Sant’Andrea Hospital, Rome, Italy, Rome, Italy, 8Department of Neurology, Icahn School of Medicine at Mount Sinai, New York, NY, USA/, New York, NY, United States
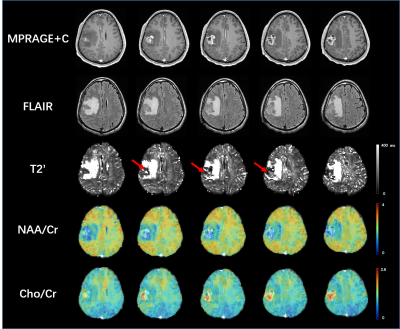
A hyperperfusion of the Normal Appearing White Matter
(NAWM) compared to FLAIR lesions was noted. The correlations between NAWM
perfusion, disease duration and 1-year ARR in remitting patients suggested that
an increased NAWM perfusion may be a radiological marker of inflammatory
activity.
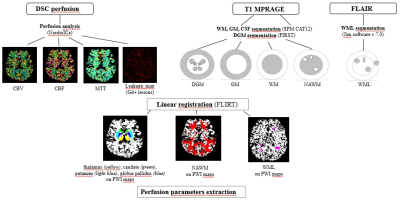
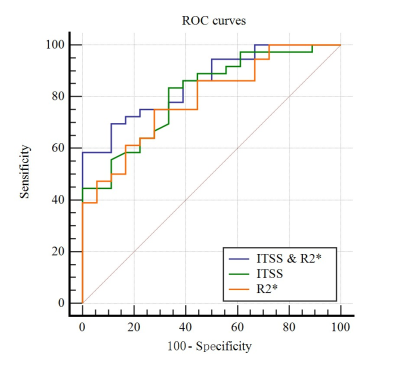
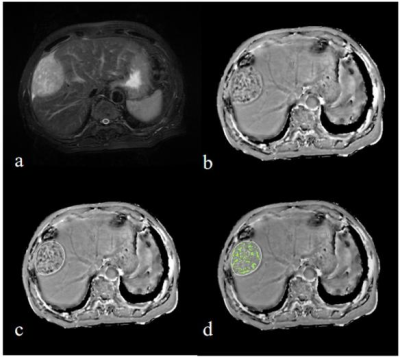
Fig.1 MRI analysis pipeline
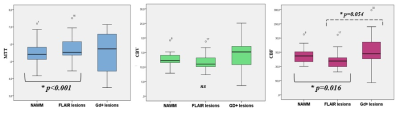
Fig.2 Differences in perfusion parameter among NAWM, FLAIR and GD lesions
-
Image Quality Optimization: DCE imaging of the Liver at 3T using a Continuously Acquired Radial Golden-angle Compressed Sensing Acquisition
Hui Liu1, Gaofeng Shi1, Qinglei Shi2, Weishuai Wang3, Jiangyang Pan1, and Yang Li1
1Fourth Hospital of Hebei Medical University, shijiazhuang, China, 2MR Scientific Marketing, Siemens Healthcare, beijing, China, 3CS, Services,, Siemens Healthcare, jinan, China
The
sequence that continuously acquired Golden-angle RAdial Sparse Parallel
acquisition employing compressed sensing reconstruction (“GRASP”) can acquire
high spatial and high temporal resolution as well as motion robustness to DCE
MRI in liver imaging. However, there are still some artifacts in abdominal
imaging, especially in the early arterial phase. In this study, we proposed an
optimization scheme which can significantly improve the image quality both
in plain and all enhanced phases, which
may have important value in the study of abdominal disease using GRASP based DCE
in future.
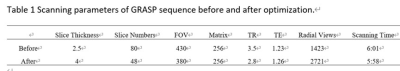
Table 1 Scanning parameters of GRASP
sequence before and after optimization.
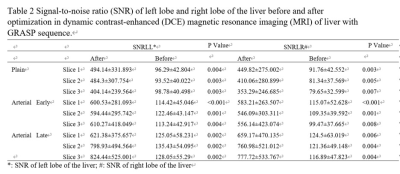
Table
2 Signal-to-noise ratio (SNR) of left lobe and right lobe of the liver before
and after optimization in dynamic contrast-enhanced (DCE) magnetic resonance
imaging (MRI) of liver with GRASP sequence.
-
Disentangling the heterogeneity of MCI condition by unsupervised clustering of brain measurements on ASL and T1w MR imaging
Paolo Bosco1, Laura Biagi1, Giovanni Cioni2, Michela Matteoli3, Alessandro Sale3, Nicoletta Berardi3, Michela Tosetti1, and the Train the Brain Consortium4
1FiRMLAB, IRCCS Stella Maris Foundation, Pisa, Italy, 2IRCCS Stella Maris Foundation, Pisa, Italy, 3Institute of Neuroscience of the CNR, Pisa, Italy, 4the Train the Brain Consortium, Pisa, Italy
A data-drive clustering approach on structural and
perfusion brain MR imaging on a cohort of 141 MCI subjects is able to
elucidate homogeneous structural and perfusion profiles with peculiar
clinical features.
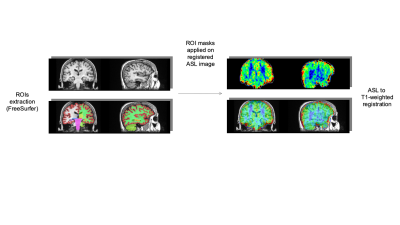
Figure 1: Preprocessing scheme
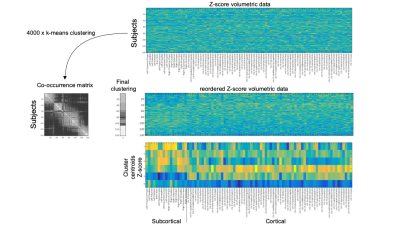
Figure 2: From volumetric measurements to gray matter clusters
-
A Convolutional Neural Network for Accelerating the Computation of the Extended Tofts Model in DCE-MRI
Ke Fang1, Zejun Wang2,3, Zhaoqing Li2,3, Bao Wang4, Guangxu Han2,3, Zhaowei Cheng1, Zhihong Chen1, Chuanjin Lan5, Yi Zhang6, Peng Zhao7, Xinyu Jin1, Yingchao Liu8, and Ruiliang Bai2,3
1College of Information Science & Electronic Engineering, Zhejiang University, Hangzhou, China, 2Department of Physical Medicine and Rehabilitation of The Affiliated Sir Run Run Shaw Hospital AND Interdisciplinary Institute of Neuroscience and Technology, School of Medicine, Zhejiang University, Hangzhou, China, 3Key Laboratory of Biomedical Engineering of Ministry of Education, College of Biomedical Engineering and Instrument Science, Zhejiang University, Hangzhou, China, 4Department of Radiology, Qilu Hospital of Shandong University, Jinan, China, 5School of Medicine, Shandong University, Jinan, China, 6Shandong Medical Imaging Research Institute, Shandong University, Jinan, China, 7Department of Neurosurgery, Provincial Hospital Affiliated to Shandong First Medical University, Jinan, China, 8Provincial Hospital Affiliated to Shandong First Medical University, Jinan, China
We demonstrated the feasibility of CNN in fastening the computation
of non-linear pharmacokinetic models in DCE-MRI.
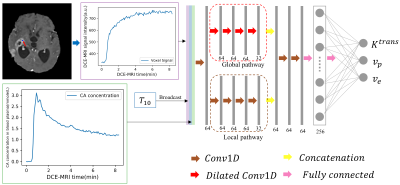
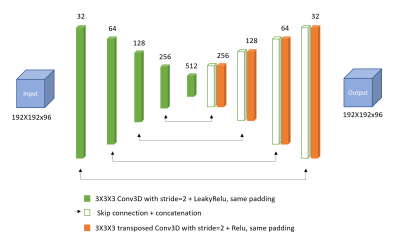
Figure 1. The proposed CNN
architecture for the estimation of pharmacokinetic parameters in the eTofts
model. The input data are the 1D DCE-MRI time series data, $$$C_p$$$ (contrast agent concentration in the blood plasma) and $$$T_{10}$$$ ( $$$T_{1}$$$ before contrast agent injection) for each voxel. The
number of filters and output nodes in the network are provided at the bottom of
each layer. The outputs from the proposed CNN are the three independent eTofts
parameters: $$$K^{trans}$$$, $$$v_p$$$ and $$$v_e$$$.
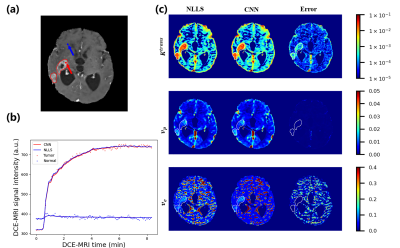
Figure 2. Example of the
results from conventional eTofts model fitting using nonlinear-least-squares
(NLLS) and CNN trained on mixed data in the testing dataset. (a) The contrast-enhanced
slice of one glioma subject, where the tumor is outlined
by solid red curves. (b) The predicted DCE-MRI time series signal using
parameters obtained from conventional NLLS fitting (blue curve) and the CNN (red
curve). (c) Pharmacokinetic parameter maps obtained from NLLS and the CNN, along
with the absolute difference (error map) between the results from
these two methods.
-
Changes of brain perfusion under anesthesia in humans – an explorative Arterial Spin Labeling study
Thomas Lindner1,2, Hajrullah Ahmeti3, Dana Voß3, Monika Huhndorf2, Friederike Austein1,2, Michael Helle4, Olav Jansen2, Michael Synowitz3, and Stephan Ulmer2,5
1Department of Diagnostic and Interventional Neuroradiology, University Hospital Hamburg-Eppendorf, Hamburg, Germany, 2Department of Radiology and Neuroradiology, University Hospital Schleswig-Holstein, Kiel, Germany, 3Neurosurgery, University Hospital Schleswig-Holstein, Kiel, Germany, 4Tomographic Imaging Department, Philips Research Laboratories, Hamburg, Germany, 5Radiology, Kantonsspital Winterthur, Winterthur, Switzerland
Cerebral Blood Flow is reduced during anesthesia. Using Arterial Spin Labeling, non-invasive imaging of this phenomenon could be performed.
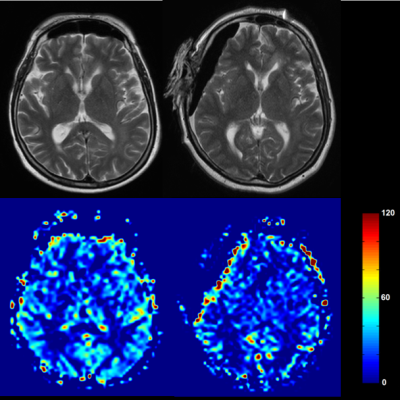
Figure 1: Exemplary case of a patient before (left
column) and during anesthesia (right column)
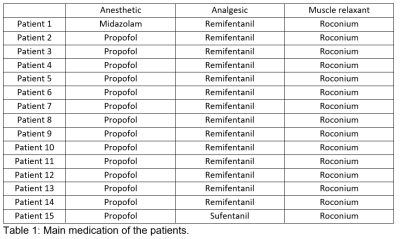
Table 1: Main medication of the patients
-
Brain response to acupuncture treatment in dysmenorrhea: An arterial spin labeling study
Hui-Chieh Yang1, Cheng-Hao Tu2, and Shin-Lei Peng1
1Department of Biomedical Imaging and Radiological Science, China Medical University, Taichung, Taiwan, 2Graduate Institute of Acupuncture Science, China Medical University, Taichung, Taiwan
We investigated the brain response to acupuncture
treatment in dysmenorrhea by using the arterial spin labeling technique. Results
showed that after acupuncture treatment, significant decreases in cerebral
blood flow were found in the pain-related regions.
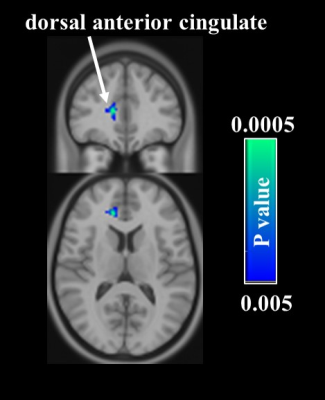
Comparison of cerebral blood flow (CBF) between two time-points in
the acupuncture group. Voxelweise analyses demonstrate a decrease in CBF in the
right dorsal anterior cingulate cortex after treatment.
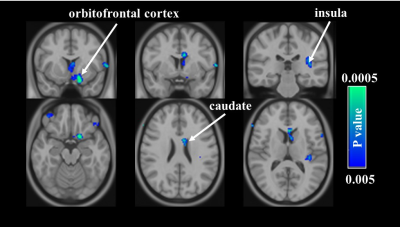
Comparison of cerebral blood flow (CBF) between two time-points in
the sham acupuncture group. Voxelweise analyses demonstrate decreases in CBF in
the left medial frontal gyrus, caudate, and insula after treatment.
-
Perfusion mapping with sinusoidal CO2 respiratory challenge
Chau Vu1, Jian Shen1, Matthew Borzage2, Soyoung Choi3, and John Wood4
1Biomedical Engineering, University of Southern California, Los Angeles, CA, United States, 2Fetal and Neonatal Institute, Children's Hospital Los Angeles, Los Angeles, CA, United States, 3Neuroscience Graduate Program, University of Southern California, Los Angeles, CA, United States, 4Pediatrics and Radiology, Children's Hospital Los Angeles, Los Angeles, CA, United States
Using sinusoidally modulated CO2 stimulus which has previously been used to measure cerebrovascular reserve, this study derived a method to measure cerebral blood flow (CBF), cerebral blood volume (CBV) and transit time (TT) without the use of exogenous contrast.
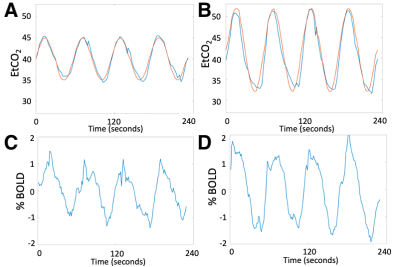
Figure 1. CO2 respiratory challenge with sinusoidally modulated stimulus in Subject 1. (A) Expected (red) and measured (blue) end-tidal CO2 with 5mmHg amplitude in paradigm #1. (B) Expected and measured end-tidal CO2 with 10mmHg amplitude in paradigm #2. (C) Whole brain BOLD time series in paradigm #1. (D) Whole brain BOLD time series in paradigm #2.
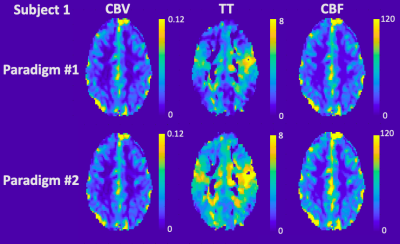
Figure 2. Perfusion maps derived from sinusoidal CO2 challenge in Subject 1. CBV, TT and CBF maps in paradigm #1 (top row) and paradigm #2 (bottom row).
-
Evidence for a sustained cerebrovascular response following motor practice
Eleonora Patitucci1, Michael Germuska1, James Kolasinski1, Valentina Tomassini1,2,3, and Richard G Wise1,2
1CUBRIC, Cardiff University, Cardiff, United Kingdom, 2Institute for Advanced Biomedical Technologies (ITAB), Department of Neurosciences, Imaging and Clinical Sciences, University of Chieti-Pescara, Chieti, Italy, 3MS Centre, Neurology Unit, SS. Annunziata University Hospital, Chieti, Italy
This voxel-wise investigation of cerebral
blood flow shows a sustained increase in resting state perfusion in task
relevant regions after the completion of a 10-minute learning task, demonstrating
changes in resting perfusion with motor learning.
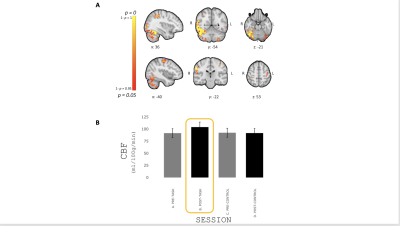
FIG. 4 - (A) Areas showing an increase in resting CBF with
learning reported as p-value. (B)
Mean±SEM resting CBF during the different resting periods (pre-/post-
task/control) in significant voxels. Resting CBF significantly increased
following completion of the task 15.8% on average compared to the pre-task.
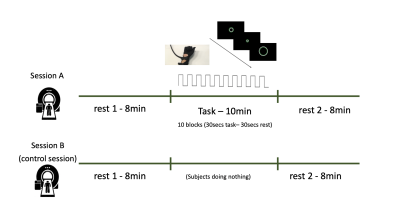
FIG. 1 - Participants were scanned twice. During the “task” session (A),
participants underwent 8 minutes of resting state (RS), 10 minutes of motor
task and 8 minutes of RS. During the “control” session (B), participants
underwent 8 minutes of RS, 10 minutes where they were asked to lay still in the
scanner and 8 minutes of RS again. During the rest scans, in the task session
and for the entire duration of the control session, a white fixation cross and
the word “REST” were presented on a black screen.
-
Effect of subject-specific T1 values for arterial spin labelling on cerebral blood flow in mild stroke patients
Michael S Stringer1,2, Cameron Manning1,2, Una Clancy1,2, Alasdair Morgan1,2, Zahra Shirzadi3,4, Francesca M Chappell1,2, Dany Jaime Garcia1,2, Angela CC Jochems1,2, Maria Valdes-Hernandez1,2, Stewart Wiseman1,2, Eleni Sakka1,2, Gordon W Blair1,2, Rosalind Brown1,2, Bradley MacIntosh3,4, Ian Marshall1,2, Fergus Doubal1,2, and Joanna M Wardlaw1,2
1Centre for Clinical Brain Sciences, University of Edinburgh, Edinburgh, United Kingdom, 2UK DRI at the University of Edinburgh, Edinburgh, United Kingdom, 3Hurvitz Brain Sciences Research Program, Sunnybrook Health Sciences Centre, Toronto, ON, Canada, 4Department of Medical Biophysics, University of Toronto, Toronto, ON, Canada
T1 can vary in mild stroke patients. We calculated
cerebral blood flow (CBF) using subject-specific quantitative T1
finding lower grey and higher white matter CBF than standard processing. CBF
was also lower in patients with higher disease severity.
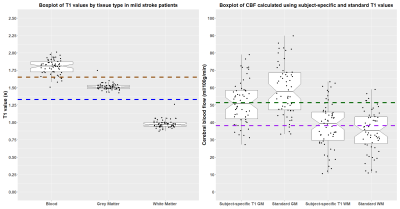
Figure 1: Box
plots showing the distribution of: A) the subject-specific T1
values with nominal T1 values for blood (1.65 s) and tissue
(1.33 s) plotted in brown and blue respectively; B) cerebral blood flow (CBF)
calculated with nominal and subject-specific T1 values, mean
CBF values using the estimated T1 values are plotted
in green (grey matter, GM) and purple (white matter, WM).
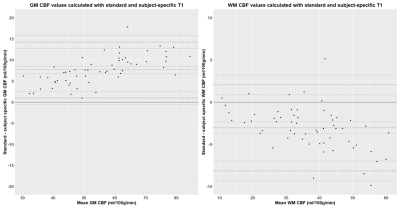
Figure 2: Bland-Altman
plots of cerebral blood flow (CBF) values in grey (GM) and white matter (WM) calculated
using the calculated using standard (tissue=1.33 s, blood=1.65 s) and
subject-specific T1 values.