-
Computed DWIs with different b values vs. Actual DWI vs. FDG-PET/CT: Capability for N-Stage Assessment in NSCLC Patients.
Yoshiharu Ohno1,2,3, Masao Yui4, Takeshi Yoshikawa3,5, Daisuke Takenaka5, Kaori Yamamoto4, Yoshimori Kassai4, Kazuhiro Murayama2, and Hiroshi Toyama1
1Radiology, Fujita Health University School of Medicine, Toyoake, Japan, 2Joint Research Laboratory of Advanced Medical Imaging, Fujita Health University School of Medicine, Toyoake, Japan, 3Division of Functional and Diagnostic Imaging Research, Department of Radiology, Kobe University Graduate School of Medicine, Kobe, Japan, 4Canon Medical Systems Corporation, Otawara, Japan, 5Diagnostic Radiology, Hyogo Cancer Center, Akashi, Japan
cDWI is considered as a new method
for promising method to improve the capability for N-stage assessment as
compared with aDWI and FDG-PET/CT in NSCLC patients. In addition, b value at 600s/mm2
would be better to be generated rather than that at other b values.
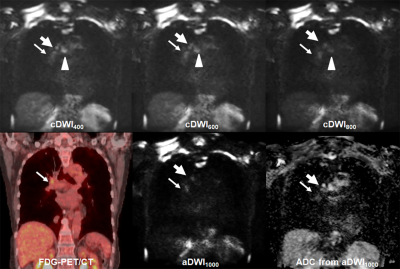
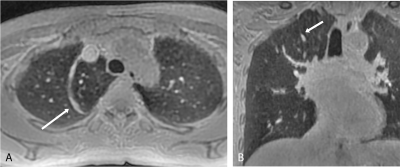
Figure 1. 72-year
old invasive adenocarcinoma with N2 disease
cDWI
at each b value demonstrates right hilar, right lower paratracheal, subcarina
lymph node metastases (arrow, large arrow and arrow head). However, PET/CT shows only right hilar lymph
node metastasis (arrow). On the other
hand, aDWI and ADC demonstrate right hilar and right lower paratracheal lymph
node metastases (arrow and large arrow).
This case was assessed as N2 case on each cDWI and aDWI and considered
as true-positive. However, this case was
evaluated as N1 case on PET/CT and considered as false-negative case.
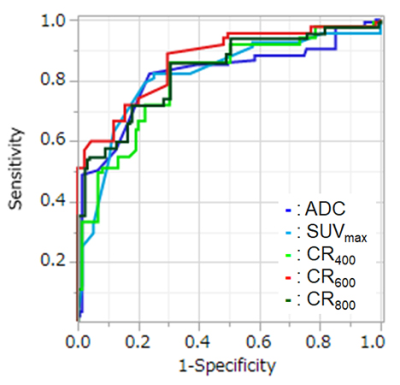
Figure 2. Result
of ROC analysis for distinguishing metastatic from non-metastatic lymph nodes.
Area under the curve (AUC) of CR600
(AUC=0.87) was significantly larger than that of SUVmax (AUC=0.77,
p=0.003), CR400 (AUC=0.79, p<0.0001) and CR800 (AUC=0.81,
p<0.0001). In addition, AUC of CR800
was also significantly larger than that of CR400 (p=0.02).
-
The value of PET/MRI in the identification of non-small cell lung cancer: stretch index diffusion imaging and metabolic parameters
Zhun Huang1, Nan Meng2, Zhixue Wang3, Fangfang Fu2, Pengyang Feng1, Ting Fang2, Yan Bai2, Wei Wei2, Yaping Wu2, Jianmin Yuan4, Yang Yang5, Hui Liu6, and Meiyun Wang*1
1Department of Radiology, Henan University People’s Hospital & Henan Provincial People’s Hospital, School of Basic Medicine, zhengzhou, China, 2Department of Radiology, Zhengzhou University People’s Hospital & Henan Provincial People’s Hospital, Academy of Medical Sciences, zhengzhou, China, 3Department of Radiology, the First Affiliated Hospital of Henan Medical University, Kai Feng, China, 4Central Research Institute, UIH Group, Shanghai, China, zhengzhou, China, 5Central Research Institute, UIH Group, Beijing, China, Bei Jing, China, 6UIH America, Inc, Houston, TX, United States, Houston, TX, United States
PET/MRI is a very promising technology. PET can reflect metabolism, and stretch index diffusion imaging can reflect molecular diffusion rate and heterogeneity.
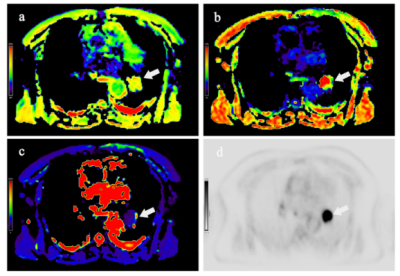
Figure.1:
A 58-year-old male patient with lung adenocarcinoma. The white arrow points to the lesion.ADC (a), α (b), DDC (c) pseudo-color image and pet image (d).
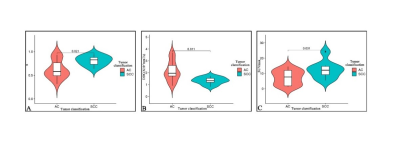
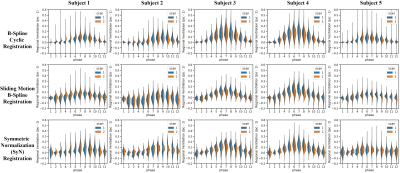
Figure.2:Violin case diagram.α value of AC(0.64±0.19) and SCC(0.81±0.10)group(A), DDC value of AC [(2.14±0.83)×10-3 mm2
/s ]and SCC[(1.33±0.30)×10-3 mm2 /s] group(B). SUVmax value of AC (7.36±4.61) and
SCC(12.56±5.85) group(C), AC: adenocarcinoma, SCC: Squamous cell carcinoma.
-
Distinguishing malignant and benign lung lesions with multiparametric 18F-FDG PET/MRI: Comparison of metabolic parameters and IVIM parameters
Fangfang Fu1, Nan Meng2, Zhun Huang3, Yaping Wu1, Pengyang Feng3, Xiaochen Li1, Yan Bai1, Wei Wei1, Jianmin Yuan4, Tianyi Xu4, and Meiyun Wang1
1Department of Medical Imaging, Henan Provincial People’s Hospital, People’s Hospital of Zhengzhou University, Zhengzhou, China, 2Department of Radiology, Zhengzhou University People’s Hospital & Henan Provincial People’s Hospital, Academy of Medical Sciences, Zhengzhou, China, 3Department of Radiology, Henan University People’s Hospital & Henan Provincial People’s Hospital, School of Basic Medicine. Department of Radiology, Zhengzhou University People’s Hospital & Henan Provincial People’s Hospital, Academy of Medical Sciences., Zhengzhou, China, 42258 Chengbei Road, Jiading District, Shanghai, China 201907, Shanghai, China
Multiparametric PET/MRI is potentially useful
in distinguishing malignant and benign pulmonary lesions. The
combination of several IVIM parameters and PET parameters could improve the differentiation of malignant and benign pulmonary lesions.
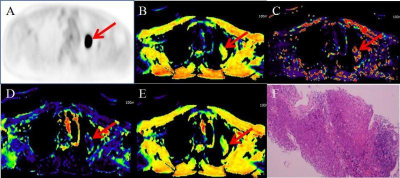
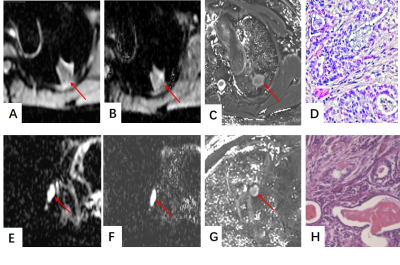
Figure 1.A 61-year-old man with left lung squamous cell
carcinoma. The red arrows point to
the lesion. A. PET image. B. Dt
pseudo colored map. C. Dp pseudo colored map.
D. F pseudo colored maps. E. sADC pseudo colored map. F. Hematoxylin and
eosin(HE)x 100.
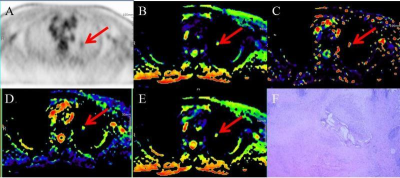
Figure 2.A 56-year-old man with
left lung tuberculous granuloma. The red arrows point to the lesion.A. PET
image. B. Dt pseudo colored map. C. Dp pseudo colored
map. D. F pseudo colored maps. E. sADC pseudo colored map. F. Hematoxylin and
eosin(HE)x 100.
-
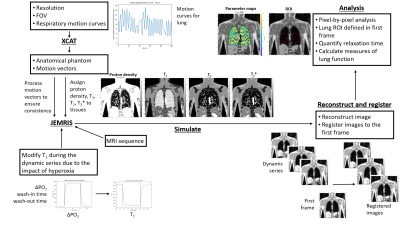
Pulmonary functional imaging for lung adenocarcinoma: combined MRI assessment based on IVIM-DWI and OE-UTE-MRI
Gaofeng Shi1, Liyun Zheng2, Yongming Dai2, Hui Liu1, Hui Feng1, and Hongshan Zhu1
1Department of Radiology, Fourth Hospital of Hebei Medical University, Shijiazhuang, China, 2United Imaging Healthcare, Shanghai, China
This
study suggested that the combined measurement of OE-UTE-MRI and IVIM-DWI may
serve as a promising method for the noninvasive assessment of lung function and
classification of LUAD subtype.
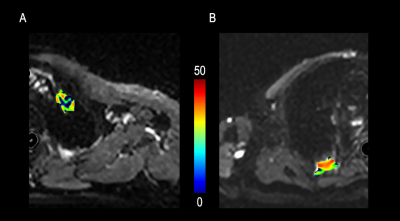
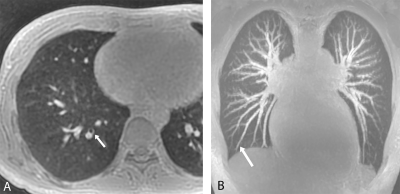
Figure 3. Representative IVIM-DWI analysis for lepidic predominant adenocarcinoma and micropapillary predominant adenocarcinoma. (A) f map from a lepidic predominant adenocarcinoma patient; (B) f map from a micropapillary predominant adenocarcinoma patient.
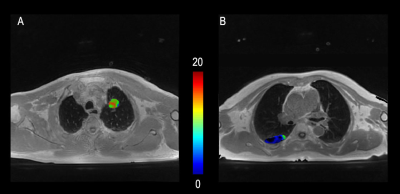
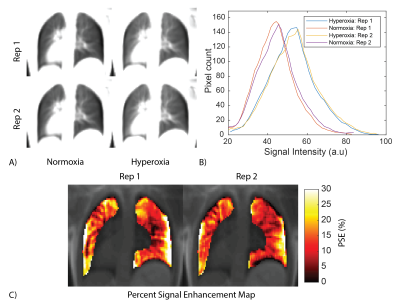
Figure 4. Representative OE-UTE-MRI analysis for lepidic predominant adenocarcinoma and micropapillary predominant adenocarcinoma. (A) lesion PSE map from a lepidic predominant adenocarcinoma patient; (B) lesion PSE map from a micropapillary predominant adenocarcinoma patient.
-
The diagnostic value of MRI extracellular volume(ECV) to pulmonary occupied lesions
Yongqing Yang1,2, Peng Zhao2, Xiangtao Lin1,2, Yu Wang1,2, Mengxiao Liu3, Wenjing Ma2, Shuai Duan2, Nan Lin2, Xiaoli Li1,2, Dejuan Shan1,2, and Zhongyu Hou2
1Radiology, Shandong Provincial Hospital Affiliated to Shandong University, Jinan, China, 2Radiology, Shandong Provincial Hospital Affiliated to Shandong First Medical University, Jinan, China, 3MR Scientific Marketing,Diagnostic Imaging, Siemens Healthcare Ltd., Shanghai, China
MRI-ECV
can diagnose lung stationary lesions without invasion and safety, It will be
helpful for the choice of clinical treatment options.
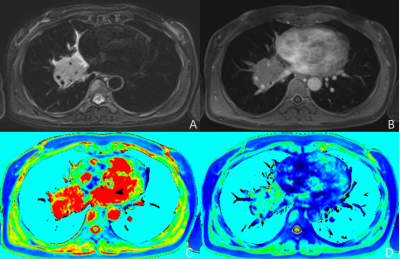
Fig. 1:A 47-years-old female with pathologically confirmed
Small cell lung cancer in the right lung. A: T2WI, B: T1WI+C, C: Native T1 mapping, D:T1 mapping+C.

Fig.
2: A 67-years-old female with pathologically confirmed adenocarcinoma in the right lung. A: T2WI, B: T1WI+C, C: Native T1 mapping, D: T1
mapping+C.
-
Using GRASP-DCE MRI for the Identification of Subtypes of Lung Cancers from Benign Lung Lesions.
Dandan Peng1, Cong Xia1, Yuancheng Wang1, Zhongshuai Zhang2, and Shenghong Ju1
1Zhongda Hospital, Medical School of Southeast University, Nanjing, China, 2SIEMENS Healcare, Shanghai, China
This study is expected to provide
information about differentiating of benign from malignant pulmonary lesions
with GRASP-DCE MRI among
33 lung lesions. The results initially indicated that the quantitative DCE
parameters could be a useful technique
for lung lesions detection.
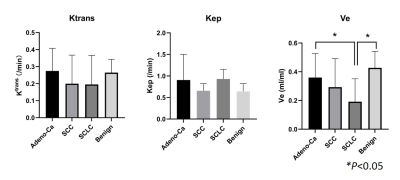
Figure1.The GRASP DCE-derived quantitative
values distribution of malignancy and benignity in lung lesions. The mean
values of Ve in Adeno-Ca and benign groups are 0.360±0.167 and 0.428±0.114. (ANOVA,
p<0.05)
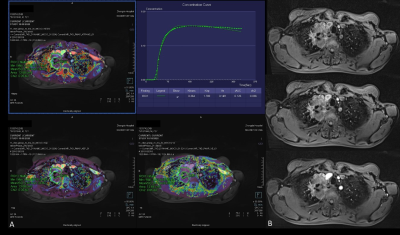
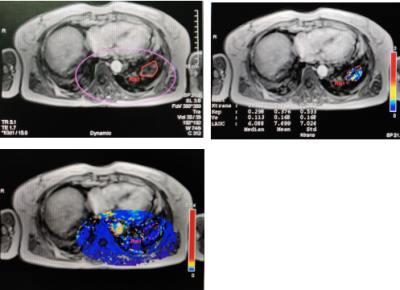
Figure 3. A
72-year-old male with a 6cm mass in the right upper lobe. This mass was
diagnosed as adenocarcinoma IIIb (cT4N2M0). (A): Free-breathing
Golden-angle RAdial Sparse Parallel (GRASP)-DCE MRI post-processed image
showing mean Ktrans of 0.264 min-1, Kep of 1.769 min-1 and Ve of 0.149. The iAUC
value of Time-intensity curve for this mass was 0.125. (B):There
were 3 early phases images from top to the bottom after contrast injection
showing the mass continuous heterogeneous enhancement.
-
Analysis of the diagnostic value of multimodal magnetic resonance imaging for non-small cell lung cancer
Ting Fang1, Nan Meng1, Meiyun Wang1,2, Zhun Huang2, Pengyang Feng2, Fangfang Fu3, Wei Wei3, Yaping Wu3, Yan Bai3, Jianmin Yuan4, Yang Yang5, and Hui Liu 6
1Department of Radiology, Zhengzhou University People’s Hospital & Henan Provincial People’s Hospital, Zhengzhou, China, 2Department of Radiology, Henan University People’s Hospital & Henan Provincial People’s Hospital, Zhengzhou, China, 3Henan Provincial People’s Hospital, Zhengzhou, China, 4Central Research Institute, UIH Group, Shanghai, China, 5Central Research Institute, UIH Group, Beijing, China, 6UIH America, Inc. 9230 Kirby Dr. STE600, Houston, TX, United States
CEST can selectively label the exchangeable hydrogen protons in free macromolecules.IVIM can evaluate true water molecule diffusion and microcirculation perfusion . Our research shows that CEST and IVIM have similar diagnostic performance in the differential diagnosis of NSCLC.
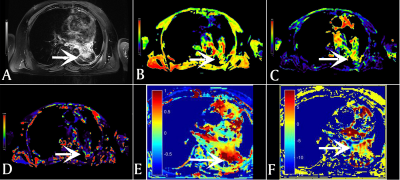
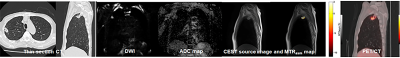
Figure.1 :A 62-year-old man with left Lung adenocarcinoma. A is T2w map,B is D pseudo colored map,C is f pseudo colored map, D is D* pseudo colored maps,E is Calculated B0 map,F is MTRasym(3.5ppm) pseudo colored maps.
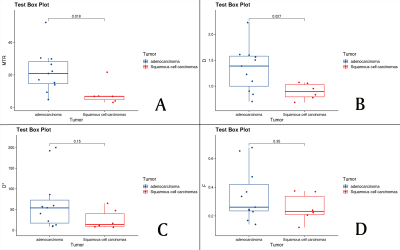
Figure.2: The MTRasym (3.5ppm), D, D*, and f values of adenocarcinoma and squamous cell carcinoma groups. (A) MTRasym (3.5ppm) = (22.04±12.87)%, (8.25±6.77)% ; (B) D = (1.33±0.44) ×10−3 mm2/s , (0.89± 0.16)×10−3 mm2/s ; (C) D* = (67.34±68.22)×10−3 mm2/s , (25.66±24.43)×10−3 mm2/s; (D) f = (0.34±0.18), (0.26±0.09) .
-
Differentiation of malignant and benign solitary pulmonary nodules using radial sampled T2 mapping and DW-IVIM with reduced FOV
Fu Yicheng1, Zhang Zhongshuai2, Yu Ye1, and Wu Huawei1
1Radiology, Renji Hospital, School of Medicine, Shanghai Jiaotong University, Shanghai, China, 2SIEMENS Healthcare, China, Shanghai, China
Quantitative T2 mapping and DW-IVIM parameters could
provide valuable information and serve as a supplementary imaging marker for
differentiating malignant from benign SPNs.
A-D A adenocarcinoma in the left upper lobe (A) An axial ADC mapping. (B) D map. (C) T2 map. (D) Hematoxylin-eosin staining confirms
the nodule which is associated with nuclear polymorphism, higher cellularity and nuclear-to-cytoplasmic ratios which make ADC value, D value, and T2 value
down.E-H A ball pneumonia in the right middle lobe. (E) An axial ADC mapping. (F) D map. (G) T2 map. (H) Hematoxylin-eosin staining confirms
the nodule was characterized by more extracellular fluid spec and tissue fluid
which would make ADC value, D value and T2 value rise.
-
Comparing ADC and IVIM for Identification of the subtypes of Lung Cancers from Benign Lung Lesions using iShim technique
Dandan Peng1, Zhongshuai Zhang2, Cong Xia1, Yuancheng Wang1, and Shenghong Ju1
1Zhongda Hospital, Medical School of Southeast University, Nanjing, China, 2SIEMENS Healcare, Shanghai, China
This study aimed to provide information
about differentiation of benign from malignant pulmonary lesions with IVIM using individual shimming technique among
33 lung lesions. The results initially indicated that ADC and IVIM and could be
great techniques for lung lesions detection.
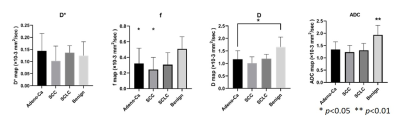
Figure 1. The IVIM quantitative values distribution of malignancy and benignity
in lung lesions. The mean ADC value of benign lesions is 1.846±0.403×10⁻³
mm2/s (ANOVA, p<0.01)
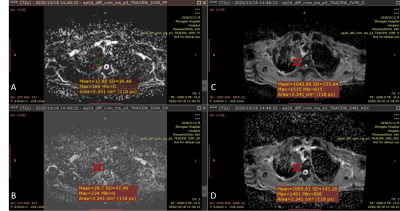
Figure 3. 72-year-old
male with a 6cm mass in the right upper lobe. This mass was diagnosed as
adenocarcinoma IIIb (cT4N2M0).ROI area of the mass is 2.341 cm2.(A):
IVIM-f shows a value of 0.033×10⁻³mm2/s
around the mass. (B): IVIM-D*
shows a value of 0.030×10⁻³mm2/s around
the mass. (C):IVIM-D shows a value of 1.041×10⁻³mm2/s around the mass. (D): ADC shows a value of 1.066×10⁻³mm2/s around the mass.
-
Comparison of UTE 1H lung MRI with quantitative CT and hyperpolarized 129Xe diffusion-weighted MRI in IPF
Ho-Fung Chan1, James A Eaden1, Nicholas D Weatherley1, Kevin Johnson2, Guilhem J Collier1, Madhwesha Rao1, Graham Norquay1, Jody Bray1, Smitha Rajaram1, Andrew J Swift1, Ronald A Karwoski3, Brian J Bartholmai3, Stephen M Bianchi4, and Jim M Wild1
1Infection, Immunity and Cardiovascular Disease, University of Sheffield, Sheffield, United Kingdom, 2Radiology and Medical Physics, University of Wisconsin, Madison, WI, United States, 3Biomedical Imaging Resource, Mayo Clinic, Rochester, MN, United States, 4Academic Directorate of Respiratory Medicine, Sheffield Teaching Hospitals NHS Foundation Trust, Sheffield, United Kingdom
Normalized UTE 1H MRI signal correlates with IPF lung parenchyma changes on CT and may demonstrate sensitivity to longitudinal changes in a larger cohort.
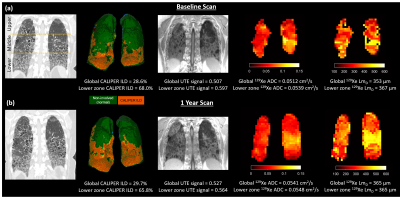
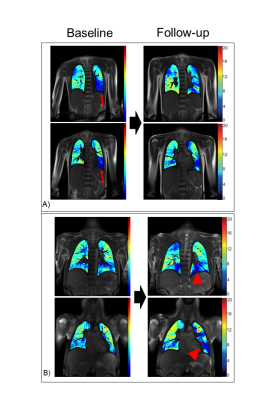
Figure 1:
Example images from CT, UTE MRI, and 129Xe DW-MRI for one IPF
patient. (a) Baseline images where CALIPER ILD%, UTE signal, 129Xe
ADC, and LmD are elevated in the lower zone compared to the global
mean value. (b) Images in the same patient after 1 year where increases in the
global mean value are observed for all imaging metrics.
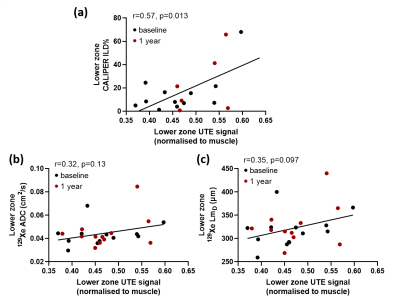
Figure 2:
(a) Scatter plot demonstrating a significant correlation between lower zone
normalized UTE signal and lower zone CALIPER ILD% values across both baseline
and 1 year scans. Scatter plots comparing lower zone normalized UTE signal with
lower zone 129Xe ADC (b) and LmD (c) values.
-
The diagnostic value of MR dynamic enhancement quantitative parameter for usual interstitial pneumonia and nonspecific interstitial pneumonia
XinHui Chen1, ZhiPeng Zhou2, Cheng Ge2, XinGuan Yang2, Long Qian3, and Weiyin Vivian Liu3
1Radiology, Doctor, Zhan Jiang, China, 2doctor, Gui Lin, China, 3MR Research, Beijing, China
This study aims to distinguish between UIP and NSIP using MRI dynamic enhancement quantitative parameters.
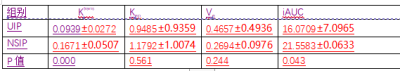
Statistical analysis of UIP and NSIP
58-Figure 1 A 58-year-old female with UIP mainly had line-shape enhancement or patchy enhancement. The Ktrans and Kep values were low in the drawn ROI on the slice of the largest lesion area. The pseudo-color map only including lesions, parts of healthy lungs and muscles mainly displayed in blue.
-
Correlation of global and regional hyperpolarised 129-Xenon MRI with quantitative CT in patients with idiopathic pulmonary fibrosis
James A Eaden1,2, Guilhem J Collier1, Ho-Fung Chan1, Nicholas D Weatherley1,2, Graham Norquay1, Smitha Rajaram3, Andy Swift1,3, Ronald A Karwoski4, Brian Bartholmai4, Stephen M Bianchi2, and Jim M Wild1,5
1POLARIS, MRI unit, Department of Infection Immunity and Cardiovascular Disease, University of Sheffield, Sheffield, United Kingdom, 2Academic Directorate of Respiratory Medicine, Sheffield Teaching Hospitals NHS Foundation Trust, Sheffield, United Kingdom, 3Sheffield Teaching Hospitals NHS Foundation Trust, Sheffield, United Kingdom, 4Mayo Clinic, Rochester, MN, United States, 5Insigneo institute, University of Sheffield, Sheffield, United Kingdom
Several significant correlations were found between dissolved 129Xe MRI (RBC:TP, TP:Gas and RBC:Gas) and CALIPER
CT variables, both globally and regionally in IPF patients. There were no
significant correlations between 129Xe DW-MRI and CALIPER
variables.
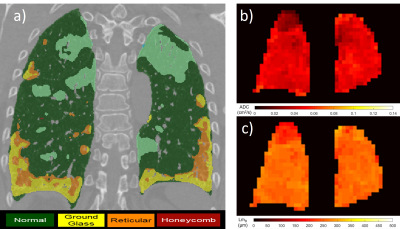
Figure 1. Examples of CALIPER CT (a), 129Xe
ADC (b) and 129Xe LmD (c) images.
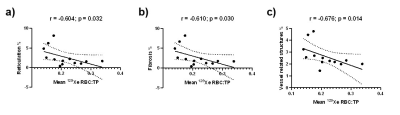
Figure 2. Correlation between global 129Xe RBC:TP and CALIPER reticulation % (a), fibrosis % (b) and vessel related
structures % (c) (n=13).
-
Lung parenchyma T1 mapping correlates lung pathology seen on CT in patients with pulmonary hypertension.
Laura Saunders1, Dave Capener1, David G Kiely1,2, Andy J Swift1, and Jim M Wild1
1Infection Immunity and Cardiovascular Disease, University of Sheffield, Sheffield, United Kingdom, 2Sheffield Pulmonary Vascular Disease Unit, Sheffield, United Kingdom
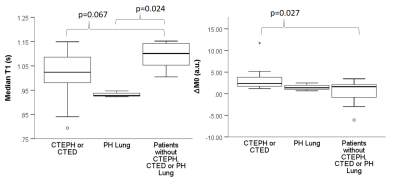
Lung T1 was significantly lower in patients with emphysema seen on
3D CT than in patients with fibrosis, centrilobular ground glass or no lung
disease seen on CT. Lung T1 was more sensitive in
differentiating lung pathology seen on CT when calculated using median T1 excluding lung vessels.
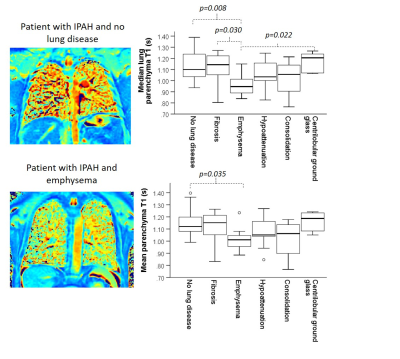
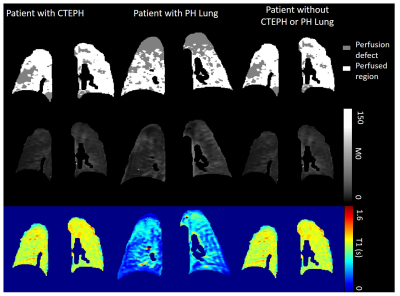
Figure 3: Two example T1 maps of patients with
IPAH with no lung disease seen on CT, and with emphysema seen on CT (left) and two
box plots of mean and median lung T1 in patients with PH (right).
There are significant differences in
median parenchyma T1 between patients with emphysema and patients
with fibrosis and centrilobular ground glass that are not seen when using mean
T1 as an average metric.
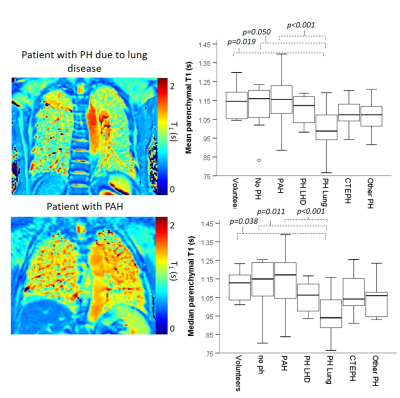
Figure 2: Example T1 maps in
a patient with PH due to lung disease and pulmonary arterial hypertension. Box plots
of mean and median lung T1 in patients with PH and control groups
both show significantly lower lung parenchyma T1 in patients with PH
due to lung disease, than patients without PH, patients with PAH or healthy volunteers.
-
Imaging the interplay of notch-DLL4 expression with pulmonary radiation injury using dynamic contrast enhanced ultrashort echo time imaging
El-Sayed H Ibrahim1, Abdul Parchur1, Brian Fish1, Meetha Medhora1, and Amit Joshi1
1Medical College of Wisconsin, Milwaukee, WI, United States
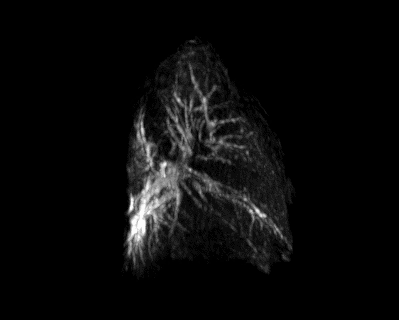
Ultrashort echo-time
dynamic contrast enhancement MRI has the potential for in vivo quantification
of irradiation induced vascular perfusion and permeability early changes in
multiple organs in the same subject.
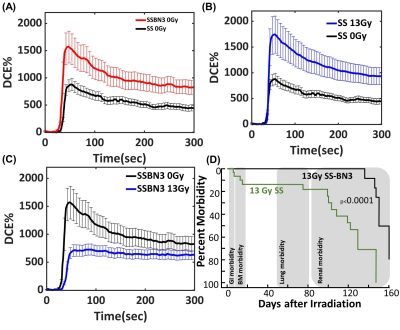
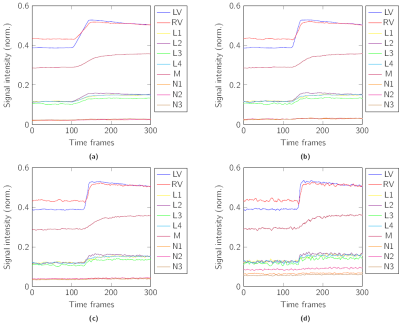
Figure 1. (a) Ultrashort echo-time dynamic contrast
enhancement MRI image and signal enhancement evolution in the lung before (baseline)
and after gadolinium injection in (A) SS and SSBN3 rats (control- 0 Gy),(B) SS
rats radiated at 0 (n = 4) and 13 Gy (n = 5), and (C) SSBN3 rats radiated at 0 (n
= 4) and 13 Gy (n = 4). Error bars represent mean ± SEM. (D) Survival curve Leg-out
PBI with supportive care in SS and SS-BN3 rats.
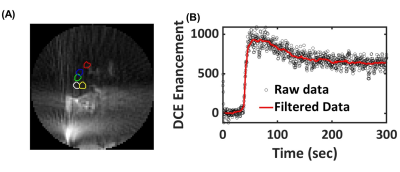
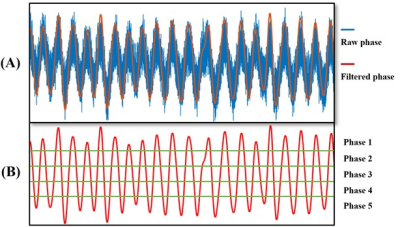
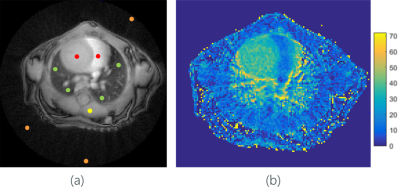
Figure 2. (A) A typical
image of ultrashort echo-time dynamic contrast enhancement MRI image in the
lung (five ROIs in the lung used to understand the perfusion in the lung) and
(B) kinetic DCE raw data (without motion correction – black circles) and
filtered data for respiratory motion correction (red line).
-
Assessment of dynamic thoracic motion for pre and post-surgical assessment using xt-PCA
Laurence H. Jackson1, Joanna Bell2, Giulia Benedetti2, Sze Mun Mak2, Rachael Franklin3, Rebecca Preston2, Andrea Bille4, John Spence2, and Geoff Charles-Edwards1
1Medical Physics, Guy's and St Thomas' NHS Foundation Trust, London, United Kingdom, 2Department of Radiology, Guy's and St Thomas' NHS Foundation Trust, London, United Kingdom, 3Medical Physics, King's College Hospital NHS Foundation Trust, London, United Kingdom, 4Department of Thoracic Surgery, Guy's and St Thomas' NHS Foundation Trust, London, United Kingdom
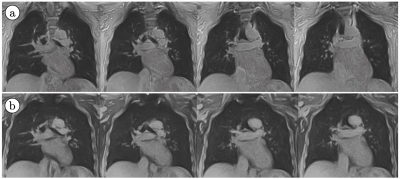
Here we present an MRI method for the pre and postoperative assessment of chest wall and diaphragmatic motion which provides valuable dynamic information to aid radiological assessment in these highly variable patients.
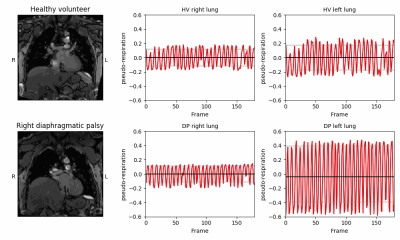
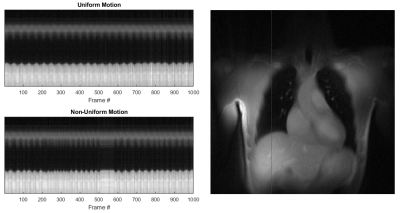
Figure 4. Comparison of right and left lung xt-PCA tidal breathing signal in a healthy volunteer (top row) and in a patient with right diaphragmatic palsy (DP) (bottom row). The dysfunction of the right lung in the patient manifests as a disproportionate diaphragmatic excursion with a compensatory larger signal in the left lung.
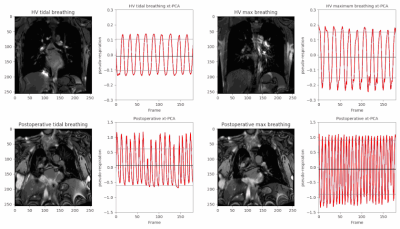
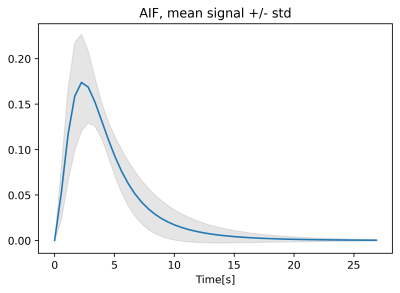
Figure 3. Results of xt-PCA diaphragm motion extraction in a healthy volunteer (top row) and a postsurgical patient following robotic plication and chest wall reconstruction (bottom row). A comparison of tidal breathing and maximum inspiration and expiration shows a number of potentially useful features for diagnosis, including amplitude, frequency and regularity. Both figures are animated to the same time scale and included on each figure is the mean signal (black) and ±1σ standard deviation (grey).
-
Proton lung ventilation MRI in cystic fibrosis: comparison with hyperpolarized gas MRI, pulmonary function tests and multiple-breath washout
Bilal A Tahir1,2, Laurie J Smith1, Joshua R Astley1,2, Michael Walker1, Alberto M Biancardi1, Guilhem J Collier1, Paul J Hughes1, Helen Marshall1, and Jim M Wild1
1POLARIS, University of Sheffield, Sheffield, United Kingdom, 2Oncology and Metabolism, University of Sheffield, Sheffield, United Kingdom
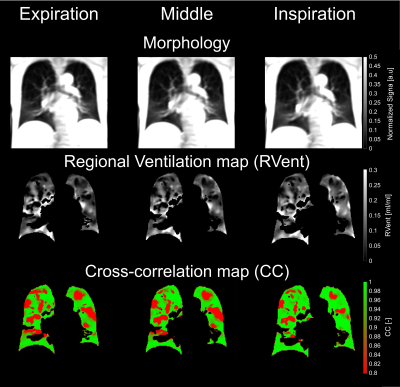
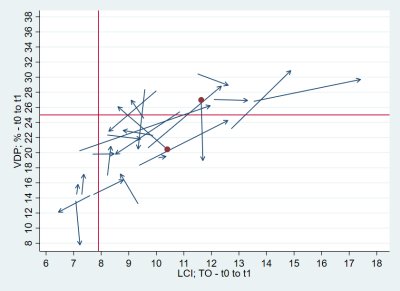
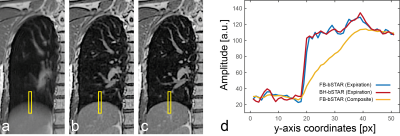
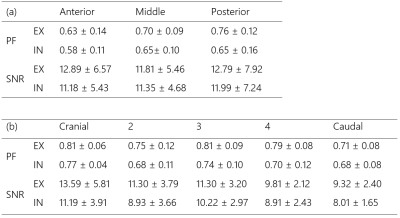
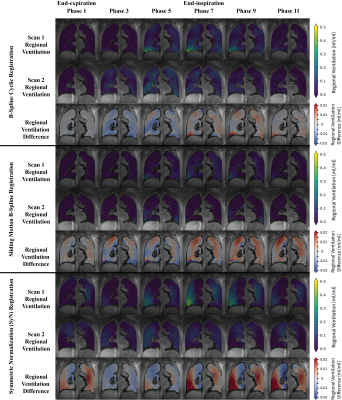
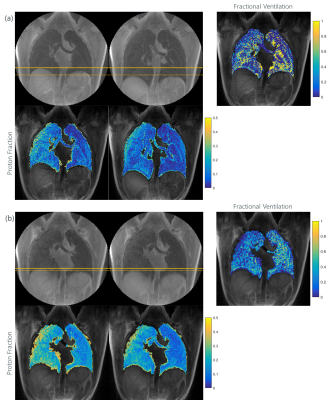
This study compares surrogates of
regional ventilation, derived from inspiratory and expiratory 3D proton MRI
with hyperpolarized gas MRI, pulmonary functions tests and multiple-breath
washout, in patients with a broad range of cystic fibrosis disease severity and
age.
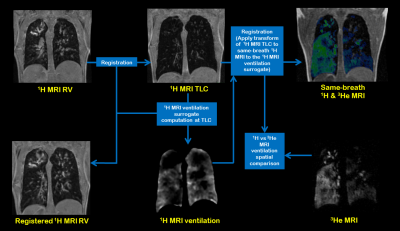
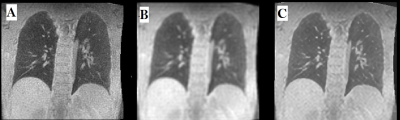
Figure 1. Workflow of
spatial comparison method of 1H and 3He MRI ventilation.
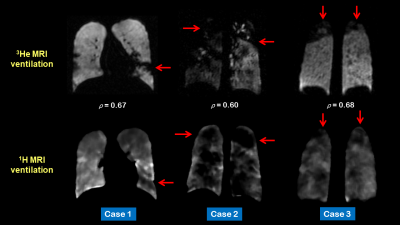
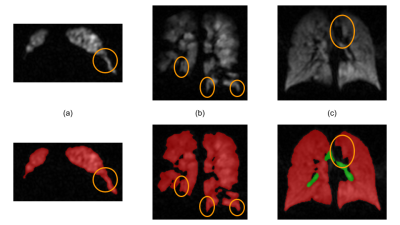
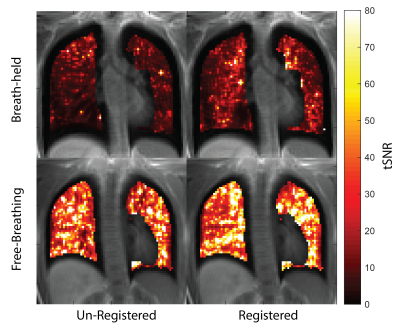
Figure 2. Corresponding coronal slices for three
patients of 3He (top row)) and 1H (bottom row) MRI
ventilation after registration. The red arrows depict defects and regions that
are visually similar on both scans. Voxel-wise Spearman's correlation
coefficients (ρ) are provided for each case.
-
Same-session Repeatability of Hyperpolarized 129Xe MRI Gas Uptake Measures in Healthy Subjects and Subjects with COPD
William J Garrison1, G Wilson Miller1,2, Kun Qing2, Y Michael Shim3, Jaime F Mata2, Mu He3, Talissa A Altes4, Joanne M Cassani4, Sarah E Struchen2, Roselove N Nunoo-Asare2, Nicholas J Tustison2, Alan M Ropp2, and John P Mugler III1,2
1Biomedical Engineering, University of Virginia, Charlottesville, VA, United States, 2Radiology and Medical Imaging, University of Virginia, Charlottesville, VA, United States, 3Medicine, University of Virginia, Charlottesville, VA, United States, 4Radiology, University of Missouri, Columbia, MO, United States
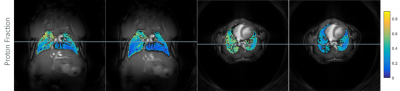
Strong tissue-to-gas and RBC-to-tissue repeatability was
found in same-day dissolved-phase 129Xe MRI scans in healthy and COPD
subjects, and regressing out scan-to-scan lung volume changes improved
repeatability further.
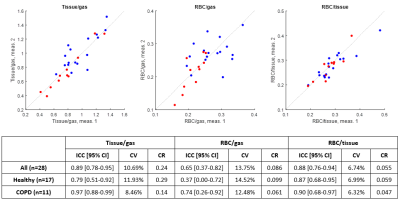
Fig. 1. Second measurements vs. first measurements of tissue-to-gas, RBC-to-gas, and RBC-to-tissue, in healthy subjects (blue) and in COPD subjects (red), as well as intraclass correlation coefficient (ICC), coefficient of variation (CV), and coefficient of repeatability (CR) for each of the three gas uptake measures.
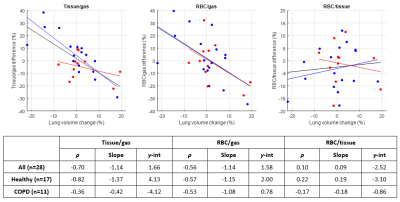
Fig. 3. Percent change in gas uptake ratios vs. percent
change in lung volume, for healthy subjects (blue) and COPD subjects (red),
with linear fits to all subjects (black line), healthy subjects (blue line),
and COPD subjects (red line), as well as correlation coefficients ρ,
slopes, and y-intercepts for each of the fits.
-
Accelerated dynamic 19F-MRI of inhaled perfluoropropane for quantitative regional assessment of gas wash-in biomarkers in patients with COPD
Mary A. Neal1,2, Benjamin J. Pippard1,2, Kieren G. Hollingsworth1,2, A. John Simpson2, and Peter E. Thelwall1,2
1Newcastle Magnetic Resonance Centre, Newcastle University, Newcastle upon Tyne, United Kingdom, 2Translational and Clinical Research Institute, Newcastle University, Newcastle upon Tyne, United Kingdom
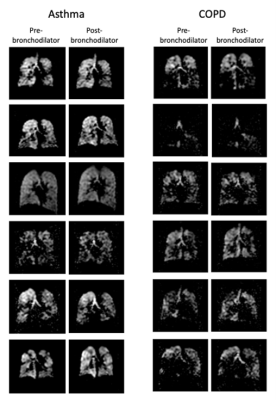
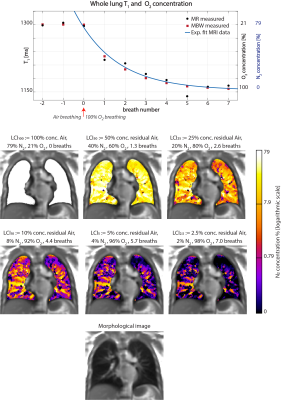
Dynamic 19F-MRI of inhaled perfluoropropane for regional assessment of gas wash-in and wash-out rates has been demonstrated in patients with COPD using compressed sensing for scan acceleration. A strong correlation with spirometric FEV1 was measured.
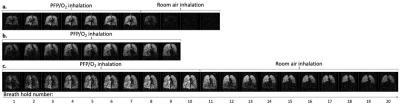
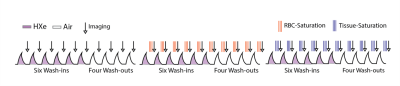
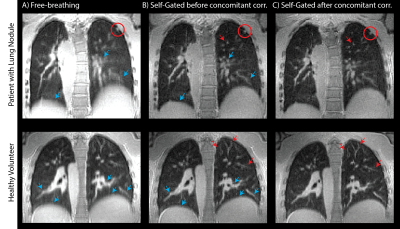
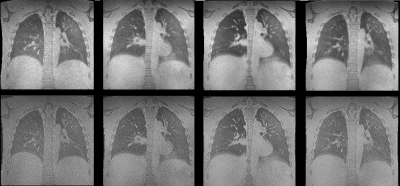
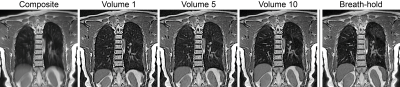
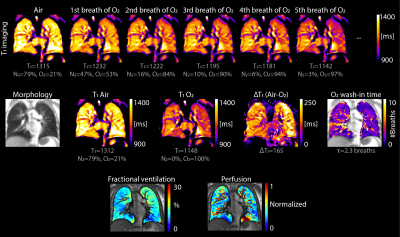
Figure 1: Multi-breath wash-in and wash-out of inhaled PFP/O2. A central coronal slice from a 3D 19F-MR image acquired during each breath hold is displayed. Images were acquired on alternate inhalations (ie. after 1, 3, 5, etc. inhalations of PFP/O2). PFP/O2 wash-in is visible over the initial breaths. The inhalation rig valve was then switched to deliver room air for visualisation of PFP/O2 gas wash-out. 1a. PFP/O2 wash-in and wash-out in a healthy volunteer. 1b. PFP/O2 wash-in in P1 (nb. wash-out images were not acquired in this participant). 1c. PFP/O2 wash-in and wash-out in P2.
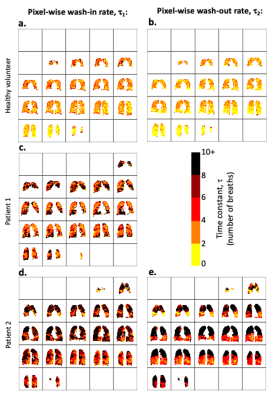
Figure 3: 3D voxel-wise exponential time constant estimation, where τ1 represents the number of wash-in respiratory cycles required to increase the 19F-MRI signal to 1 - 1/e (≈63.2%) of its calculated maximum value. τ2 represents the number of respiratory cycles required to reduce the 19F-MRI signal to 1/e (≈36.8%) of its calculated maximum value. Maps for wash-in τ1(3a., 3c., and 3d.) and wash-out τ2 (3b. and 3e.) are shown.
-
Identification of COPD Lesions Using 3D Ultrashort Echo-Time Imaging with Ventilation Map and Ventilation Flow Map
Seokwon Lee1, Jinil Park2, Hyonha Kim1, Ho Yun Lee3, and Jang-Yeon Park1,4
1Department of Biomedical Engineering, Sungkyunkwan University, Suwon, Korea, Republic of, 2Biomedical Institute for Convergence at SKKU, Sungkyunkwan University, Suwon, Korea, Republic of, 3Department of Radiology and Center for Imaging Science, Samsung Medical Center, Seoul, Korea, Republic of, 4Department of Intelligent Precision Healthcare Convergence, Sungkyunkwan University, Suwon, Korea, Republic of
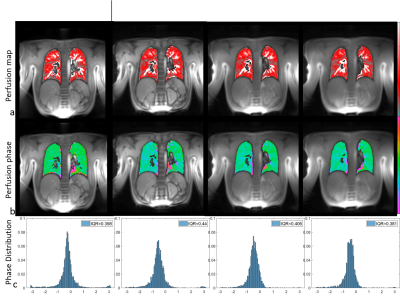
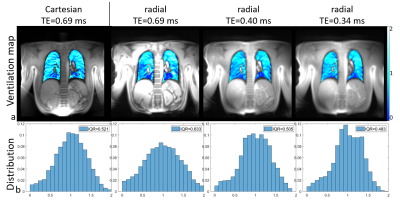
This
study shows functional information such as ventilation and ventilation flow maps
including the histogram can be used to diagnose COPD phenotypes and disease
progression, together with structural information of UTE-MRI.
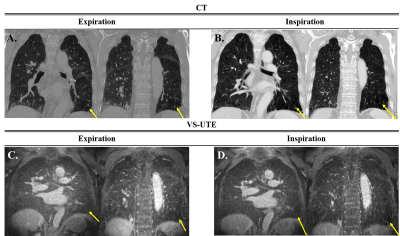
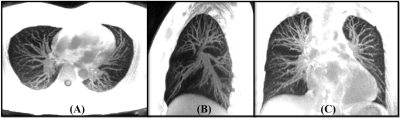
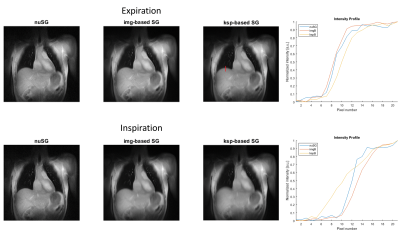
Figure 1.(A) CT images at expiration
state, (B) CT images at inspiration state, (C) MR images at expiration state, (D)
MR images at inspiration state. Yellow arrows indicate emphysema lesion. In
VS-UTE, although there is a slight decrease in signal, it is not easy to
accurately diagnose the lesion.
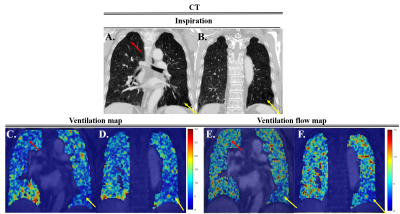
Figure
2. (A,B)
CT image at inspiration state, (C,D) Ventilation map each slide using VS-UTE,
(E,F) Ventilation flow map each slide using VS-UTE. Yellow arrows indicate
emphysema lesion. Figure 2 show the left lower lobe had high correlation with
CT and MRI ventilation map.
-
Generalizable deep learning for multi-resolution proton MRI lung segmentation in multiple diseases
Joshua R Astley1,2, Alberto M Biancardi1, Helen Marshall1, Laurie J Smith1, Guilhem J Collier1, Paul J Hughes1, Michael Walker1, Matthew Q Hatton2, Jim M Wild1, and Bilal A Tahir1,2
1POLARIS, University of Sheffield, Sheffield, United Kingdom, 2Oncology and Metabolism, University of Sheffield, Sheffield, United Kingdom
We present a generalisable deep learning model for automated lung segmentation of proton MRI acquired at different resolutions and inflation levels from healthy subjects and patients with respiratory diseases. The model generated accurate segmentations, outperforming a previous method.
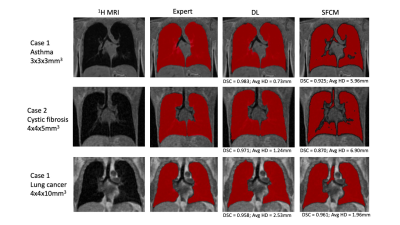
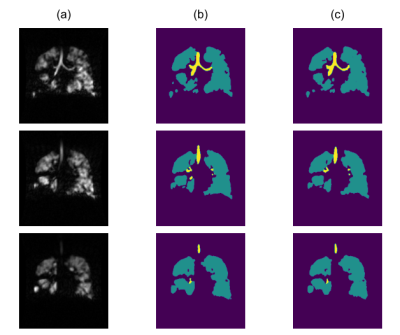
Figure 3. Example coronal slices of DL and SFCM segmentations for three cases with different image resolutions and diseases compared to the expert segmentations. DSC and Avg HD values are given for each case.
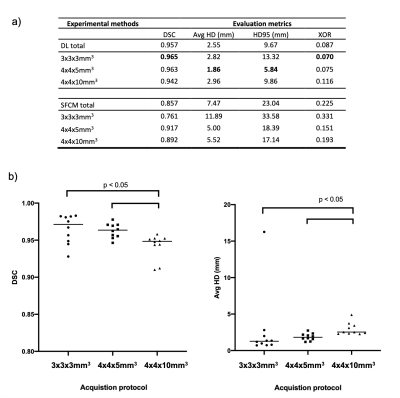
Figure 4. a) Comparison of segmentation performance of DL and SFCM for all scans in the testing set and for each acquisition protocol. Means are given; the best result for each metric is in bold. b) Comparison of DL performance for each of the three acquisition protocols using DSC (left) and Average boundary Hausdorff distance (right). Significances of differences between acquisitions were assessed using a Mann–Whitney U test.