-
Microfluidic preparation of liposomal hydrogel microbeads containing CT agents (CT-lipobeads) to longitudinally monitor pH using CEST MRI
Peng Xiao1, Jianpan Huang1, Xiongqi Han1, Jacinth Wing-Sum Cheu2, Joseph Lai1, Lok Hin Law1, Carmen Chak-Lui Wong2,3, and Kannie Wai Yan Chan1,4,5
1Department of Biomedical Engineering, City University of Hong Kong, Hong Kong, Hong Kong, 2Department of Pathology, Li Ka Shing Faculty of Medicine, The University of Hong Kong, Hong Kong, Hong Kong, 3State Key Laboratory of Liver Research, The University of Hong Kong, Hong Kong, Hong Kong, 4City University of Hong Kong Shenzhen Research Institute, Shen Zhen, China, 5Russell H. Morgan Department of Radiology and Radiological Science, The Johns Hopkins University School of Medicine, Baltimore, MD, United States
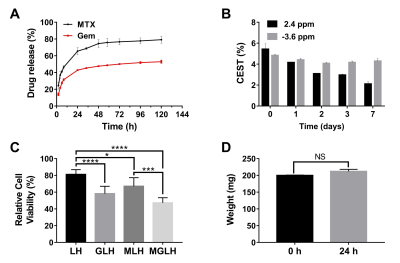
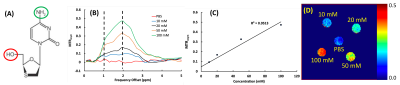
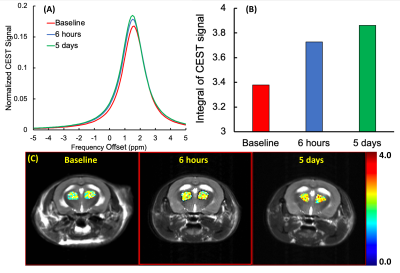
CT-lipobeads were prepared using microfluidics. It generates ~10% CEST contrast at 4.2ppm with pH dependency.
CEST contrast remains constant over a week in vivo at 3T.
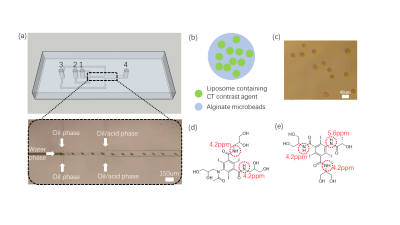
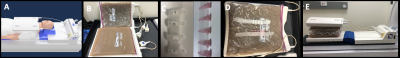
Figure 1 Microfluidic preparation of alginate
microbeads incorporated with Iopamiro or Iohexol-loaded liposome. (a) Microfluidics
design for preparation of microbeads. 1, 2, 3 were inlets for water phase, oil
phase and oil/acid phase, respectively, and 4 was outlet. (b) Schematic
of liposomal hydrogel beads, i.e. alginate microbeads containing liposomes
loaded with CT contrast agent (CT-lipobead). Prepared lipobeads(c). Chemical
structure of Iohexol (d) and Iopamiro (e), and protons that can
be detected by CEST are in red circles.
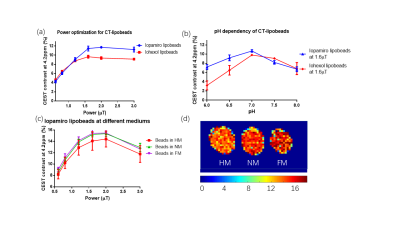
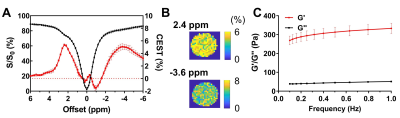
Figure 2 Power optimization and pH dependency for CT-lipobeads showing that CEST contrast at 4.2ppm
reach the highest value at 1.6uT and 2.0uT for both beads and capability to
distinguish HM from NM. CEST contrast for Iopamiro liposome beads and Iohexol
liposome beads at different B1 at neutral pH(a). CEST contrast at 4.2ppm in
saline with different pH at 1.6 uT(b). CEST contrast at 4.2ppm in Iopamiro lipobeads
in HM, NM and FM at 1.6 uT (c) and corresponded CEST map(d). pH of HM, NM and
FM are 6.8, 7.1 and 7.2, respectively. HM: Hypoxic medium. NM: Normoxic medium.
FM: Fresh medium
-
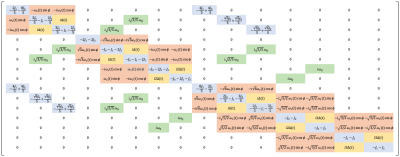
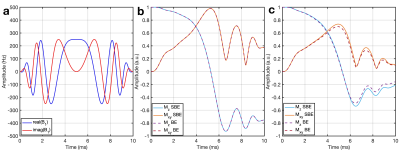
Linear combination SSFP for multi-site chemical shift imaging: Applications to Deuterium Metabolic Imaging
Dana C. Peters1, Stefan Markovic2, Qingjia Bao2, Dina Preise2, Keren Sasson2, Lilach Agemy2, Avigdor Scherz2, and Lucio Frydman2
1Radiology and Biomed Eng., Yale University, New Haven, CT, United States, 2Weizmann Institute of Science, Rehovot, Israel
Linear combination bSSFP is useful for deuterium metabolic imaging.
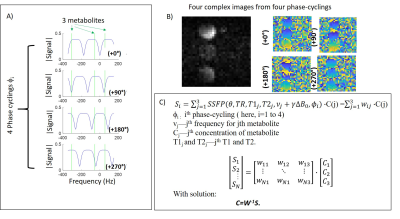
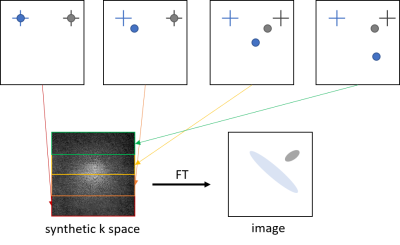
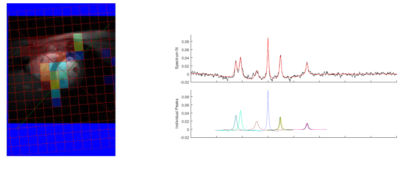
Figure
1:
A) Plot of the modulus of SSFP’s signal vs. frequency offset under the four phase-cyclings, shifting the “banding“
pattern as indicated for TR=5.7ms. Also shown are the frequencies expected for
deuterated lactate, glucose and water (green lines) at the utilized field. B) 2H
MRI acquisition of bSSFP images with multiple phase-cyclings on a
three-metabolite phantom. C) The images can be analyzed as a sum of complex signals (shown in A) arising from each metabolite, based on the phase-cycling; the contribution of
each metabolite is then determined by matrix inversion.
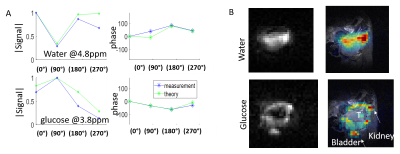
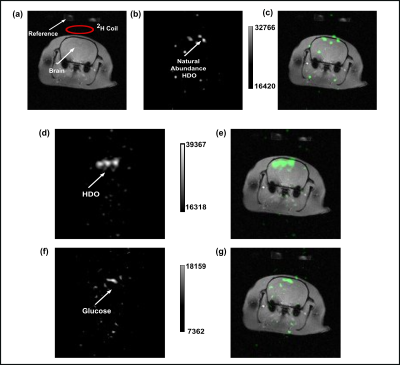
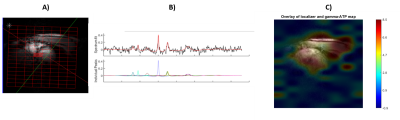
Figure 5: LC-SSFP of
deuterated water and glucose in a pancreatic cancer tumor, 30 minutes after
injection of deuterated glucose (i.e, before the generation of substantial 2H-lactate). A) Magnitude/phase signal evolutions of water
(top) and glucose (bottom), comparing measured values to predicted values. The TR was 5.7ms, and carrier offset 4.3ppm
(between glucose and water). B) Metabolites
separated using LC-SSFP’s theoretical weights.
T=tumor. Left: Raw 2H images. Right: 2H images
overlaid on 1H MRI anatomy.
-
Multiparametric MRI of Renal Tissue Shows Dietary Differences Between Survivors and Non-survivors in Sepsis-associated Acute Kidney Injury
Wan-Ting Zhao1,2,3, Karl-Heinz Herrmann1, Martin Krämer1, Renat Sibgatulin1, Ali Nahardani1,2, Jürgen R. Reichenbach1, and Verena Hoerr1,2,4
1Medical Physics Group,Institute of Diagnostic and Interventional Radiology, University Hospital Jena, Jena, Germany, 2Center for Sepsis Control and Care, University Hospital Jena, Jena, Germany, 3Institute of Medical Microbiology, University Hospital Jena, Jena, Germany, 4Clinic for Radiology, University Hospital Muenster, Muenster, Germany
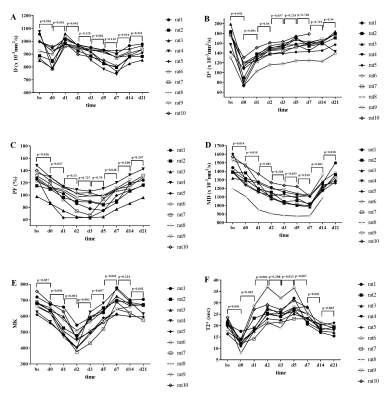
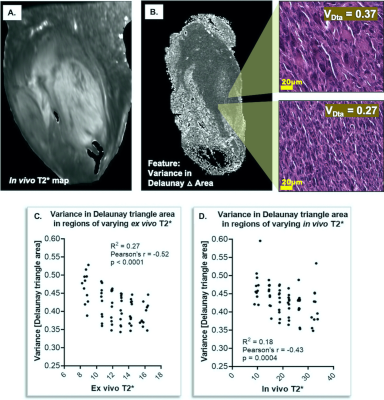
(1. Animals having received protein-rich diet showed lowest mortality rate.(2. Survivors having received protein-rich diet showed increased cortical T1 and T2 value compared to healthy rat.Scatter plot of cortical T2 and perfusion can distinguish between survivors and non-survivors
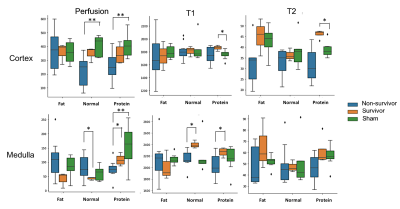
Figure 4: Compilation of cortical and medullary results of perfusion as well as T1 and T2 relaxation time for all experimental groups (survivors, non-survivors, healthy sham group) and statistical evaluation using the Mann-Whitney U-test(*: p<0.05, **:p<0.01).
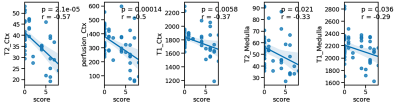
Figure 3:Cortical and medullary perfusion as well as T1 and T2 values in correlation with the severity score based on data from all experimental groups (3 different diets in both the PCI- and sham-group).
-
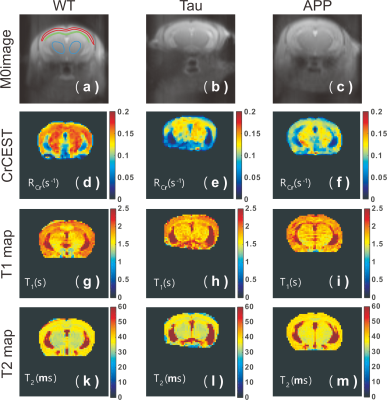
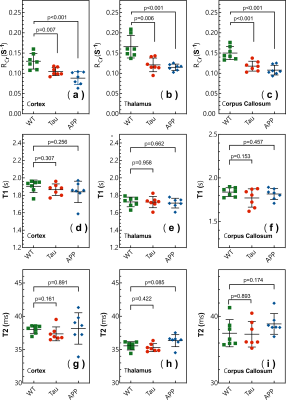
The sensitivity of amide, amine, creatine and guanidinium CEST in detecting pH at high MRI field
Lin Chen1,2 and Jiadi Xu1,2
1Department of Radiology and Radiological Science, Johns Hopkins University, Baltimore, MD, United States, 2F.M. Kirby Research Center for Functional Brain Imaging, Kennedy Krieger Research Institute, Baltimore, MD, United States
We demonstrated that creatine CEST is a highly pH-sensitive method at high field.
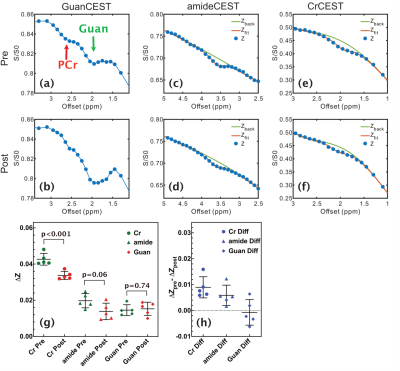
Figure 2. Representative Z-spectra for the GuanCEST experiments (a) pre
and (b) post-CO2 inhalation for the cortex region. The PCr peak is
observable and is indicated. Representative Z-spectrum of amideCEST experiment
(c) pre and (d) post-CO2 inhalation and CrCEST experiment (e) pre
and (f) post-CO2 inhalation for the cortex region. Solid lines are
the fitted background using the PLOF method. (g) Scatter plots showing the CEST
contrast difference for CrCEST, amideCEST and GuanCEST experiments obtained by
PLOF (n= 5) and the corresponding contrast changes (h).
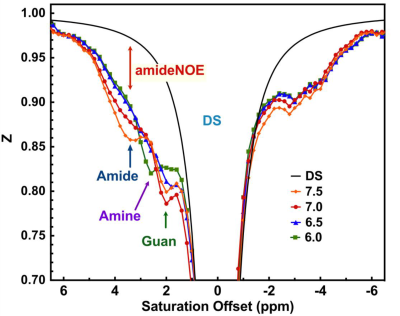
Figure 1: (a) The typical
Z-spectra of egg white that titrated to 6.0, 6.5, 7 and 7.5 pH. The spectrum
was recorded using CW-CEST with 1μT and 3s
saturation at 37°C by an air heater. The CEST peaks from amide, amine,
guanidinium, amideNOE are indicated. The simulated DS spectrum for egg white
with pH 7.5 is also plotted.
-
Novel phosphorous-based polymer for 31P-magnetic resonance imaging
Natalia Ziółkowska1,2, Ladislav Androvič3, Lucie Woldřichová3, Martin Vít1,4, David Červený1,5, Olga Šebestová Janoušková3, Richard Laga3, and Daniel Jirák1,2
1Site of Computed Tomography, Magnetic Resonance Imaging, and Clinical and Experimental Spectroscopy, Institute for Clinical and Experimental Medicine, Prague, Czech Republic, 2Institute of Biophysics and Informatics, First Faculty of Medicine, Charles University, Prague, Czech Republic, 3Institute of Macromolecular Chemistry, Czech Academy of Sciences, Prague, Czech Republic, 4Faculty of Mechatronics Informatics and Interdisciplinary Studies, Technical University of Liberec, Liberec, Czech Republic, 5Faculty of Health Studies, Technical University of Liberec, Prague, Czech Republic
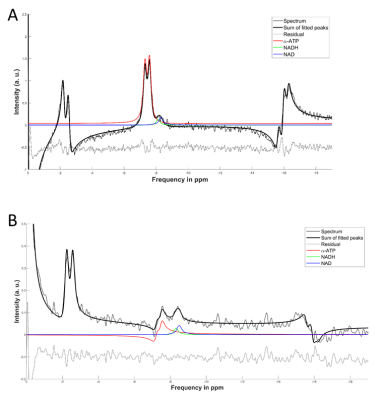
MR measurements of polymer-based 31P contrast
agent confirmed its good MR sensitivity with high signal-to-noise ratio in 31P
MR spectra and images, even for short acquisition times. 31P MR
spectroscopy confirmed large frequency offset of its Larmor frequency from biological 31P
signal.
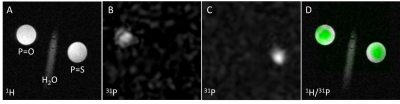
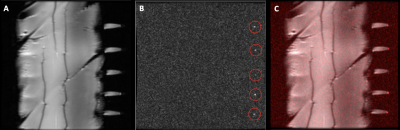
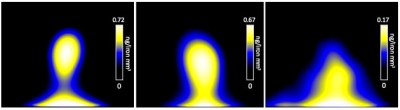
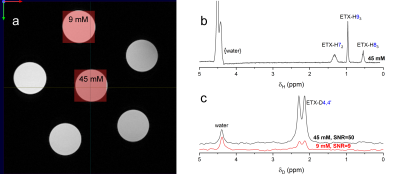
Fig. 2 MRI
measured at 4.7T scanner using 1H/31P RF surface coil. Phantoms (cP=100mmol/L;
V=1.4ml in H2O) positioning
is visible on 1H MR image (RARE sequence; ST=1min; coronal plane) with
probes containing a phosphoester (P=O) group on the left and a phosphorothioate
(P=S) group on the right with water reference between them (A). Next, 31P
MRI (CSI
sequence; ST=3h) of polymers (B: P=O; C: P=S) are presented. In
the last image, overlapped 1H/31P MR images are shown (D);
31P signal is highlighted by green colour. SNR resulting from 31P
MR images is 5.4 for P=O polymer and 13.6 for P=S polymer.
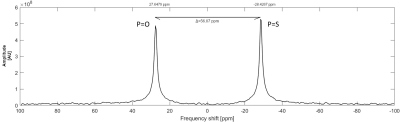
Fig.1 31P MR spectra measured at 4.7T scanner using
1H/31P RF surface coil. Single-pulse sequence (TR=200ms; ST=3h)
was used for the measurement and spectra from both p(TMPC) and p(MPC) polymers (cP=100mmol/L; V=1.4ml in H2O) were
obtained during one measurement. Peak on the left with slightly lower amplitude
represents a polymer with a phosphoester group (P=O) with SNR=163.7; peak on the right represents
a polymer with a phosphorothioate group (P=S)
with SNR=195.1. The chemical shift between the peaks is 56.07ppm.
-
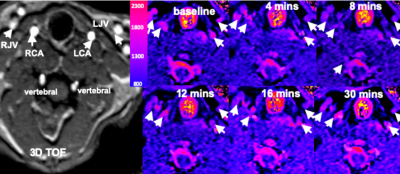
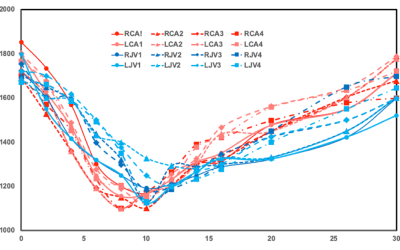
PAA-g-(DTPA-Gadolinium): A Versatile Agent to Visualize the Effiencient Interstitial Stream at 7 Tesla
Xiaohan Zhou1,2, Yi Hou3, Wentao Liu1, and Dong Han1,2
1National Centre for Nanoscience and Technology, Beijing, China, 2University of Chinese Academy of Sciences, Beijing, China, 3Beijing University Of Chemical Technology, Beijing, China
The novel agent PAA-Gd can display its high efficiency to visualize the stream in radiology and pathology study as a versatile enhancer.
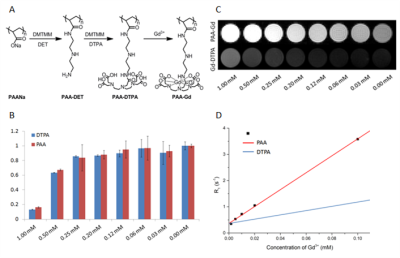
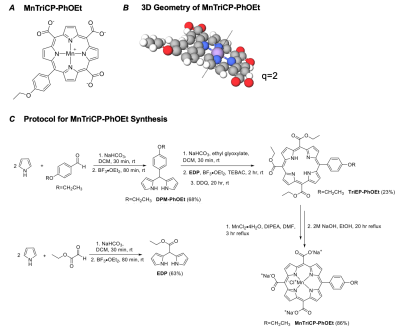
Fig1. (A) The
synthetic scheme of zwitterionic MCP contrast agent PAA-Gd. (B) Viability
of HUVE cells treated by PAA-Gd and
Gd-DTPA. (C) Signal intensity map of T1 weighted MR images (TE= 10
ms, TR= 300 ms) of aqueous solution of PAA-Gd in 200 μL Eppendorf tubes
according to different Gd3+ concentration
from 0 to 1mM. (D) Linear regression fitting curve (solid line) of calculated
R1 value (‘■’ points) was performed.
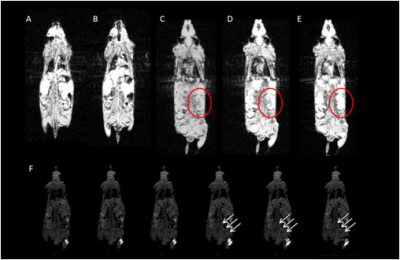
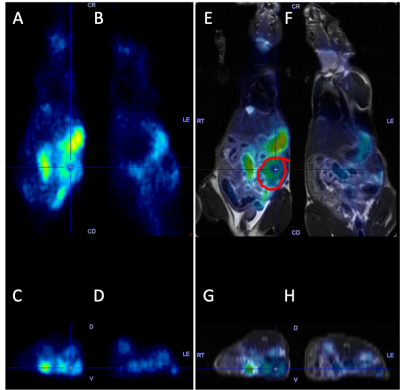
Fig2. The
image obtained immediately (A) and 12 minutes (B) after intravenous injection of PAA-Gd. DCE images of
pre-injection (C), post-injection (D) and the final status of mouse after 30
minutes (E) on the kidney plane. A long distance transportation trace is
depicted and emphasized with white arrow in (F) on centric section.
-
Assessment of Gd concentration estimated in DCE-MRI with multiple flip angles
Ayesha Bharadwaj Das1, James Andrew Tranos2, Jin Zhang1, Youssef Zaim Wadghiri2, and Gene Kim1
1Radiology, Weill Cornell Medicine, New York, NY, United States, 2Radiology, New York University School of Medicine, New York, NY, United States
This study results suggest the feasibility of using the two-flip angle approach during DCE-MRI scan to estimate pre-contrast T1 without using an extra scan in order to perform T1 measurement, when assessed in terms of Gd concentration estimation.
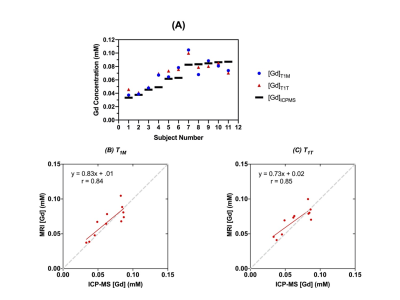
Figure 4. (A) Accuracy in image derived Gd estimation versus ICPMS measurement. The average error for T1M method was 14.3%. The average error for T1T method was 17%. (B) [Gd] from MRI measurement using T1M method and T1T method (C) vs. ICP-MS measured [Gd]. (B) has a correlation coefficient of 0.84. (C) has a correlation coefficient of 0.85. The gray dash lines are unity lines.
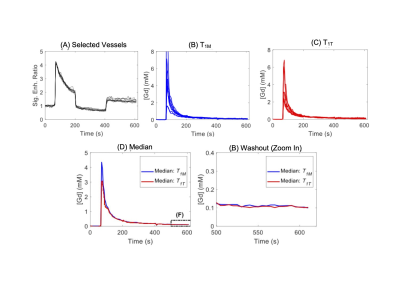
Figure 2. Example of signal intensity to [Gd] conversion using the top 10 most enhanced vessels from IAUC selection. (A) Normalized vessel signal enhancement curves. (B) Signal enhancement curves converted to [Gd] using T1M. (C) Signal enhancement curves converted to [Gd] from T1T. (D) All signal enhancement curves overlaid with a dashed box over the tail end. (E) A zoomed-in image for the tail end of the signal enhancement curves. The concentrations at last time point (610 s) were used to cross validation with ICP-MS method.
-
Evaluation of cellular sensitivity for magnetic particle imaging and fluorine-19 magnetic resonance imaging
Olivia C Sehl1,2 and Paula J Foster1,2
1Imaging Research Laboratories, Robarts Research Institute, London, ON, Canada, 2Medical Biophysics, University of Western Ontario, London, ON, Canada
The detection of stem cells using 19F MRI and MPI with common cell labeling agents (perfluorocarbon and ferucarbotran) was evaluated. There were significant increases in 19F and MPI signal with cell number and fewer cells were detected with MPI.
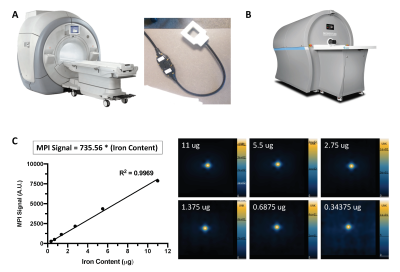
Figure 1: A picture of the (A) 3 Tesla clinical MRI (MR750, General Electric) and dual-tuned (1H/19F) surface coil (MR Solutions) used for 19F imaging, and (B) preclinical MomentumTM MPI scanner (Magnetic Insight Inc.). (C) The relationship between MPI signal and iron mass is determined for MPI signal calibration by imaging known amounts of ferucarbotran with 3.0 T/m gradients.
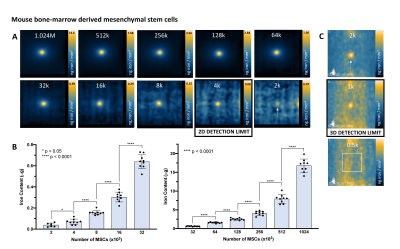
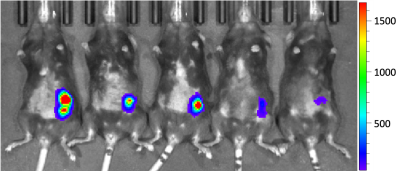
Figure 4: MPI detection of ferucarbotran-labeled MSC. (A) 2D MPI of individual MSC pellets containing various cell numbers (M = 106, k = 103). As few as 2000 MSC was detected in 6 of 9 replicates, however with low SNR (2.51). The detection limit of 4000 MSC is reliable and quantifiable (9/9 replicates, SNR = 3.77). (B) 2D MPI signal (and the associated iron content) significantly increases with number of MSC. (D) In 3D (35 projections), 2000 cells can be reliably detected (9/9 replicates, SNR = 6.42) and as few as 1000 cells were detected in 2 of 9 replicates (SNR = 4.69, signal volume 116mm3).
-
Detecting Extreme Small Lesions in MR images with Point Annotations via Multi-task Learning
Xiaoyang Han1, Yuting Zhai1, Botao Zhao1, and Xiao-Yong Zhang1
1Institute of Science and Technology for Brain-Inspired Intelligence, Fudan University, Shanghai, China
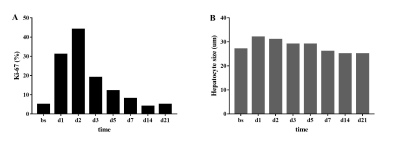
We develop a multi-task learning model for extreme small lesion detection tasks to detect magnetic particle deposition in MR images. The proposed end-to-end network can simultaneously detect the number and the location of small lesions with acceptable precision and sensitivity.
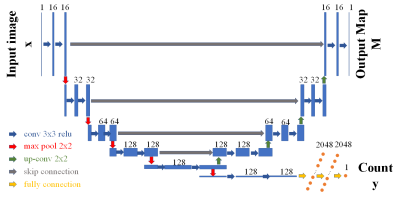
Figure 1. Multi-task learning structure. The input images are on the left; the output count of lesions is on the bottom right; the output map is on the top right: distance map for point annotation dataset and segmentation map for full segmentation dataset. After each convolutional layer, a rectified linear unit activation is applied. In the regression network, after the last convolutional layer, a global max-pooling layer is added to connect the following fully connected layers.
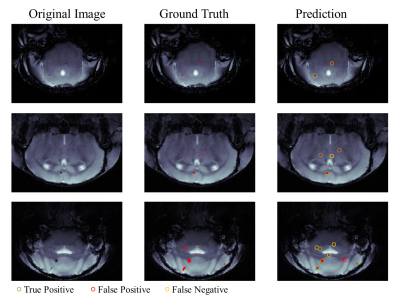
Figure 4. Representative detection results. In the prediction image (right column): green circle for true positive, red circle for false positive and orange circle for false negative.
-
Diagnostic value of Gd-contrast administration for spinal cord MRI in MS patients and T2 signal ratio as a predictive marker of lesion activity
Kianush Karimian-Jazi1, Ulf Neuberger1, Katharina Schregel1, Gianluca Brugnara1, Daniel Schwarz1, Laura Jäger2, Wolfgang Wick2, Martin Bendszus1, and Michael Oliver Breckwoldt1
1Neuroradiology, University Clinic of Heidelberg, Heidelberg, Germany, 2Neurology, University Clinic of Heidelberg, Heidelberg, Germany
Gd-contrast administration is dispensable in follow-up spinal MRI of MS patients if no new T2 lesions are present. We show high sensitivity and specificity of the T2 signal ratio as a predictor for enhancing, “active” lesions and propose a shortened, single MRI protocol for routine follow-up MRI
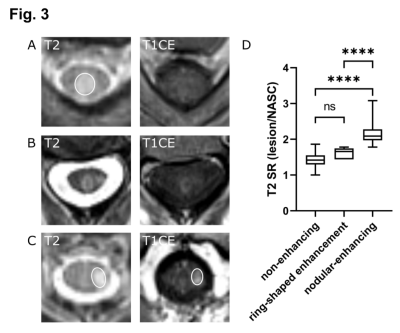
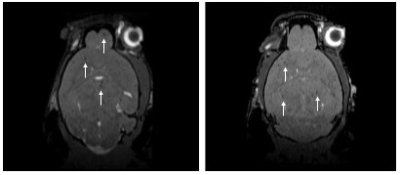
Fig. 3 Representative MRI images of axial T2-w and T1-w CE images showing different lesion morphologies. (A) T2 lesion without corresponding enhancement and a low T2 signal ratio (SR: 1.54). (B) Ring-enhancing lesion with a T2 SR of 1.78. (C) T2 lesion with a high T2 signal ratio (SR: 1.93) and clear contrast-enhancement. (D) Nodularenhancing lesions (n=33) showed significantly higher T2 signal ratios than nonenhancing (n=185, ****p<0.0001) and ring-shaped enhancing lesions (n=5 ****p<0.0001). NASC: normal appearing spinal cord.
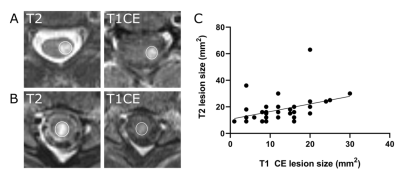
Fig. 2 T2-w and T1-w contrast enhanced images (A, B). Size of the T2 lesion weakly correlates with the size of the contrast enhancement (C). Pearson correlation analysis, r2 = 0.17, **p < 0.01, n = 44 lesions).
-
Is MRI Contrast Stable in High-Energy Radiation of MR-Linac?
Travis Salzillo1, Yongying Jiang2, Yuri Mackeyev3, Clifton David Fuller1, Caroline Chung1, Seungtaek Choi1, Neil Hughes1, Yao Ding4, Jinzhong Yang4, Sastry Vedam5, Sunil Krishnan3, and Jihong Wang4
1Radiation Oncology, University of Texas MD Anderson Cancer Center, Houston, TX, United States, 2Institute for Applied Cancer Science, University of Texas MD Anderson Cancer Center, Houston, TX, United States, 3Radiation Oncology, Mayo Clinic, Jacksonville, FL, United States, 4Radiation Physics, University of Texas MD Anderson Cancer Center, Houston, TX, United States, 5Radiation Oncology, University of Maryland, Baltimore, MD, United States
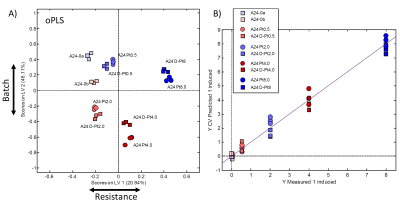
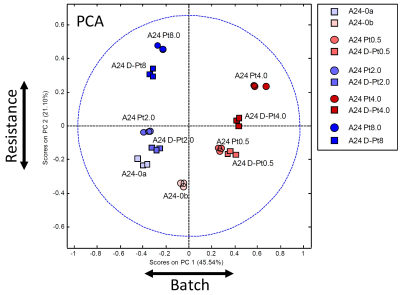
There was no visible change in LC-HRMS spectra between the
irradiated samples and unirradiated/reference samples for either contrast agent.
The quantification of the peak areas was uniform among all the samples, and
there was no significant correlation of peak area with dose.
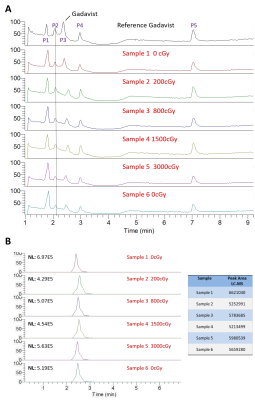
Liquid
chromatography-high-resolution mass spectrometry (LC-HMRS) chromatograms of
gadobutrol samples exposed to various doses of radiation. The entire profile is
displayed in (A) where 5 peaks are visible. Peak P3 was identified as
gadobutrol, which is enlarged and quantified in (B).
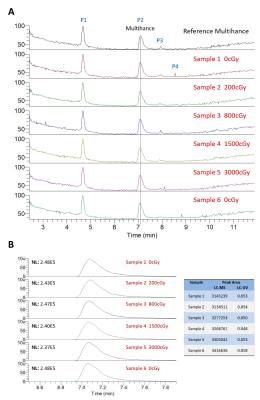
Liquid chromatography-high-resolution
mass spectrometry (LC-HMRS) chromatograms of gadobenate dimeglumine samples exposed to
various doses of radiation. The entire profile is displayed in (A) where
5 peaks are visible. Peak P2 was identified as gadobenate dimeglumine, which is enlarged and
quantified in (B).
-
Contrast enhancement of the normal infundibular recess using 3D FLAIR
Iichiro Osawa1, Eito Kozawa1, Yuya Yamamoto1, Sayuri Tanaka1, Taira Shiratori1, Akane Kaizu1, Kaiji Inoue1, and Mamoru Niitsu1
1Saitama Medical University Hospital, Saitama, Japan
The infundibular
recess (IR) was enhanced on HT2-FLAIR after an intravenous gadolinium
injection. Enhancement was stronger on post-contrast images than on 4-h delayed
post-contrast images. IR showed stronger enhancement than other CSF spaces.
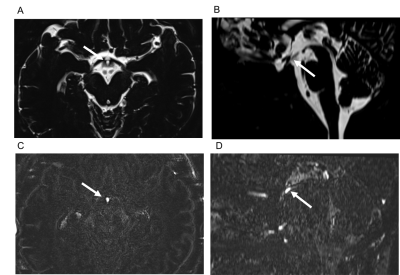
Figure 1. Contrast enhancement of the infundibular recess.
The infundibular recess is hyperintense on axial (A, arrow) and midsagittal
reformatted (B, arrow) MR cisternography (MRC). It shows contrast enhancement
on axial (C, arrow) and midsagittal reformatted (D, arrow) post-contrast HT2-FLAIR.
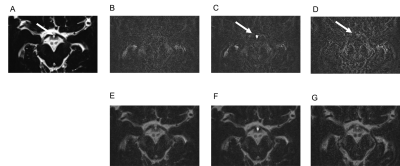
Figure 2. Chronological changes in contrast enhancement in the
infundibular recess.
The infundibular recess (IR) is hyperintense on MR cisternography (MRC)
(A, arrow). On HT2-FLAIR, compared with a pre-contrast image (B), a post-contrast
image (C, arrow) of IR shows stronger enhancement. A 4-h delayed post-contrast
image (D, arrow) shows weaker enhancement. We fuse MRC and each HT2-FLAIR into
one image (E, F, and G), and enhancement on post-contrast HT2-FLAIR (F)
corresponds to IR hyperintensity on MRC.
-
Whole-Brain T1 and T2 Mapping in Mouse by 3D Magnetic Resonance Fingerprinting
Yuran Zhu1, Yuning Gu1, Kihwan Kim1, Charlie Androjna2, Chris A. Flask1,3,4,5, Yong Chen3,6, and Xin Yu1,3,7
1Department of Biomedical Engineering, Case Western Reserve University, Cleveland, OH, United States, 2Lerner Research Institute, Cleveland Clinic Foundation, Cleveland, OH, United States, 3Department of Radiology, Case Western Reserve University, Cleveland, OH, United States, 4Department of Pediatrics, Case Western Reserve University, Cleveland, OH, United States, 5Cancer Imaging Program, Case Western Reserve University, Cleveland, OH, United States, 6Biomedical Research Imaging Center (BRIC), University of North Carolina at Chapel Hill, Chapel Hill, NC, United States, 7Department of Physiology and Biophysics, Case Western Reserve University, Cleveland, OH, United States
A 3D MRF sequence was developed for simultaneous T1 and T2
mapping of the entire mouse brain. Our results demonstrate that up to 16-fold in-plane and 3-fold through-plane
undersampling can be achieved with adequate accuracy, allowing whole-brain T1 and T2 mapping in 3 to 5 minutes.
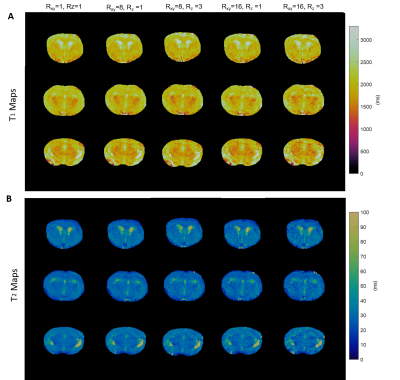
Figure
2. Retrospective
undersampling analysis on a fully-sampled mouse brain. A.
T1 maps of fully sampled (Rxy=1, Rz=1) mouse
brain and prospectively undersampled data (Rxy=8, Rz=1; Rxy=8,
Rz=3; Rxy=16, Rz=1; Rxy=16, Rz=3)
of three central axial views. B. T2
maps of fully sampled and undersampled results.
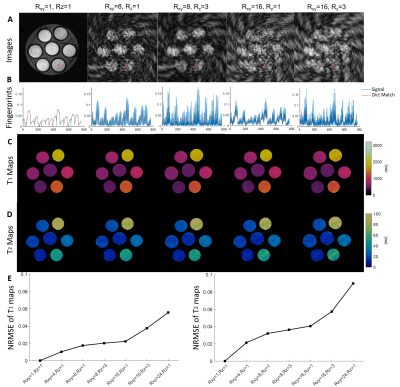
Figure
1. Retrospective
undersampling analysis of fully-sampled phantom data. A. Images of the 120th frame image of a central axial view
reconstructed from fully sampled data (Rxy=1, Rz=1) and
undersampled data (Rxy=8, Rz=1; Rxy=8, Rz=3;
Rxy=16, Rz=1; Rxy=16, Rz=3). B. Plots of fingerprints vs.
dictionary matching results for the pixel highlighted in A. C. T1 maps of fully sampled
and undersampled results. D. T2
maps of fully sampled and undersampled results. E. Normalized RMSE (NRMSE) of T1 and T2 estimations with different
undersampling factors.
-
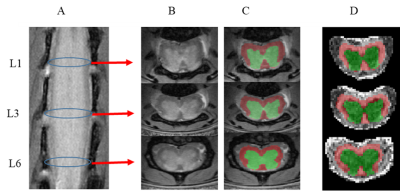
In vivo characterization of effect of microglia regeneration after high altitude exposure by quantitative MRI in mice
Alexandru V Korotcov1,2, Caroline A Browne3, Andrew K Knutsen1,2, Dara L Dickstein2,4, Juan Wang4, Xiufen Xu2,5, Kathleen Whiting2,5, Shalini Jaiswal1,2, Allison Nathanael1, Daniel P Perl4, Zygmunt Galdzicki2,5, and Bernard J Dardzinski1,2
1Radiology and Radiological Sciences, Uniformed Services University, Bethesda, MD, United States, 2Center for Neuroscience and Regenerative Medicine, Henry M. Jackson Foundation, Bethesda, MD, United States, 3Department of Pharmacology & Molecular Therapeutics, Uniformed Services University, Bethesda, MD, United States, 4Department of Pathology, Uniformed Services University, Bethesda, MD, United States, 5Department of Anatomy, Physiology and Genetics, Neuroscience Program, Uniformed Services University, Bethesda, MD, United States
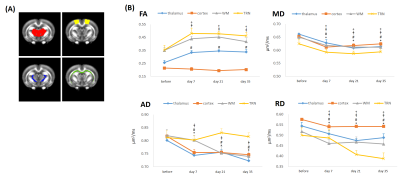
Behavioral tests and MRI preliminary analysis suggest that novel treatment with microglial regeneration could restore spatial memory, enhance cued fear memory and reverse some neuropathological deficits induced by chronic high-altitude exposure.
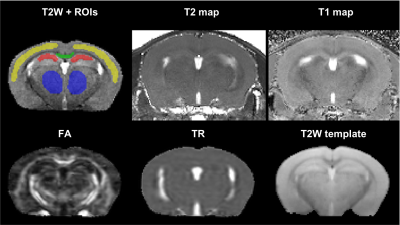
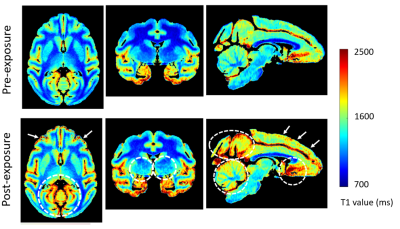
Representative T2-weighted high resolution image overlayed with manually drawn ROIs, T2 map, T1 map, FA, TR and the template MR image.
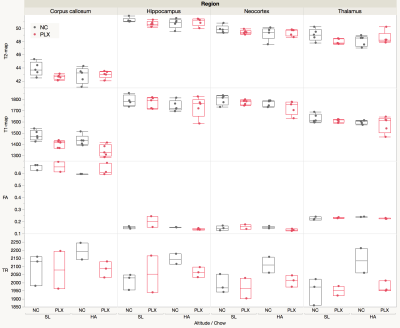
The T2, T1, FA, and TR ROIs values in four brain regions are shown on the panel. The analysis of the derived results showing elevated trace values in all selected regions in HA conditioned mice which was reversed by PLX treatment.
-
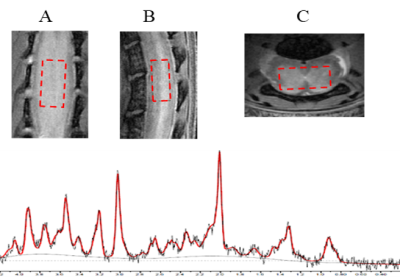
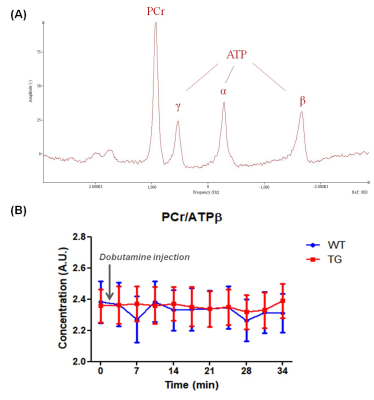
Measurement of ATP Hydrolysis Rates in the In Vivo Heart at 7T
Adil Bashir1, Jianyi Zhang2, and Thomas S Denney3
1Department of Electrical and Computer Engineering, Auburn University, Auburn, AL, United States, 2Biomedical Engineering, The University of Alabama at Birmingham, Birmingham, AL, United States, 3Electrical and Computer Engineering, Auburn University, Auburn, AL, United States
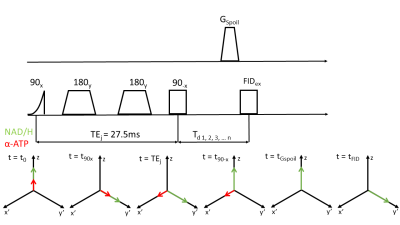
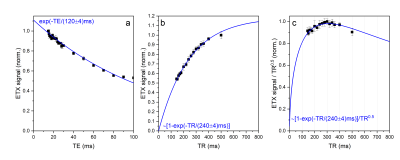
We demonstrate the application of indirect technique to
measure Adenosine Triphosphate (ATP) hydrolysis reaction rate constant in the in
vivo heart, without the need to quantify inorganic phosphate (Pi)
concentration. The technique was applied in human and swine hearts.
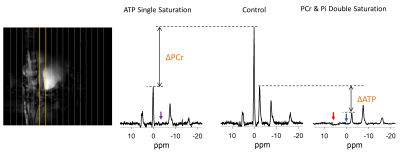
Three representative spectra from magnetization saturation transfer (MST) experiment in swine heart to measure myocardial 31P reaction rates. Control spectrum (middle) without saturation pules to measure $$$ M_{o,PCr} $$$ , and $$$ M_{o,γATP} $$$. Single resonance (γ-ATP) saturated spectrum (left) to quantify $$$ M_{s,PCr} $$$. Dual resonance(PCr and Pi) saturated spectrum (right) to quantify $$$ M_{s,γATP} $$$ .
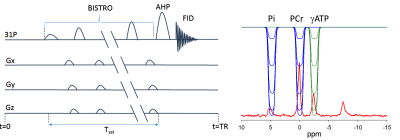
(a) BISTRO based saturation transfer pulse sequence. Tsat is the saturation time (b) Simulationof single saturation (green) and dual saturation (blue) BISTRO RF pulse at various power levels overlaid over spectrum from heart demonstrating saturation of γ-ATP (single saturation) and PCr and Pi (dual saturation) frequencies.
-
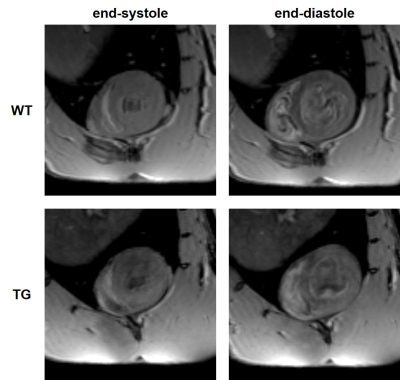
Radial tiny golden angle MRI combined with Cardiac and Respiratory Self-Gating in the Small Animal model – one acquisition, many possibilities
Patrick Metze1, Hao Li2, and Volker Rasche1,2
1Internal Medicine II, Ulm University Medical Center, Ulm, Germany, 2Core Facility Small Animal Imaging (CF-SANI), Ulm University, Ulm, Germany
Radial
tiny golden angle MRI allows for reconstruction of high-quality respiratory and
cardiac gated images and sliding-window real-time imaging from the same
continuous acquisition, enabling e.g. simultaneous perfusion and function
assessment.
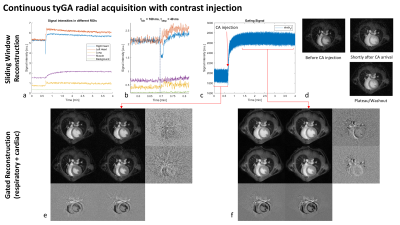
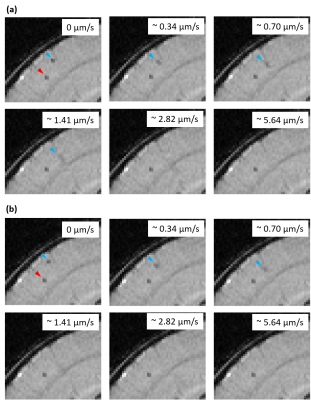
Figure 4: Continuous
tyGA acquisition with simultaneous administration of contrast agent. a) and c)
show image ROI and k-space intensities over the whole acquisition, b) shows the
image intensities around the timepoint of administration. d) shows example
sliding-window images and e) and f) correspond to dual gated reconstructions
before and after contrast administration. Row-wise differences indicate
different respiration stages, column-wise differences show the influence of the
cardiac phase.
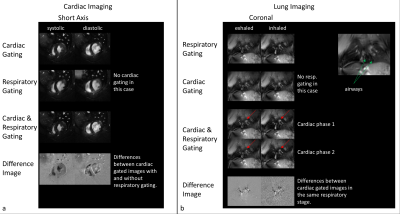
Figure 3: Self-gated
reconstructions of an exemplary cardiac (SAx) and lung (coronal) acquisition. Due to the properties of the tyGA trajectory, artefact levels for respiratory ungated cardiac
imaging is very low. However, differences to respiratory gated imaging can not only be seen
in the vessels, but also in the heart itself. Cardiac
gating seems mandatory for lung imaging, as shape and position of vessels
clearly change with the heartbeat and could influence functional measurements.
-
Anatomical and microstructural brain alterations in the TDP-M323K mouse model of amyotrophic lateral sclerosis
Aurea B Martins-Bach1, Mohamed Tachrount1, Cristiana Tisca1, Lily Qiu1, Shoshana Spring2, Jacob Ellegood2, Brian J Nieman2, John G. Sled2, Remya Raghavan-Nair 3, Elizabeth Fisher4, Thomas Cunningham3, Jason Lerch1, and Karla Miller1
1Wellcome Centre for Integrative Neuroimaging, University of Oxford, Oxford, United Kingdom, 2Mouse Imaging Centre, The Hospital for Sick Children, Toronto, ON, Canada, 3Mammalian Genetics Unit, MRC Harwell Institute, Oxford, United Kingdom, 4Department of Neuromuscular Diseases, Institute of Neurology, University College London, London, United Kingdom
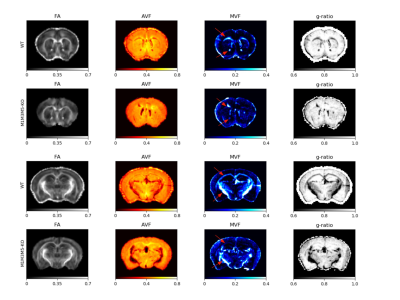
ALS is a devastating disease characterized by aggregates of TDP-43 protein in the brain. We assessed structural and microstructural alterations in the brain of TDP-M323K mice with preclinical MRI. This mouse model of ALS presented imaging alterations compatible with neurodegeneration.
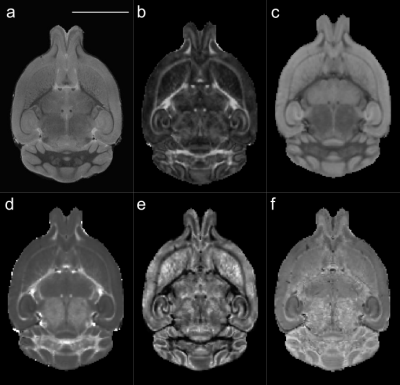
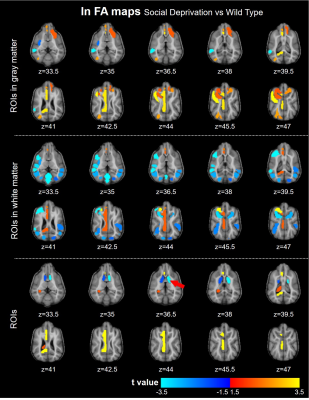
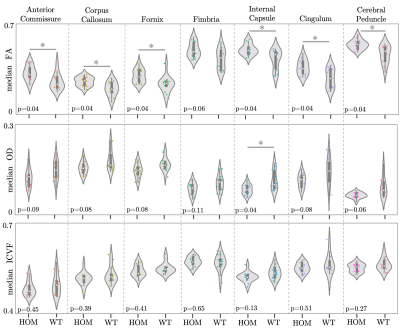
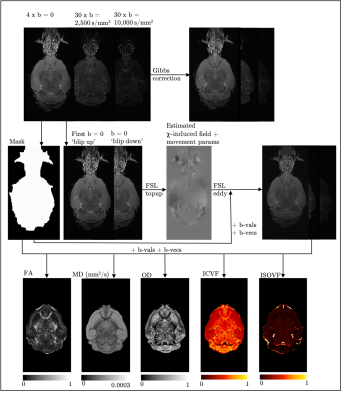
Figure 1. Representative images and diffusion MRI maps. (a) T2w structural image for volumetric
analysis. b-d: Parametric maps extracted from diffusion MRI after modelling the
signal to the diffusion kurtosis model: FA: fractional anisotropy (b), MD: mean
diffusivity (c), and MK: mean kurtosis (d). e,f: Parametric maps extracted using
the NODDI model: OD: orientation dispersion (e) and ICVF: intracellular volume
fraction (f). Scale bar: 5 mm.
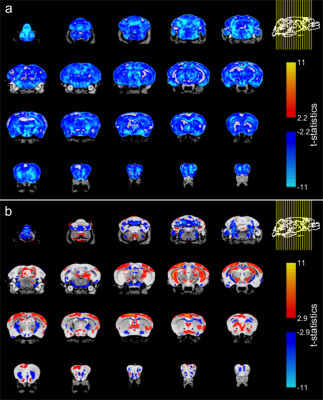
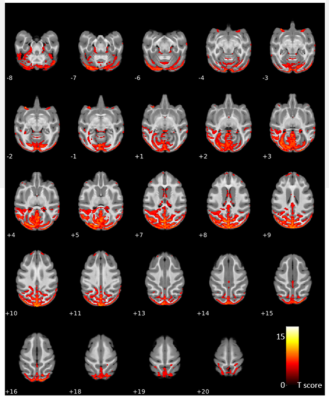
Figure 3. Effect of genotype in brain volume in TDP-M323K mice. (a) When compared directly to WT mice, TDP-M323K mice showed smaller volumes in almost all regions of the brain. (b) When volumes relative to the whole brain size were compared, TDP-M323K mice showed atrophy mainly in the white matter, while regions in the cortex and hippocampus had relatively increased volume. Most of the spatial patterns in t-statistics maps are bilaterally symmetric. Atrophic regions in TDP-M323K mice are show in blue and hypertrophic regions are show in red/yellow. False discovery rate of 5%.
-
Changes in Correlation Between Brain Metabolites Due to Acute Stress in Mouse Hippocampus using Proton Magnetic Resonance Spectroscopy
Chang-Soo Yun1, Yoon Ho Hwang2, Min-Hee Lee3, Wooseung Kim2, Jehyeong Yeon1, Hyeon-Man Baek4, Dong Youn Kim2, and Bong Soo Han1
1Radiation Convergence Engineering, Yonsei University, Wonju-si, Gangwon-do, Korea, Republic of, 2Biomedical Engineering, Yonsei University, Wonju-si, Gangwon-do, Korea, Republic of, 3Institute of Human Genomic Study, Korea University, Ansan-si, Gyeonggi-do, Korea, Republic of, 4Gachon Advanced Institute for Health Sciences and Technology, Gachon University, Incheon-si, Korea, Republic of
To
observe changes in correlations between metabolites from the glutamatergic and
aspartate systems due to acute stress using MRS.
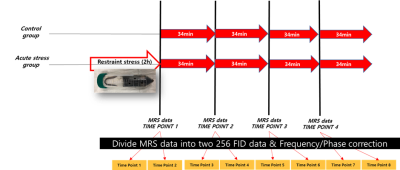
Fig.
1. The 256 FID MRS data acquisition protocol in the acute stress experiment
using 9.4T Bruker equipment.

Fig. 2. Non-parametric sign test about correlation
coefficient value both of two experimental groups. The orange box is satisfied
with the statistically significant sign test p < 0.05. The Control group
has not significant correlation coefficient between
all metabolites. However, acute stress group have significant between Gln-GSH,
Glu-NAA, GSH-NAA.
-
Phenotyping a Mouse Model of TRAPPC9-Associated Intellectual Disability using Magnetic Resonance Imaging
Mark David Platt1, Harish Poptani1, Antonius Plagge2, and Mahon Maguire1
1Molecular and Clinical Cancer Medicine, University of Liverpool, Liverpool, United Kingdom, 2Cellular and Molecular Physiology, University of Liverpool, Liverpool, United Kingdom
In vivo
MRI demonstrated significant differences between the whole brain, cerebellar
and corpus callosum volumes of adult TRAPPC9 knockout mice and wildtype
controls. Behavioural assays also revealed significant differences in learning
ability.
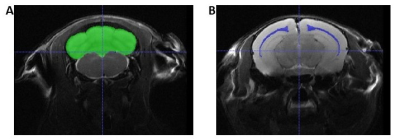
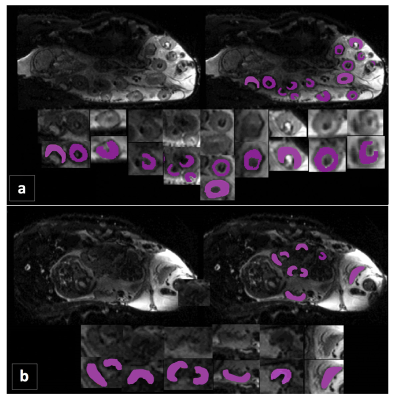
Figure 1: Example slices of the in vivo T2-weighted images with segmentation masks for the
cerebellum (A) and corpus callosum (B) overlaid in ITK-Snap (http://www.itksnap.org).
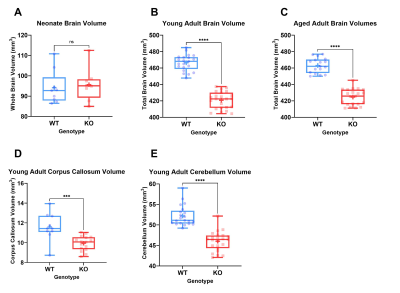
Figure 2: Boxplots showing the full range, median and
average (+) values for brain volumes in neonates (A), young adults (B), aged adults
(C) and regional volumes of corpus callosum (D) and cerebellum (E). Significance
levels are indicated by: ns = P > 0.05, * = P ≤ 0.05, **= P ≤ 0.01, ***= P ≤ 0.001, ****=
P ≤ 0.0001.
-
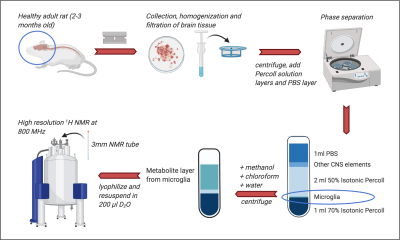
Cerebral metabolic derangements as translatable biomarkers in pantothenate kinase-associated neurodegeneration mouse model via 1H MRS
Puneet Bagga1, Jeffrey Steinberg2, Walter Akers2, Zoltan Patay1, Beth McCarville1, Chitra Subramanian3, Charles O Rock3, and Suzanne Jackowski3
1Department of Diagnostic Imaging, St Jude Children's Research Hospital, Memphis, TN, United States, 2Center for In Vivo Imaging and Therapeutics (CIVIT), St Jude Children's Research Hospital, Memphis, TN, United States, 3Department of Infectious Diseases, St Jude Children's Research Hospital, Memphis, TN, United States
1H MRS detectable metabolic derangements in a preclinical model of pantothenate kinase-associated neurodegeneration (PKAN) as biomarkers of drug response.
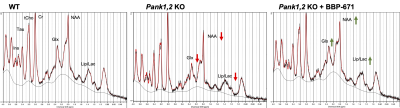
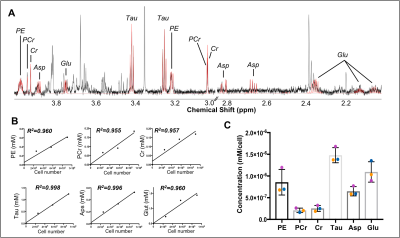
Figure 2. Representative 1H MR spectra from three groups Left. Wild Type, Mid. Pank1,2 neuronal KO, and Right. Pank1,2 neuronal KO mouse treated with BBP-671
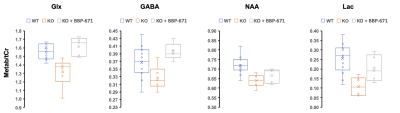
Figure 3. Metabolite to total creatine ratios of glutamate+glutamine (Glx), γ-amino butyric acid, N-acetyl aspartate, and lactate