-
Vertebral bone marrow water T2 is sex-dependent and negatively correlated with age and the proton density fat fraction (PDFF)
Stefan Ruschke1, Jan Syväri1, Michael Dieckmeyer2, Daniela Junker1, Marcus R. Makowski1, Thomas Baum2, and Dimitrios C. Karampinos1
1Department of Diagnostic and Interventional Radiology, School of Medicine, Technical University of Munich, Munich, Germany, 2Department of Diagnostic and Interventional Neuroradiology, School of Medicine, Technical University of Munich, Munich, Germany
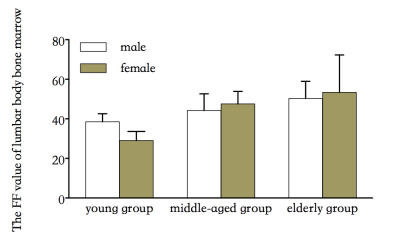
Vertebral bone marrow
water T2 assessed by single-voxel multi-TE STEAM MRS showed a significant
sex-dependence and a negative correlation with age and PDFF.
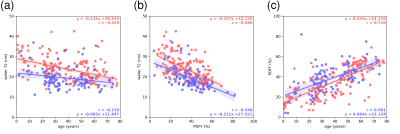
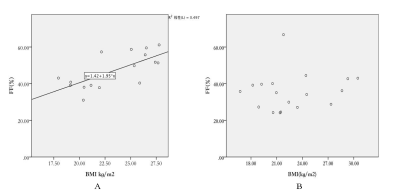
Figure 3: Results
from the linear regression analysis for the female (red) and male (blue)
sub-cohort for a) water T2 vs age, b) water T2 vs. PDFF and c) PDFF vs. age.
Water T2 as a function of both age (a) and PDFF (b) was longer in females when
compared to the males. Furthermore, water T2 showed a negative correlation with
both age (a) and PDFF (b) for both sexes.
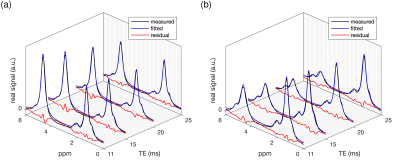
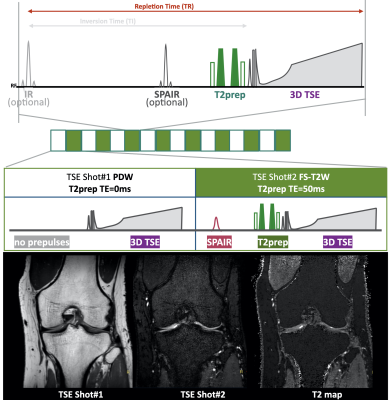
Figure 2: Example real spectra including
the obtained signal model fitting (fitted model and residual signal): a)
38-year-old female (BMI: 31.3 kg/m2, water T2: 33.3 ms, PDFF: 40%) and b)
66-year-old male (BMI: 38.6 kg/m2, water T2: 13.9 ms, PDFF: 49%). In the spectra
in a) the water peak (4.67 ppm) is more pronounced (lower PDFF and shorter
water T2) in comparison to the spectra in b).
-
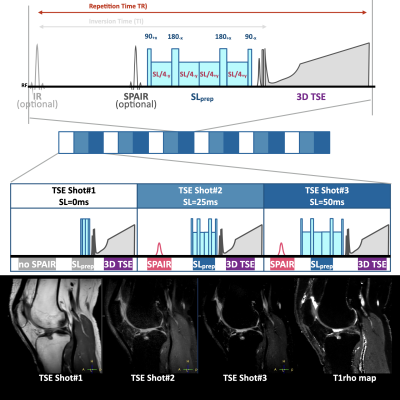
Quantitative Assessment of cartilage composition using MR T1ρ and T2 imaging 10 years Post ACL-Reconstruction
John P. Murray1,2,3, Richard Lartey1,3, Jeehun Kim1,3, Mei Li1,3, Sibaji Gaj1,3, Brendan Eck1,4, Donxing Xie1,3, Carl Winalski1,3,4, Faysal Altahawi3,4, Morgan H. Jones3,5, Bruce M Damon6, Laura J Huston7, Huyen T. Nguyen8, Michael V Knopp8, Kurt P. Spindler3,5, and Xiaojuan Li1,3,4
1Dept. of Biomedical Engineering, Lerner Research Institute, Cleveland Clinic, Cleveland, OH, United States, 2Dept. of Biomedical Engineering, Case Western Reserve University, Cleveland, OH, United States, 3Program of Advanced Musculoskeletal Imaging (PAMI), Cleveland Clinic, Cleveland, OH, United States, 4Dept. of Diagnostic Radiology, Imaging Inst., Cleveland Clinic, Cleveland, OH, United States, 5Dept. of Orthopaedic Surgery, Orthopaedics and Rheumatology Inst., Cleveland, OH, United States, 6Dept. of Radiology, Vanderbilt University, Nashville, TN, United States, 7Dept. of Orthopaedics and Rehabilitation, Vanderbilt University, Nashville, TN, United States, 8Dept. of Radiology, Wright Ctr. Of Innovation in BioMed. Imaging, The Ohio State University, Columbus, OH, United States
In a multi-vendor multi-site prospective study, significantly elevated cartilage
MR T1ρ and T2 were observed
in operated knees as compared to the contra-lateral knees at 10 years after ACL
reconstruction.
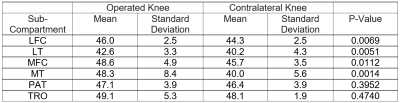
Table 2. T1ρ values (in ms) of patients in the operated
and contralateral knees. Significantly elevated T1ρ were observed in
LFC, LT, MFC and MT.
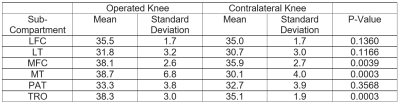
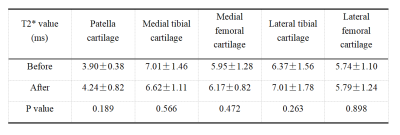
Table 3. T2 values (in ms) of patients in
the operated and contralateral knees. Significantly elevated T1ρ were
observed in MFC, MT and TRO.
-
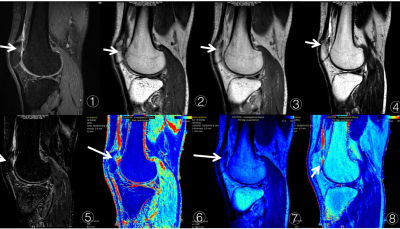
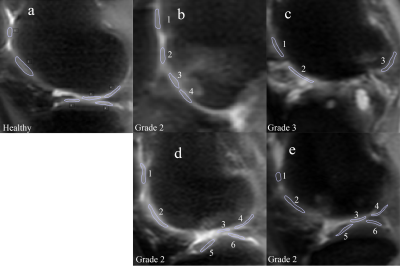
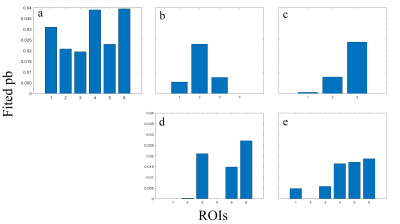
How radiology and clinical severity of knee osteoarthritis correlate: Analysis with cartilage T1rho and T2 values, WORMS, and K-L grade
Woo Young Kang1, Suk-Joo Hong1, Jinwoo Han1, Yoonmi Choi1, Chang Ho Kang2, Kyung-sik Ahn2, Baek Hyun Kim3, and Euddeum Shim3
1Radiology, Korea University Guro Hospital, Seoul, Korea, Republic of, 2Radiology, Korea University Anam Hospital, Seoul, Korea, Republic of, 3Radiology, Korea University Ansan Hospital, Ansan, Korea, Republic of
Statistically
significant correlations were revealed between WORMS features and K-L grade in
MFTJ and total joint, pain (VAS) and R1rho value in MFC, and pain (VAS) and BME
in intercondylar area.
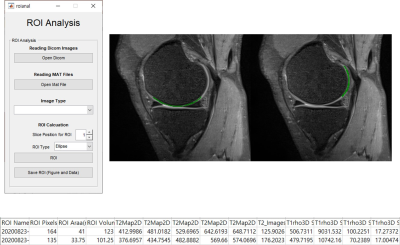
In
order
to place the ROIs in the same locations on both T1ρ and T2 maps, ROIs were
drawn manually on the PD weighted images and automatically copy –pasted on to
T1ρ and T2 maps. The automatically measured T1ρ, R1ρ and T2 TRs of each ROI
were plotted in Microsoft Excel.
All of image processing described above
was performed using software in Matlab (Mathworks, Natick, MA) that was developed
and implemented in-house.
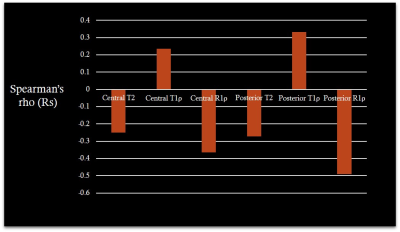
In the analysis of the association between VAS and T1ρ, R1ρ and T2 values, VAS
was significantly correlated and negatively with the R1 ρ
values in central and posterior portion of MFC.
-
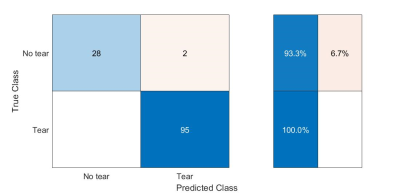
The diagnostic value of a new indicator in the chronic anterior cruciate ligament injury based on Ultra-Short Echo imaging
Yanjun Hu1, Cheng Xu1, Yexin He1, Ruizhu Wang1, and Kaiyu Wang2
1Magnetic Resonance Center, Shanxi Provincial People’s Hospital, Taiyuan, China, 2MR Research, GE Healthcare, Beijing, China
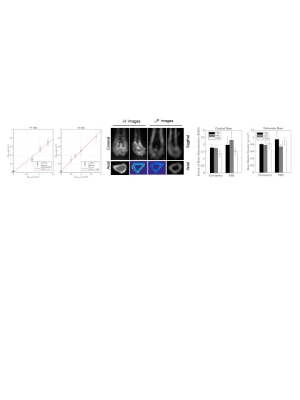
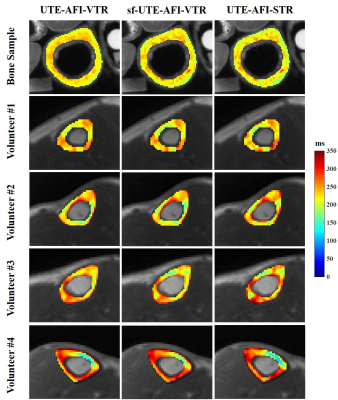
POS derived from UTE can be used to reflect the degree of chronic ACL injury and shows better performance than IKDC
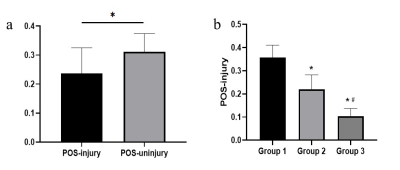
Figure 2. a:The comparison of POS between injured and uninjured group. *P<0.05. b: The comparison of POS-injury among 3 groups (Group 1: negative, Group 2: positive,Group 3:severe positive). * vs Group 1, P<0.05; # vs Group 2, P<0.05.
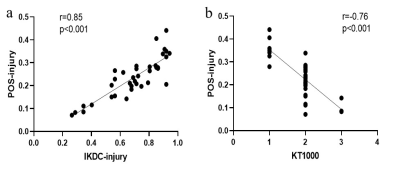
Figure 3. a:The Pearson’s correlation between POS-injury and IKDC-jnjury. b: The Pearson’s correlation between POS-injury and KT1000.
-
Repeatability and orientation dependence of ultrashort echo time (UTE) T2* mapping at 3T for the whole knee
Zhenzhou Wu1, Stefan Sommer2,3, Xiaodong Zhong4, Kecheng Liu4, Jeehun Kim1, Jillian Beveridge1, Xiaoliang Zhang5, and Xiaojuan Li1
1Program of Advanced Musculoskeletal Imaging (PAMI), Cleveland Clinic, Cleveland, OH, United States, 2Siemens Healthcare, Zurich, Switzerland, 3Swiss Center for Musculoskeletal Imaging (SCMI), Balgrist Campus, Zurich, Switzerland, 4Siemens Medical Solutions USA, Inc., Malvern, PA, United States, 5Department of Biomedical Engineering, University at Buffalo, State University of New York, Buffalo, NY, United States
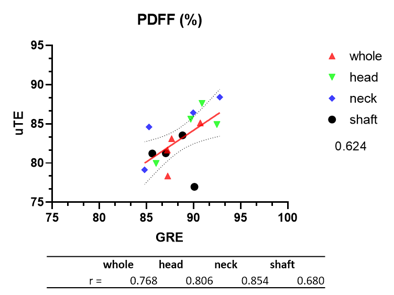
To evaluate
the repeatability of UTE T2*, and to investigate and compare the orientation
dependence of T2* mapping between UTE and regular gradient echo (GRE) imaging
sequences for whole knee imaging
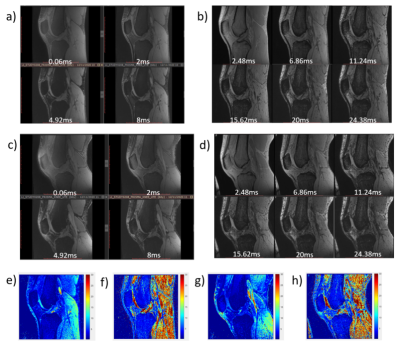
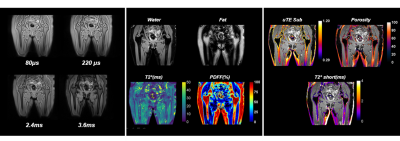
Figure 2. The 4 echoes of UTE and 6 echoes of GRE images with
different TE of extended (a and b) and flexed (c and d) knee. The
corresponding T2* mapping shown in e),
f), g), and h) respectively.
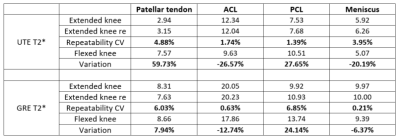
Table 3. In vivo repeatability and comparison of UTE and GRE
T2* relaxation time (in ms) of each compartment for both extended and flexed
knee joint.
-
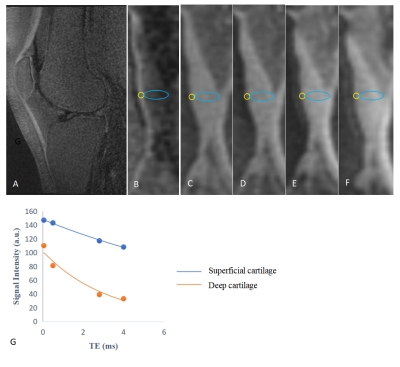
Three dimensional adiabatic T1ρ prepared ultrashort echo time Cones (3D UTE-Cones-AdiabT1ρ) imaging of knee joint degeneration
Mei Wu1,2, Yajun Ma1, Guanyuan Ning2, Saeed Jerban1, Yanping Xue1, Zhao Wei1, Eric Y Chang1,3, and Jiang Du1
1Department of Radiology, University of California San Diego, San Diego, CA, United States, 2Department of Radiology, Guangzhou First People’s Hospital, School of Medicine, South China University of Technology, Guangzhou, China, 3Radiology Service, VA San Diego Healthcare System, San Diego, CA, United States
The 3D-UTE-Cones-AdiabT1ρ
sequence allow quantitative imaging of articular cartilage in the knee joint. The
3D-UTE-Cones-AdiabT1ρ values
are positively correlated with WORMS and
KL scores, and significantly different in different extent and depth lesions of
cartilage.
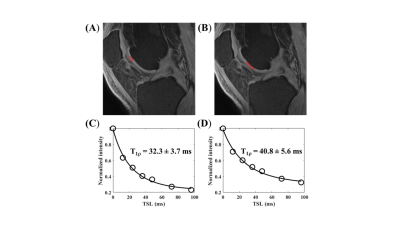
Figure 2. Excellent T1ρ modeling is
achieved for both normal cartilage (A, C) (T1ρ=32.3ms) and abnormal cartilage
(B, D) (WORMS=2, T1ρ=40.8ms).
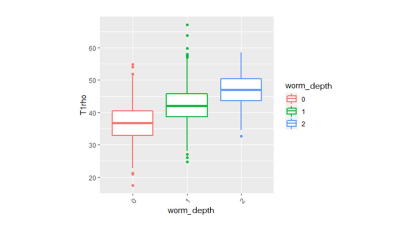
Figure 4. Boxplot
of UTE-Cones-AdiabT1ρ values in different WORMS depth groups
-
Evaluation of Dixon MRI Methods for Quantitative Assessment of Thigh Muscle Fatty Infiltration in Post-Traumatic Osteoarthritis
Brendan L. Eck1,2, Richard Lartey1,3, Dongxing Xie1,3, Jeehun Kim1,3, Carl S. Winalski1,2,3, Bruce M. Damon4, Xiaodong Zhong5, Kecheng Liu5, Dimitris Karampinos6, Faysal Altahawi1,2, Morgan H. Jones1,7, Kurt P. Spindler1,7, and Xiaojuan Li1,2,3
1Program of Advanced Musculoskeletal Imaging, Cleveland Clinic, Cleveland, OH, United States, 2Diagnostic Radiology, Cleveland Clinic, Cleveland, OH, United States, 3Biomedical Engineering, Cleveland Clinic, Cleveland, OH, United States, 4Radiology and Radiological Sciences, Vanderbilt University Medical Center, Nashville, TN, United States, 5MR R&D Collaborations, Siemens Medical Solutions USA, Inc., Malvern, PA, United States, 6Department of Diagnostic and Interventional Radiology, School of Medicine, Technical University of Munich, Munich, Germany, 7Orthopaedic Surgery, Orthopaedics and Rheumatology Institute, Cleveland Clinic, Cleveland, OH, United States
Monopolar gradient acquisition and magnitude-based processing improved
fat fraction estimates. Vendor-independent magnitude-based processing and
vendor inline processing quantified elevated hamstring muscle fat fraction in ACL-reconstructed
legs.
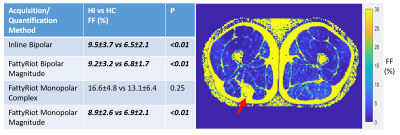
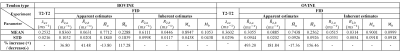
Table
1. Comparison
of average fat fraction in hamstrings muscles in the injured leg (HI) versus
the contralateral leg (HC) across acquisition and quantification methods. Bold
and italics indicate statistically significant difference in FF (p<0.05).
Other muscle groups (quadriceps, other) were similarly compared but no
significant differences were observed. In patients with hamstring autograft
(right), substantial fatty infiltration was observed (red arrow).
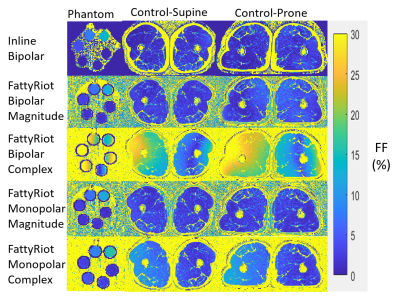
Figure
2. Fat
fraction (FF) maps from quantification methods (rows) for phantom and control
at supine and prone positions (columns). Artifact is present in FattyRiot with
complex processing, which appears to be position-dependent as it is similar across
supine and prone orientations. Monopolar gradient with complex processing
appears to reduce the amplitude of the artifact, but the pattern persists. Inline
bipolar and FattyRiot monopolar magnitude are most consistent between subject
positions.
-
Improvement of distortion-free diffusion tensor imaging of lumbar nerve roots using direct coronal MultiVane-SPLICE diffusion-weighted MRI.
Takayuki Sakai1,2, Masami Yoneyama3, Atsuya Watanabe4,5, Daichi Murayama1, Shigehiro Ochi1, and Tosiaki Miyati6
1Radiology, Eastern Chiba Medical Center, Tonage, Japan, 2Division of Health Sciences, Graduate School of Medical Sciences, Kanazawa University, Kanazawa, Japan, 3Philips Japan, Tokyo, Japan, 4General Medical Services, Chiba University Graduate School of Medicine, Chiba, Japan, 5Orthopaedic Surgery, Eastern Chiba Medical Center, Chiba, Japan, 6Faculty of Health Sciences, Institute of Medical, Pharmaceutical and Health Sciences, Kanazawa University, Kanazawa, Japan
SPLICE was combined with MultiVane (known as PROPELLER) which is to sample k-space in a rotating fashion using a set of radially directed blades. In this study, we evaluated the effect of accuracy and reproducibility of the quantitative values in lumbar nerve roots using MultiVane-SPLICE-DTI.
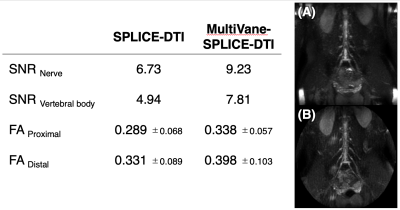
Fig.2 Comparison of SNR and FA values between SPLICE-DTI with MultiVane-SPLICE-DTI.
Partial Maximum Intensity Projection image (20mm thickness) shows on A (SPLICE-DTI) and B (MultiVane-SPLICE-DTI).
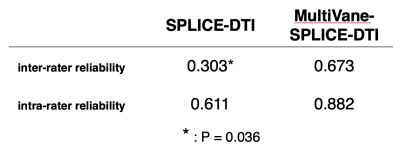
Fig.3 Comparison of ICC (inter-rater reliability and intra-rater reliability) between SPLICE-DTI with MultiVane-SPLICE-DTI in 3 healthy volunteers.
-
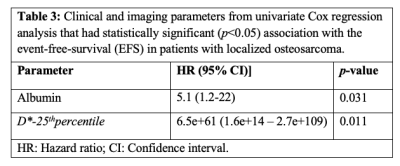
Can acquisition of pretreatment IVIM parameters in tumor predict the outcomes of osteosarcoma treated by chemotherapy? A preliminary study
Esha Baidya Kayal1, Devasenathipathy Kandasamy2, Kedar Khare3, Raju Sharma2, Sameer Bakhshi4, and Amit Mehndiratta1,5
1Centre for Biomedical Engineering, Indian Institute of Technology Delhi, New Delhi, India, 2Department of Radio diagnosis, All India Institute of Medical Sciences Delhi, New Delhi, India, 3Department of Physics, Indian Institute of Technology Delhi, New Delhi, India, 4Department of Medical Oncology, Dr. B.R. Ambedkar Institute-Rotary Cancer Hospital (IRCH), All India Institute of Medical Sciences Delhi, New Delhi, India, 5Department of Biomedical Engineering, All India Institute of Medical Sciences Delhi, New Delhi, India
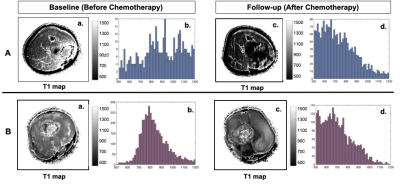
Quantitative IVIM parameters may be useful for predicting outcome in patients with localized osteosarcoma. Histogram parameter 25th-percentile of D* and serum albumin level were found to have significant association with event-free-survival among patients.
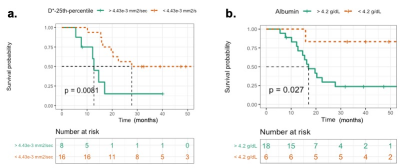
Figure 1: Kaplan-Meier survival curves of the event-free-survival (EFS) demonstrate differences in patients in outcome (a) D*-25th percentile and (b) Albumin. The significant differences are 0.0081 and 0.027 respectively by log-rank test.
.
-
Evaluation of Lumbar Disc Herniation Using Ultrashort Echo Time Magnetization Transfer in Posterior Longitudinal Ligament and Nucleus Pulposus
Jianwei Liao1, Jin Liu1, Yajun Ma2, Xiaojun Chen1, Wei Li1, Lin Yao1, Long Qian3, Jiang Du2, and Shaolin Li1
1Department of Radiology, The Fifth Affiliated Hospital of Sun Yat-Sen University, Zhuhai, China, 2Department of Radiology, University of California, San Diego, CA, United States, 3MR Research, GE Healthcare, Guangzhou, China
The high UTE-MTR of posterior
longitudinal ligament and nucleus pulposus associate with more severe lumbar disc
herniation in patients. The UTE-MTR of posterior longitudinal ligament
and nucleus pulposus may be a promising biomarker to predict early disc herniation
in lumbar spine.
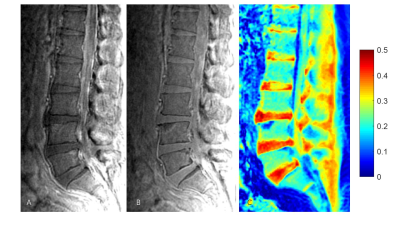
Figure 1: UTE-MT imaging in lumbar of a 63‐year‐old
male volunteer. Figure A: UTE-MT-ON; Figure
B: UTE-MT-OFF; Figure
C: UTE-MTR
map
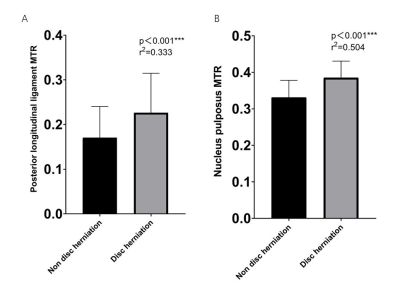
Figure 2: Correlation between disc
herniation and (A) posterior longitudinal ligament, (B) nucleus pulposus
UTE-MTR in 50 subjects.
-
Imaging Sign Of Edema As A Possible Diagnostic Aid For Lateral Lumbar Spinal Canal Stenosis
Shi Yin1, Dou Weiqiang2, and Ding Hongyuan1
1The First Affiliated Hospital of Nanjing Medical University, Nanjing, China, 2GE Healthcare, MR Research, Beijing, P.R. China, Beijing, China
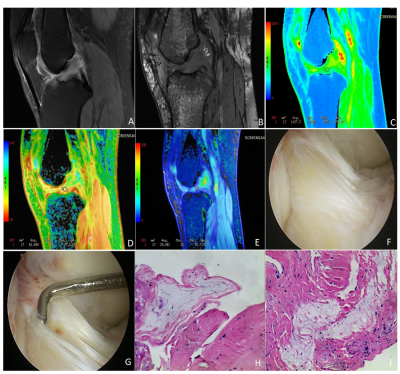
Based on the characteristic pathological
change of nerve root edema in extraspinal sub-regions, conventional MR combined
with quantitative MR DTI/DTT has a good performance for visualizing and
quantitative diagnosis in lateral lumbar spinal canal stenosis.
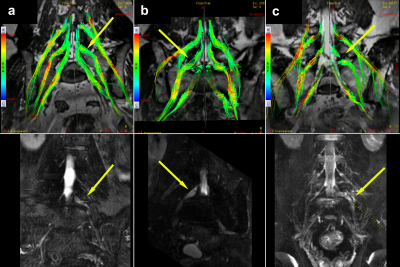
The DTT abnormalities of symptomatic nerves can
be classified into color hue reduction (a), sparse (b) and interruption
(c). The visual abnormalities of tractography were
found mainly in the extraforaminal (34 cases, 34.3%) and extraspinal (57 cases,
57.6%) region of compressed nerves.
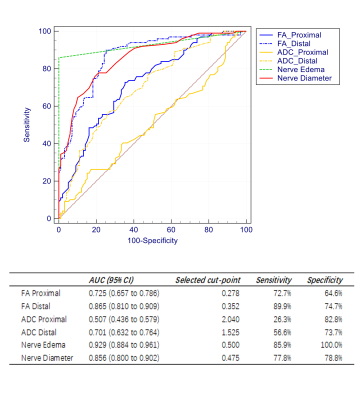
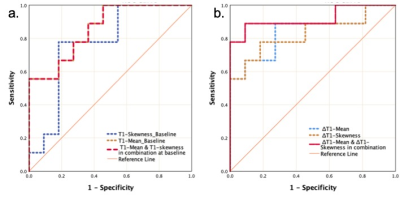
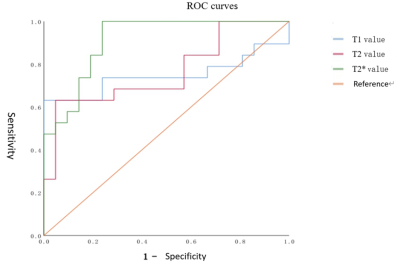
The ROC curve for nerve edema had the highest
AUC of 0.929 (95% CI 0.884 - 0.961); the cut point showed sensitivity and
specificity of 85.9% and 100%, respectively. In addition to this, the ROC curve
for distal FA and nerve diameter both had AUCs >0.80.
-
Assessment of Osteoporosis in Human Lumbar Using 3D Adiabatic Inversion Recovery Prepared Ultrashort TE Cones Sequence
Jin Liu1, Yajun Ma2, Jianwei Liao1, Xiaojun Chen1, Wei Li1, Lin Yao1, Long Qian3, Jiang Du2, and Shaolin Li1
1Department of Radiology, The Fifth Affiliated Hospital of Sun Yat-Sen University, Zhuhai, China, 2Department of Radiology, University of California, San Diego, CA, United States, 3MR Research, GE Healthcare, Guangzhou, China
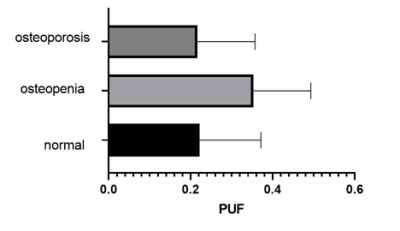
It
was concluded that IR-UTE was positively correlated to QCT and DXA, and was
negative correlated to FRAX scores. The 3D IR-UTE measures demonstrated good
performance in the differentiation of normal, osteopenia and osteoporosis.
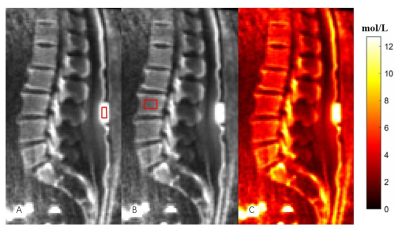
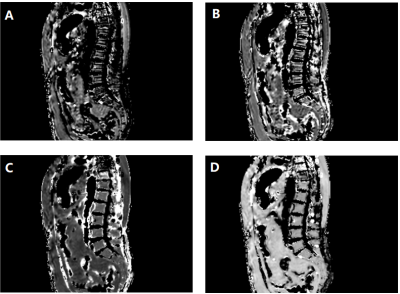
Figure 1: In vivo
qualitative and quantitative imaging of the lumbar of a 56-year-old female
volunteer using the 3D IR-UTE sequence. Figure
A: ROI
in the phantom;
Figure B: ROI in the lumbar vertebrae; Figure C: The proton density
map of the spine trabecular bone.
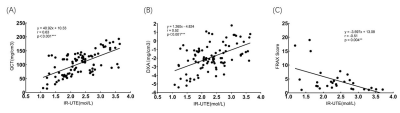
Figure 2: Linear regression in 30 subjects between (A)
IR-UTE measured PD and QCT, (B) IR-UTE measured PD and DXA, and (C) IR-UTE measured
PD and FRAX score.
-
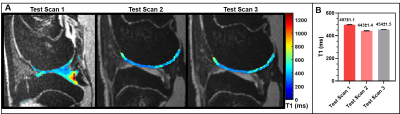
B1 Field Inhomogeneity Correction for qDESS T2 Mapping: Application to Rapid Bilateral Knee Imaging
Marco Barbieri1, Lauren Watkins1,2, Arjun D. Desai1,3, Valentina Mazzoli1, Elka Rubin1, Andrew Schmidt1, Garry E. Gold1,2, Brian A. Hargreaves1,2,3, Akshay S. Chaudhari1,4, and Feliks Kogan1
1Department of Radiology, Stanford University, Stanford, CA, United States, 2Department of Bioengineering, Stanford University, Stanford, CA, United States, 3Department of Electrical Engineering, Stanford University, Stanford, CA, United States, 4Department of Biomedical Data Science, Stanford University, Stanford, CA, United States
B1-correction
for qDESS T2 mapping corrected
for between-sample pair differences in the T2-phantom.
In-vivo results showed that B1-correction can mitigate variations
driven by the sensitivity of the T2
mapping method to B1 instead of reflecting biological
changes.
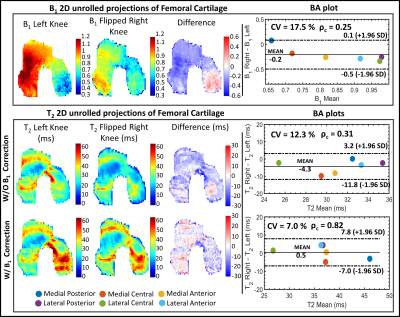
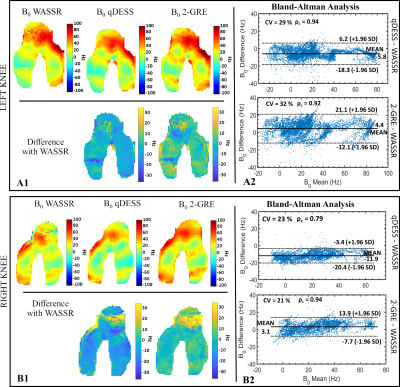
Fig.3:Example of comparison
between the left and right T2
maps of FC where B1 differs substantially
between the left and right knee. Each row displays the quantitative parameter
(B1 and T2 in the top and bottom panels, respectively) 2D unrolled
projections of FC for the left and the mirrored right knee along with their pixel-wise
difference and the BA plots between left and right parameter values in the six FC sub-regions. Overall, there is a relatively high difference
between B1 in the left and right knee. Applying the B1 correction improves the
expected symmetry in T2.
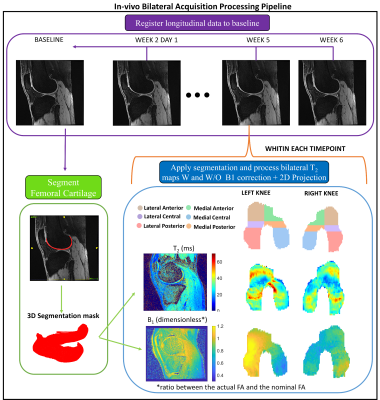
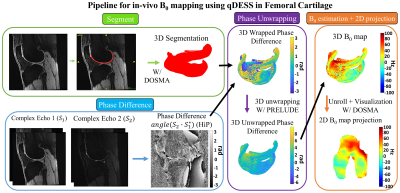
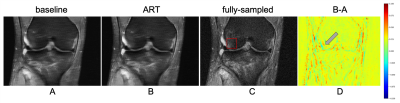
Fig.1:Schematization of
the pipeline used to process the longitudinal in-vivo bilateral acquisitions.
Each time-point was registered to the baseline.
The FC was manually segmented at the baseline time-point. For each time-point,
the open-source DOSMA framework9 was used to compute T2 map
with and without B1 correction and to visualize the 3D
segmented volume projected onto a 2D space2. The FC was
automatically sub-divided into 3 different layers (total, deep and superficial) and 6 sub-regions
(anterior/central/posterior for the medial/lateral sides).
-
Denoising Meniscus T2* Mapping In College Basketball Players
Ek T Tan1, Erin C Argentieri1, Madeleine A Gao1, John Neri1, Garry E Gold2, Sharmila Majumdar3, Hollis G Potter1, and Matthew F Koff1
1Radiology and Imaging, Hospital for Special Surgery, New York, NY, United States, 2Stanford University, Stanford, CA, United States, 3University of California San Francisco, San Francisco, CA, United States
T2* mapping with UTE may provide increased sensitivity to subclinical changes in the collagen matrix of menisci. Denoising of high-resolution, low-SNR images can reduce variance of T2* maps, leading to improved qMRI.
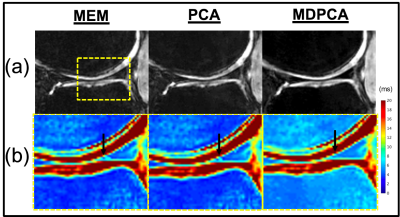
Fig.1. (a) UTE (TE=30ms) images, showing reduced noise with PCA and MDPCA, and (b) improved fitting error with MDPCA in the T2* maps of cropped region corresponding to dashed box region (arrow – posterior horn of medial meniscus).
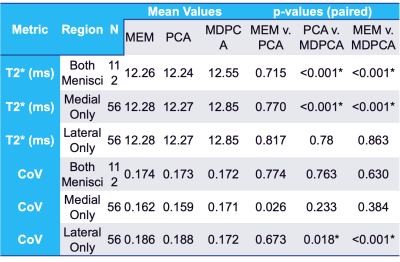
Table 1. Paired
Comparisons of Mean T2* and Coefficient of Variation (CoV) for MEM, PCA-denoising
and MD+PCA-denoising Algorithms. Note: * = p < 0.05.
-
Changes in meniscus T2 relaxation times due to acute exercise in individuals with knee osteoarthritis
Ananya Goyal1, Garry Gold1, Feliks Kogan1, and Lauren Watkins1
1Stanford University, Stanford, CA, United States
Acute
exercise did not affect the meniscal T2 relaxation times in subjects with OA.
However, there were significant changes
when assessing the maximal regional T2 change in the medial or lateral menisci
of exercised subjects, which may be impacted by knee loading.
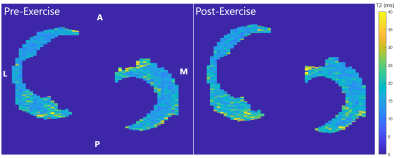
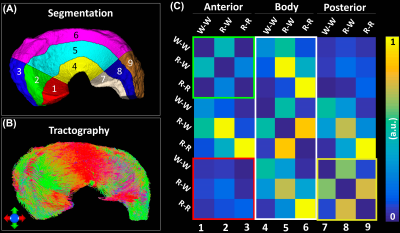
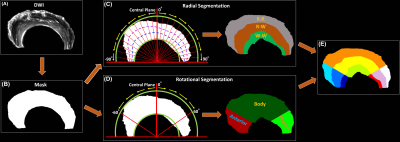
T2 relaxation times of the menisci, both medial
and lateral, of healthy volunteers were projected to a 2D plane to create T2
relaxation time maps. The map for Post-exercise was registered to Pre-exercise
using Elastix. The mean T2 relaxation time in the medial and
lateral menisci, as well as across both the menisci, was calculated.
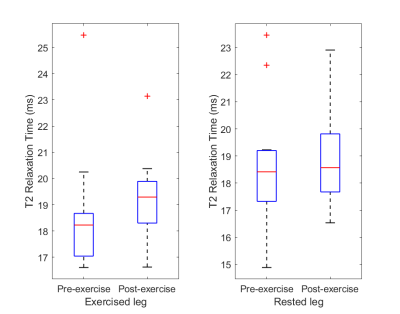
T2
relaxation times were averaged across both the lateral and medial menisci.
There was no significant difference in the average T2 relaxation times between pre-exercise
and post-exercise scans for the Exercised and Rested groups. The Exercised leg
group had slightly lower T2 times than the Rested group for both scans, but
these differences were not statistically significant (p=0.96 for Pre-exercise
and p=0.29 for Post-exercise).
-
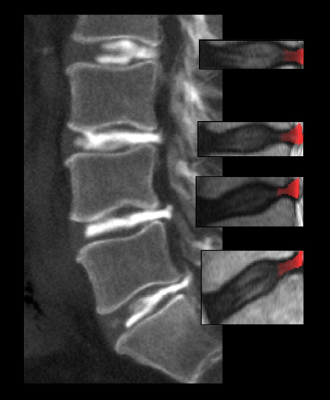
Kinematic MRI Tracking of Wrist Carpal Bones
Mohammad Zarenia1, Volkan Emre Arpinar1, Andrew S. Nencka1, L. Tugan Muftuler2, and Kevin M. Koch1
1Department of Radiology, Medical College of Wisconsin, Milwaukee, WI, United States, 2Department of Neurosurgery, Medical College of Wisconsin, Milwaukee, WI, United States
Through the use of an advanced 4D MRI acquisition technique and a novel boundary-based slab-to-volume registration approach, the feasibility of kinematic metric tracking of unconstrained wrist motion is demonstrated.
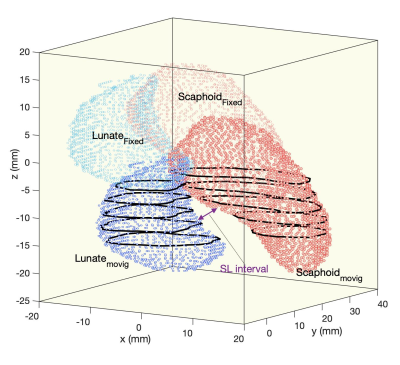
Visualization of the fixed and the resulting registered volumes of Scaphoid and Lunate. The black lines depict the boundaries of the moving frames.
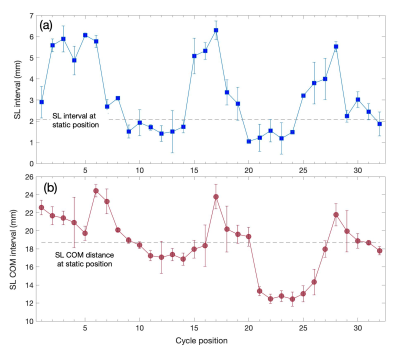
Kinematic profile of radial-ulnar deviation of scaphoid-lunate (SL) interval; (a) SL interval constructed by navigating two stablished points at the boundaries of the fixed images. (b) SL Center of Mass (COM) distance.
-
Whole-body MRI reveals the burden of unsuspected synovitis in juvenile idiopathic arthritis
Varvara Choida1,2, Timothy J.P. Bray1,3, Alan Bainbridge4, Debajit Sen2,5, Corinne Fisher2,5, Maria Leandro2,5, Coziana Ciurtin2,5, and Margaret Hall-Craggs1,3
1Centre for Medical Imaging, University College London, London, United Kingdom, 2Centre for Adolescent Rheumatology Versus Arthritis at UCL UCLH and GOSH, University College London, London, United Kingdom, 3Radiology, University College London Hospital, London, United Kingdom, 4Medical Physics, University College London Hospitals, London, United Kingdom, 5Adolescent and young adult Rheumatology, University College London Hospital, London, United Kingdom
We developed a whole-body MRI protocol, consisting of post-contrast mDixon images, which revealed a large burden of clinically undetected synovitis in 32 adolescent patients with clinically active and inactive juvenile idiopathic arthritis.
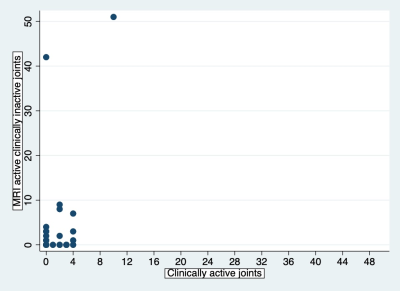
Figure 4. Synovitis detected by MRI in clinically inactive joints versus clinical synovitis. Values represent number of joints per patient. In many patients, there are additional joints with synovitis on MRI that were clinically unsuspected.
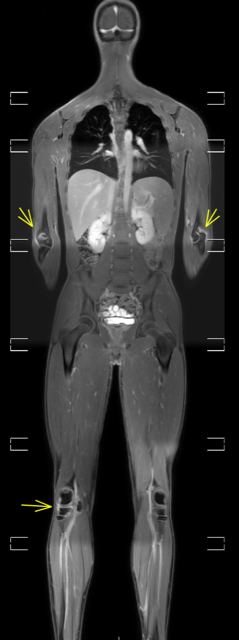
Figure 1. Bilateral elbow and right knee synovitis on post-contrast, water-only Dixon MR image (whole-body view).
-
Gadolinium-Free Assessment of Synovitis Using Diffusion Tensor Imaging
Halston J.C. Sandford1, James W. MacKay2, Lauren E. Watkins1,3, Garry E. Gold1,3,4, Feliks Kogan1, and Valentina Mazzoli1
1Radiology, Stanford University, Stanford, CA, United States, 2University of East Anglia, Norwich, United Kingdom, 3Bioengineering, Stanford University, Stanford, CA, United States, 4Orthopaedic Surgery, Stanford University, Stanford, CA, United States
DTI is a promising tool for assessing intensity of synovitis in osteoarthritic knees without the use of gadolinium-based contrast agent, indicated by strong associations of the DTI parameters (MD and FA) with the DCE-MRI parameter Ktrans.
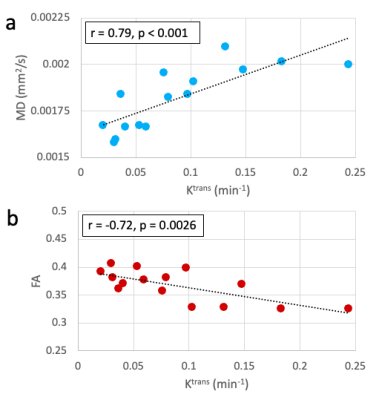
Figure 3: Within the whole synovium, (a) MD had a significant positive correlation with Ktrans and (b) FA had a significant negative correlation. For each standard deviation increase in Ktrans, MD increased by 1.3x10⁻⁴ mm2/s (approximately 7% of the median MD value) and FA decreased by 0.020 (approximately 6% of the median FA value).
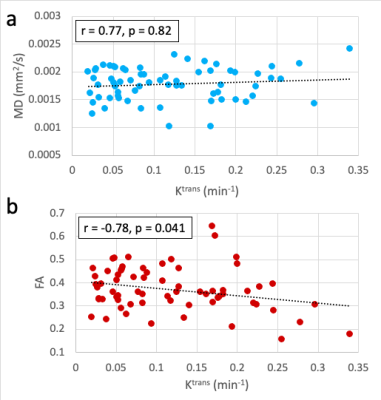
Figure 4: Correlations between the diffusion parameters (MD and FA) and Ktrans within the 67 osteophyte-adjacent ROIs (defined as the intersection of the synovium segmentation and manually drawn regions around each osteophyte). (a) MD did not have a significant correlation with Ktrans (r = 077, p = 0.82) but (b) FA had a strong and significant negative correlation (r = -0.78, p = 0.0041).
-
Optimizing the use of diffusion tensor imaging for clinical tractography of the anterior cruciate ligament in the knee
Allen A Champagne1,2, Don Brien2, Andrew McGuire3, Paul Fenton4, Yousef A Marwan5, Paul A Martineau5, and Davide D Bardana3
1School of Medicine, Queen's University, Kingston, ON, Canada, 2Center for Neuroscience Studies, Queen's University, Kingston, ON, Canada, 3Orthopedic Surgery, Queen's University, Kingston, ON, Canada, 4Diagnostic Radiology, Queen's University, Kingston, ON, Canada, 5Orthopedic Surgery, McGill University, Montreal, QC, Canada
Diffusion tensor imaging of the anterior cruciate ligament (ACL) should favor multiband acquisitions, as they provide higher spatial resolution, lower echo time, shorter scan time and improved ACL tractography, compared to traditional methods.
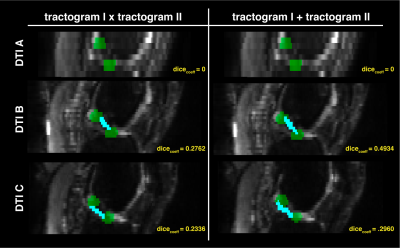
Figure 5. Results from the fiber-based probabilistic tractography and Dice Coefficient analysis
Sagittal slices of the diffusion weighted images (grayscale) are displayed and overlaid with the resampled regions of interest (green, see Figure 2), as well as the reconstructed anterior cruciate ligament (cyan blue), estimated based on fiber-based probabilistic tractography. Both segmentation reconstructions are shown including voxels traversed by the two (left), or either (right), tractograms.
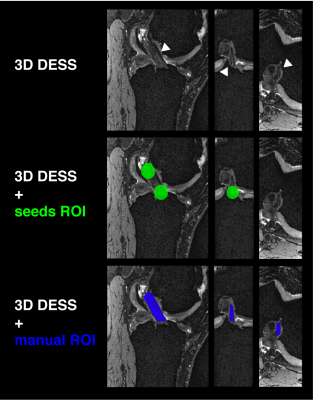
Figure 3. Three-dimensional high resolution structural imaging of the left knee
Three views (sagittal, coronal and axial) of the Double Echo Steady State (DESS) scan are shown highlighting the healthy anterior cruciate ligament (ACL) for this patient (top). The middle and bottom views show the placement of the region of interest seeds within the tibia and femur insertions of the ACL (green), as well as the manual segmentation of the ligament (blue) used for assessment of the tractography outputs.
-
Assessment of Synovitis in Osteoarthritis Using Non-Contrast Quantitative DESS
Jacob Thoenen1, James W. MacKay2,3, Kathryn J. Stevens1, Tom D. Turmezei4, Akshay Chaudhari1, Lauren E. Watkins1, Emily J. McWalter5, Brian A. Hargreaves1, Garry E. Gold1, and Feliks Kogan1
1Department of Radiology, Stanford University, Stanford, CA, United States, 2Department of Radiology, University of Cambridge, Cambridge, United Kingdom, 3Norwich Medical School, University of East Anglia, Norwich, United Kingdom, 4Department of Radiology, Norfolk and Norwich University Hospital, Norwich, United Kingdom, 5Department of Mechanical Engineering, University of Saskatchewan, Saskatoon, SK, Canada
The quantitative double echo in steady state (qDESS) sequence shows good agreement to contrast-enhanced MRI for characterization of the severity of synovitis.
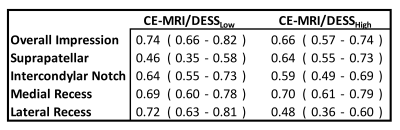
Table 2: Agreement between qDESS and CE-MRI using Gwet's AC2 (95% LOA) for readers overall impression of synovitis and regional gradings
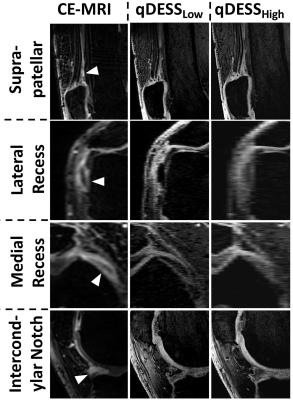
Figure 1: Example cases where radiologists tended to agree on severity of synovitis on CE-MRI, qDESSLow, and qDESSHigh. In the sagittal MR images of the suprapatellar pouch, mild uniform synovial thickening is demonstrated without obvious nodularity (grade 1). In the axial MR images of the medial and lateral recess, synovial thickening is more conspicuous with the suggestion of nodularity in the lateral recess images (grade 2). In the sagittal intercondylar notch images, there is nodular synovial enhancement anterior to the anterior horn of the lateral meniscus (grade 2)