-
Relaxation Time Mapping of Knee Articular Cartilage Using Magnetic Resonance Fingerprinting
Sanam Assili1, Victor Casula1,2, Jaakko Ikäheimo1, Egor Panfilov1, Ari Väärälä1, Martijn A. Cloos3, Riccardo Lattanzi4, and Miika T. Nieminen1,2,5
1Research Unit of Medical Imaging, Physics and Technology, University of Oulu, Oulu, Finland, 2Medical Research Center, University of Oulu and Oulu University Hospital, Oulu, Finland, 3Centre for Advanced Imaging, University of Queensland, Brisbane, Queensland, Australia, 4Center for Advanced Imaging Innovation and Research, New York University Grossman School of Medicine, New York, NY, United States, 5Department of Diagnostic Radiology, Oulu University Hospital, Oulu, Finland
In cartilage-mimicking phantoms, MRF-derived T1 and T2 relaxation time
measurements show excellent agreement with conventional relaxation time mapping
techniques. Furthermore, MRF demonstrates topographical variation of T1 and T2
relaxation times typical to human knee cartilage in vivo
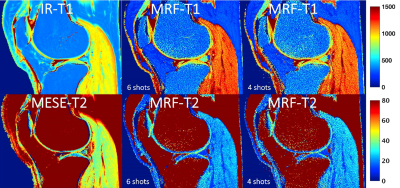
Figure 5. T1 and T2 relaxation time maps from right knee joint
of 34-year-old female obtained with conventional inversion recovery (IR) and
multi-echo spin-echo (MESE) sequences (total time acquisition 26:48 min) and MRF
with 6shot (9:01 min) and 4shots (6:01 min).
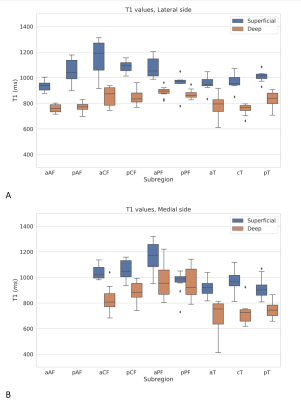
Figure 3. MRF-T1 relaxation times (6shots) of superficial and deep cartilage layers from
lateral (A) and medial (B) tibiofemoral subregions (n=10 knees).
-
Deriving a Cartilage Signature to Predict Joint Replacement in Osteoarthritis
Edward Peake1,2,3, Stefan Pszczolkowski1,2,3, Christoph Arthofer2,3,4, and Dorothee P Auer1,2,3
1NIHR Nottingham Biomedical Research Centre, University of Nottingham, Nottingham, United Kingdom, 2Radiological Sciences, Division of Clinical Neuroscience, University of Nottingham, Nottingham, United Kingdom, 3Sir Peter Mansfield Imaging Centre, University of Nottingham, Nottingham, United Kingdom, 4Nuffield Department of Clinical Neuroscience, University of Oxford, Oxford, United Kingdom
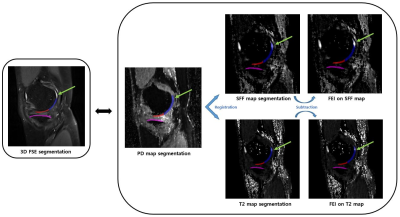
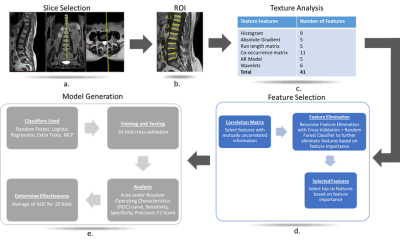
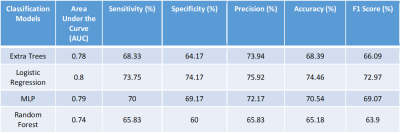
MRI improves prediction of knee replacement surgery. A radiomic signature derived from MRI features had a cox hazard ratio of 7.5 (p = 2e-28, 95% CI 7.1 – 7.9) which was higher than established clinico-demographic multivariate prediction model with cox hazard ratio 5.9 (p = 2e-28, 95%CI 5.6 – 6.2).
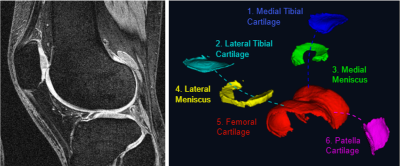
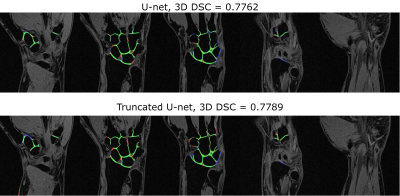
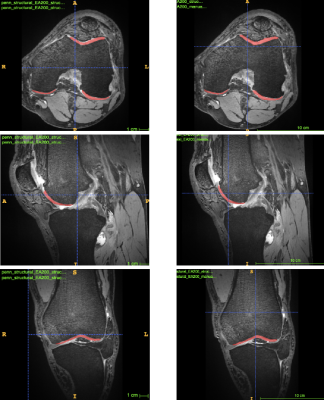
Left | DESS knee MRI with a 140mm field of view; 0.7mm slice thickness and matrix of 384×384 with 160 slices and an acquisition time of 10.6 mins. Right | Cartilage components segmented using our fully automated segmentation method based on U-convolutional neural networks.
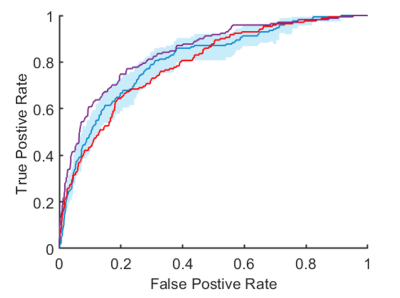
ROC curves for prediction of total knee replacement within 5-years. Blue | Radiomic signature with a C-index of 0.81 (95% CI, 0.76 – 0.84). Purple | Cox risk model including clinico-demographic covariates and the radiomic signature with a C-index of 0.85 (95% CI, 0.82 – 0.87). Red | cox risk model with clinico-demographic features alone had a C-index of 0.79 (95% CI, 0.75 – 0.83).
-
T1ρ relaxation times for voxel-wise characterization of longitudinal changes in hip cartilage biochemistry
Koren Roach1, Richard Souza1, Sharmila Majumdar1, and Valentina Pedoia1
1UCSF, San Francisco, CA, United States
Deeper layers of acetabular cartilage saw the greatest variation in two-year T1ρ relaxation time changes across healthy subjects and those with early-to-moderate osteoarthritis.
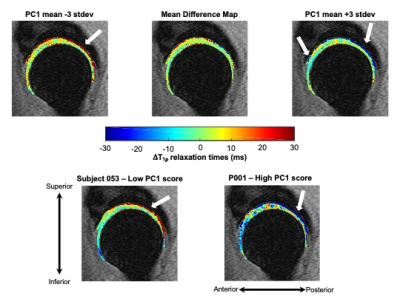
Figure 1: Visualization of principal component (PC) 1 mode of variation along with representative subjects with low and high PC1 scores. PC 1 was primarily characterized by greater two-year changes in T1ρ relaxation times in the deep layers of acetabular cartilage. Top: Mean differences in hip cartilage T1ρ relaxation times over two years across subjects plus or minus 3 standard deviations (stdev) of PC 1 variation. Bottom: Representative subjects with low and high PC 1 scores demonstrate notable changes in the deep layer of acetabular cartilage T1ρ relaxation times over two years.
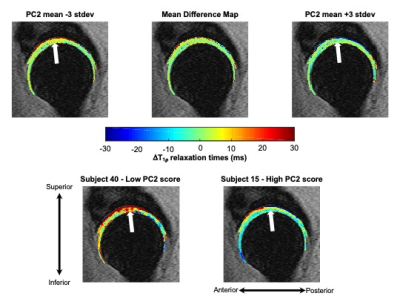
Figure 2: Visualization of principal component (PC) 2 mode of variation along with representative subjects with low and high PC 2 scores. PC 2 was primarily characterized by changes to more superficial layers of the acetabular cartilage in the superior region. Mean differences in hip cartilage T1ρ relaxation times over two years across subjects plus or minus 3 standard deviations (stdev) of PC 2 variation. Representative subjects with low and high PC2 scores demonstrate two-year changes in the superior acetabular cartilage T1ρ relaxation times.
-
The value of T2 mapping to characterize early knee joint cartilage damage in hemophilia arthropathy
Shufang Wei1, Jiajia Li1, Xianchang Zhang2, Jing An3, and Yinghui Ge1
1Fuwai Central China Cardiovascular Hospital, Zhengzhou, China, 2MR Collaboration, Siemens Healthcare Ltd, Beijing, China, 3Siemens Shenzhen Magnetic Resonance Ltd, Shenzhen, China
T2 mapping detected early cartilage changes in patients with hemophilia and could be used as a sensitive biomarker to detect these early changes and develop preventative treatment plans.
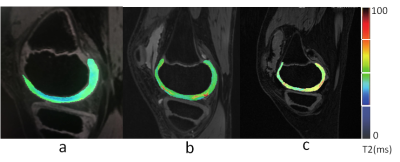
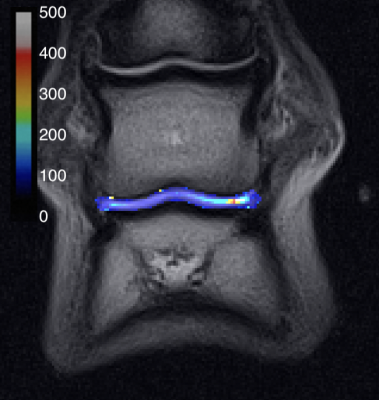
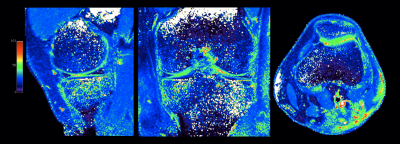
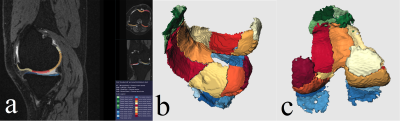
T2 mapping (T2M) of the knee. (a) Control group, male, 10 yo; T2M pseudo-color imaging (PCI) shows a uniform cartilage color distribution and complete articular surface. (b) Group A, male, 9 yo; T2M PCI shows uneven cartilage color distribution, few red-yellow stage changes, and an increased cartilage T2 value. (c) Group B, male, 11 yo; T2M PCI shows greater uneven cartilage color distribution, a significantly diminished weight-bearing area, and a significantly increased cartilage T2 value.
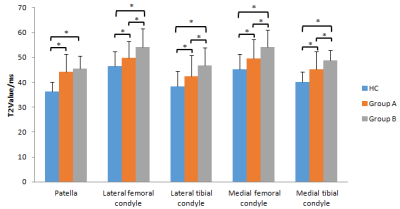
A bar graph showing T2 values for the different regions of interest (ROIs) in the knee. Groups HC (control), A (International Cartilage Repair Society [ICRS] level 0), and B (ICRS levels I and II) were compared for each ROI. * represents a significant difference.
-
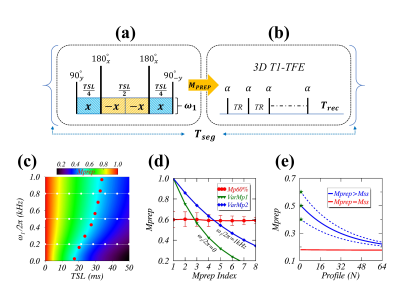
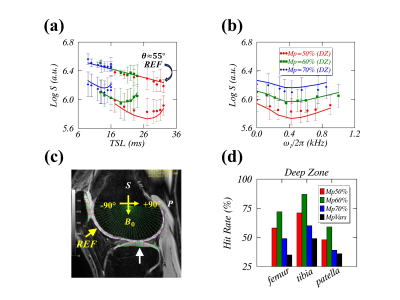
Optimization of Relaxation along Fictitious Field (RAFF) Contrast to Detect Osteoarthritis
Seyed Amir Mirmojarabian1, Victor Casula1, Olli-Pekka Aro1, Henning Henschel2, Miika T Nieminen1,3,4, and Timo Liimatainen1,3
1Research Unit of Medical Imaging, Physics and Technology, University of Oulu, Oulu, Finland, 2Department of Medicinal Chemistry, Uppsala University, uppsala, Sweden, 3Medical Research Center, Oulu University Hospital, Oulu, Finland, 4Department of Diagnostic Radiology,, Oulu University Hospital, Oulu, Finland
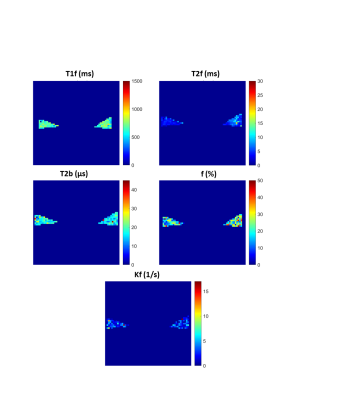
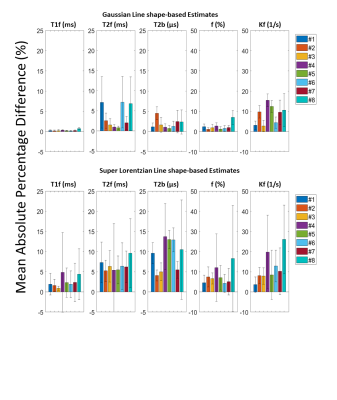
Relaxation along fictitious field with pulse duration close to 2.8 ms efficiently
capture lack of -OH group in degraded compared to intact cartilage.
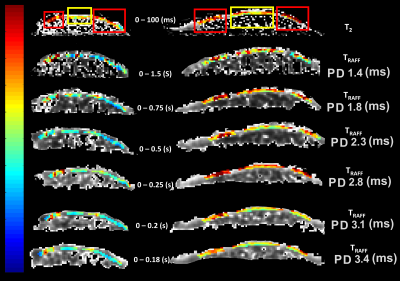
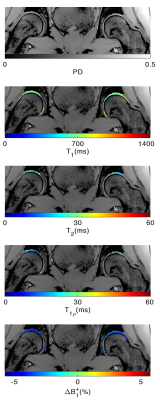
Figure 2: T2 map and TRAFF
relaxation time maps with implemented pulse durations (PD) from two cartilage
specimen; red rectangle shows areas of degraded cartilage and yellow rectangle
points out to intact cartilage in T2 map.
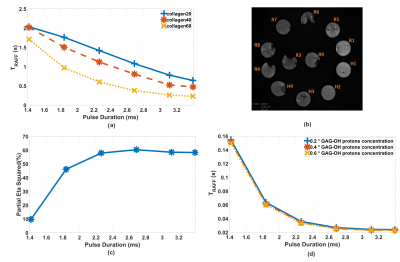
Figure 1: a) TRAFF
of collagen phantom measurements. b) T2 image of collagen phantoms. c) Partial
eta square percentage, representing TRAFF relaxation time
contrast/variation accounted by collagen concentration. d) Bloch-McConnell
simulated TRAFF.
-
The value of magnetic resonance T2*mapping for early detection of knee cartilage damage in hemophilia arthropathy
Jiajia Li1, Shufang Wei1, Xianchang Zhang2, Jing An3, and Yinghui Ge1
1Fuwai Central China Cardiovascular Hospital, Zhengzhou, China, 2MR Collaboration, Siemens Healthcare Ltd., Beijing, China, Beijing, China, 3Siemens Shenzhen Magnetic Resonance Ltd, Shenzhen, China
T2*
mapping can detect early iron deposition caused by repeated bleeding in
patients with hemophilia and could be used as a sensitive biomarker to detect
early cartilage changes and develop preventative treatment plans.
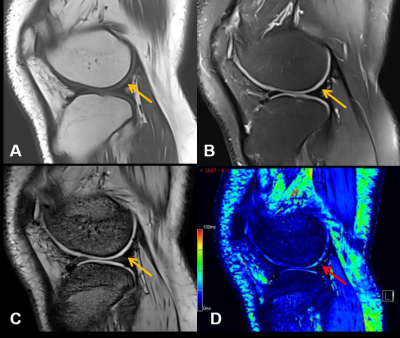
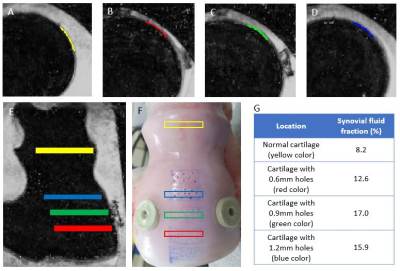
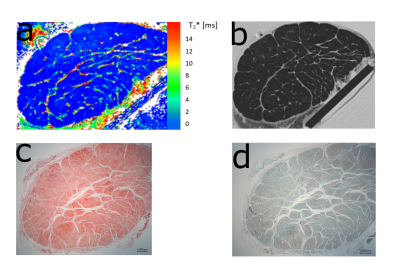
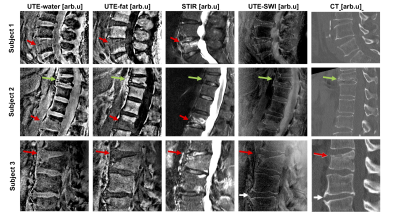
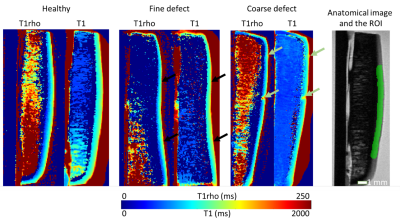
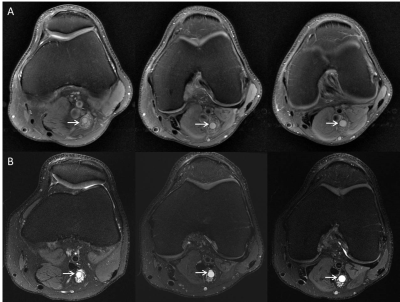
Images from one representative participant (male, 17 years old) with
hemophilic arthropathy. Conventional (A) T1WI. (B) PDWI. (C) T2*-anatomical
image show relatively complete articular surface (yellow arrow) without damage.
(D) T2* mapping shows uneven distribution in the cartilage and the decreases
(red arrow) of cartilage T2* value indicate damage.
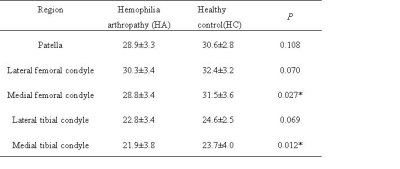
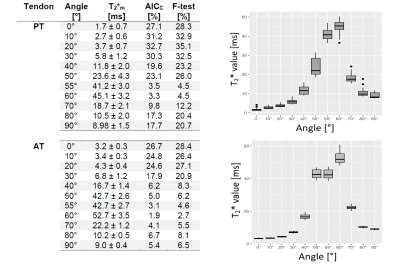
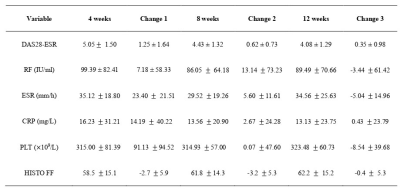
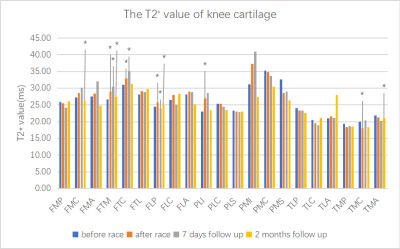
T2* values of articular cartilage in
different regions (mean ± SD)
Note:
* P<0.05 indicates statistical significance
-
Decreased collagen content in tendons of patients with osteoporosis and osteopenia detected with ultrashort echo time cones MRI
Saeed Jerban1, Yajun Ma1, Amir Masoud Afsahi1, Douglas G Chang2, Zhao Wei1, Meghan Shen1, Mei Wu1, Alecio Lombardi1,3, Nicole Le4, Jiang Du1, and Eric Y Chang1,3
1Radiology, University of California, San Digeo, La Jolla, CA, United States, 2Orthopaedic Surgery, University of California, San Digeo, La Jolla, CA, United States, 3Radiology Service, VA San Diego Healthcare System, San Diego, CA, United States, 4Radiology, VA San Diego Healthcare System, La Jolla, CA, United States
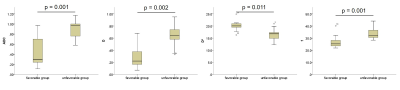
MMF as a
measure of collagen content in lower leg tendons was significantly lower in OPo
and OPe patients compared with healthy control subjects. Significantly lower
MMF in OPo versus OPe patients implied OPo-related changes in collagen turnover
in addition to age-related changes.
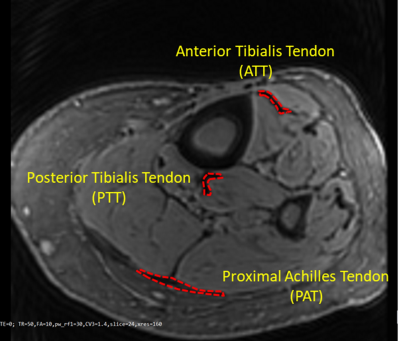
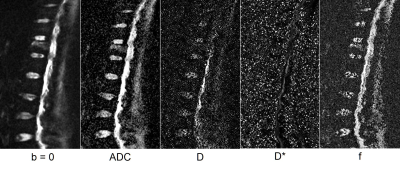
Figure 1: A
representative Cones UTE-MRI image from a 76-year-old female subject (TR=50 ms, for the selection the region of interests TE=2
ms was used because its provided higher contrast). Anterior
and posterior tibialis (ATT and PTT) and proximal Achilles (PAT) tendons
were obvious in the MRI images, as indicated in red.
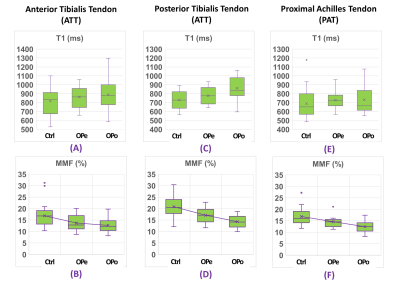
Figure
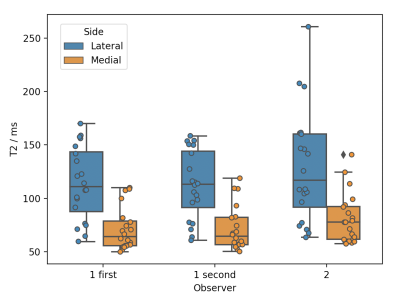
3: Boxplots of (A, C, E) T1 and (B, D, F) MMF of (A,B) ATT, (C,D) PTT, and
(E,F) PAT tendons in Ctrl subjects versus OPe and OPo patients. Averages,
median, SD, first, and third quartiles are indicated in the boxplots.
-
Highly Efficient Single-Point Dixon-Based Fat Suppression for Ultrashort Echo Time Double Echo Steady State (UTE-DESS) Imaging of the Knee Joint
Hyungseok Jang1, Yajun Ma1, Michael Carl2, Saeed Jerban1, Eric Y Chang1,3, and Jiang Du1
1University of California, San Diego, San Diego, CA, United States, 2GE Healthcare, San Diego, CA, United States, 3Veterans Affairs San Diego Healthcare System, San Diego, CA, United States
The proposed single-point
Dixon (spDixon)-based fat suppression achieved high contrast Ultrashort Echo
Time Double Echo Steady State (UTE-DESS) imaging of short T2 tissues. We demonstrated
that fat suppression with spDixon technique improved lesion detection in human knee
joints.
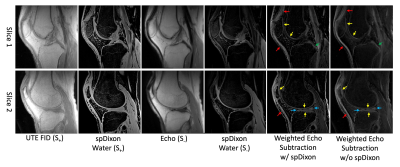
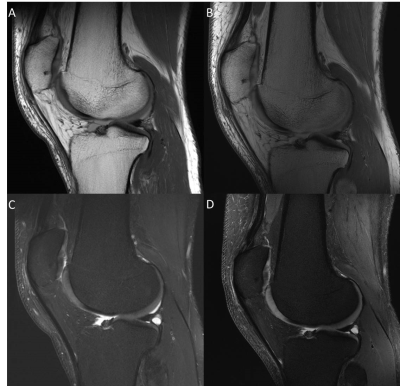
Figure 4.
UTE-DESS imaging with spDixon of knee joint of a healthy volunteer
(37-year-old male). Both weighted echo subtractions with and without spDixon-based fat
suppression achieve high contrast specific to short T2 tissues
including the osteochondral junction (yellow arrows), tendons (red arrows),
menisci (blue arrows), and ligaments (green arrows).
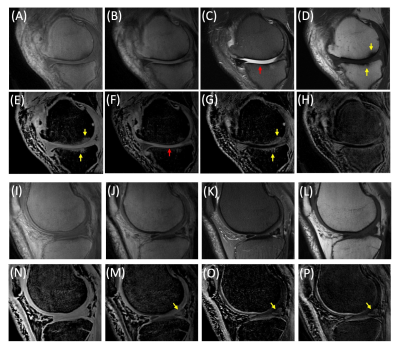
Figure 5.
UTE-DESS imaging with spDixon in two representative OA patients (A-H: 52-year-old
male, I-P: 56-year-old male). (A, I) Magnitude images of S+, (B, J)
magnitude images of S-, (C, K) T2-FSE images, (D, L) T1-FSE
images, (E, N) spDixon water images from S+, (F, M) spDixon water images from S-,
(G, O) weighted echo subtraction of water images from spDixon, and (H, P)
weighted echo subtraction of S+ and S- without spDixon.
-
Examining short-term longitudinal and activity-based variability of femoral cartilage T2 relaxation times in healthy subjects
Lauren Watkins1,2, Andrew Schmidt1, Elka Rubin1, Marco Barbieri1, Arjun Desai1,3, Valentina Mazzoli1, Marianne Black1, Garry Gold1,2, Brian Hargreaves1,2,3, Akshay Chaudhari1,4, and Feliks Kogan1
1Radiology, Stanford University, Stanford, CA, United States, 2Bioengineering, Stanford University, Stanford, CA, United States, 3Electrical Engineering, Stanford University, Stanford, CA, United States, 4Biomedical Data Science, Stanford University, Stanford, CA, United States
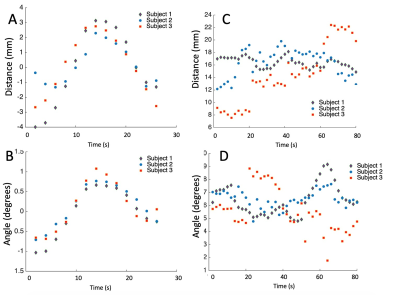
There was considerable short-term stability in T2 relaxation times of active, healthy subjects over 5 days and 5 weeks, with lower variability compared to previously reported 5-month and 1-year measures.
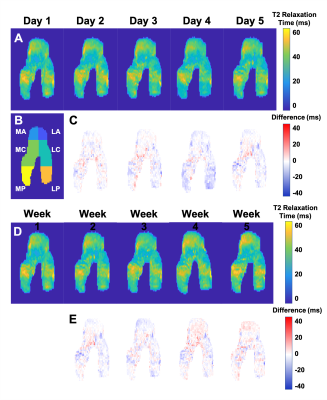
Representative 2D projections of femoral articular cartilage T2 relaxation time maps for the right knee (left not shown) of a subject scanned daily for 5 days [A] and weekly for 5 weeks [D]. Differences in T2 values at each timepoint were calculated with reference to the day 1 scan [C, E]. Variability between timepoints was calculated across the femoral surface, as well as within the anterior (A), central (C), and posterior (P) regions of the medial (M) and lateral (L) portions of the femur [B].
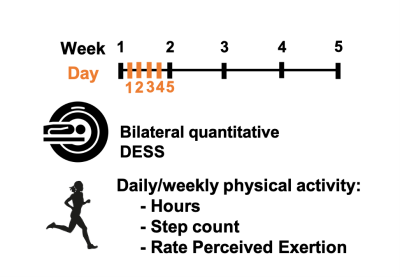
Both knees of 3 healthy female subjects were scanned using a bilateral quantitative double-echo in steady-state (qDESS) sequence on a 3T MRI system. Subjects were scanned daily for 5 consecutive days and weekly for 5 consecutive weeks. At each timepoint, the subjects recorded their hours of physical activity, step count, and Rate Perceived Exertion (RPE) for the 24 hours and week prior to the scan date.
-
Morphologic Structure of Rabbit Suprapatella Cartilage by µMRI and PLM
Hannah Mantebea1, Syeda Batool1, Mouhamad Hammami1, and Yang Xia1
1Physics, Oakland University, Rochester, MI, United States
The suprapatella cartilage has a 10 µm surface layer that covers the much
thicker main tissue of about 390 µm in average thickness. Both layers in the suprapatella
show little variation when the tissue blocks changed their orientations in the
magnetic field.
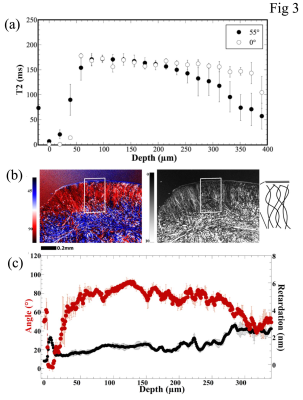
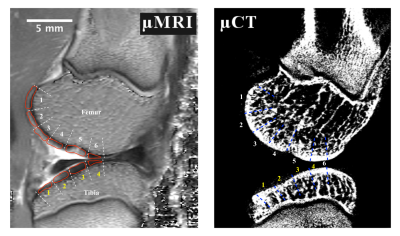
Fig 3 Quantitative µMRI profiles and PLM images/profiles
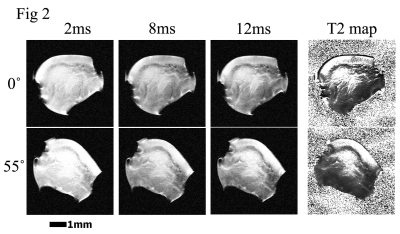
Fig 2 µMRI images
-
Deep Cartilage UTE-T2* Shows Compositional Heterogeneity in Patients with Degenerative Meniscus Tears
Ashley A. Williams1,2, Karyn E. Chappell1,2, and Constance R. Chu1,2
1Orthopaedic Surgery, Stanford University, Stanford, CA, United States, 2Veterans Affairs Palo Alto Health Care System, Palo Alto, CA, United States
Meniscus and cartilage UTE-T2* was compared to arthroscopy
in degenerative meniscus tear patients.
Elevated UTE-T2* was observed in degenerate menisci. However, increasing
intra-operative cartilage grade was not associated
with strictly increasing cartilage UTE-T2*.
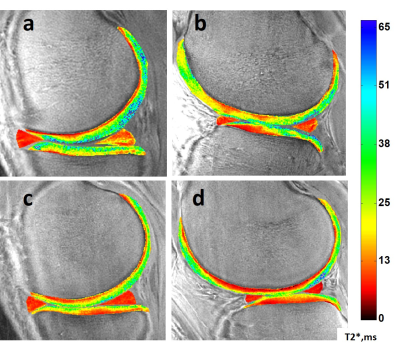
Figure 2. Sample UTE-T2* maps. Top row: a 39-yr male DMT patient with a complex tear
to the posterior horn of his medial meniscus (a) and arthroscopically detected
intact-but-softened medial and lateral femoral condylar cartilage but partial
to full-thickness disruptions of his tibial cartilages (a,b). Bottom row: an uninjured, healthy 24-yr male
with homogeneously low UTE-T2* in both medial and lateral menisci and smoothly
laminar UTE-T2* distributions in his articular cartilage (c,d).
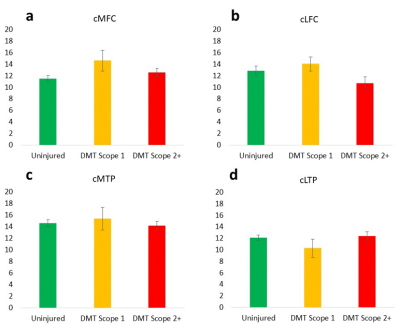
Figure 1. Softened but intact cartilage regions (scope grade 1)
tend to have elevated deep cartilage UTE-T2* values compared to uninjured
controls (yellow bars, a,b,c), while cartilage regions with disrupted
articular surfaces tend to show UTE-T2* values consistent with or lower than
uninjured controls (red bars, a-d).
ANOVA (or Kruskal-Wallis) found no significant differences between
groups suggesting a high degree of variability in deep cartilage UTE-T2* values
of DMT patients with both intact and disrupted articular surfaces. Error bars
represent ±
standard error of the mean.
-
Evaluation of Lesion Tissue Composition in Patients with Juvenile Osteochondritis Dissecans (JOCD) of the Knee Using T2* Mapping at 3T
Stefan Zbyn1,2, Cassiano Santiago1, Casey P. Johnson1,3, Kai D. Ludwig1,2, Lin Zhang4, Shelly Marette2, Marc A. Tompkins5, Bradley J. Nelson5, Takashi Takahashi2, Gregory J. Metzger1, Cathy S. Carlson3, and Jutta M. Ellermann1,2
1Center for Magnetic Resonance Research, University of Minnesota, Minneapolis, MN, United States, 2Department of Radiology, University of Minnesota, Minneapolis, MN, United States, 3Department of Veterinary Clinical Sciences, University of Minnesota, St. Paul, MN, United States, 4Division of Biostatistics, School of Public Health, University of Minnesota, Minneapolis, MN, United States, 5Department of Orthopaedic Surgery, University of Minnesota, Minneapolis, MN, United States
T2*
mapping is a reproducible, clinically applicable method that allows assessment
of all lesion tissues, quantitative measurement of lesion ossification, and
evaluation of bone density, which are potential predictive markers of JOCD
lesion healing.
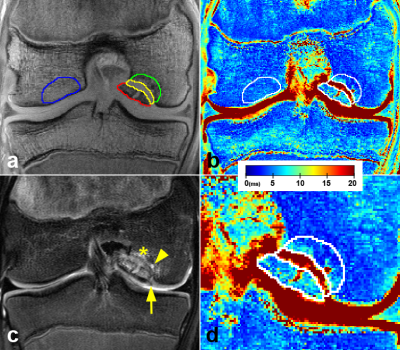
Figure 2. A 16-year-old
boy with the stage III, unstable JOCD lesion. (a) The first echo of the T2*-weighted images with 4 evaluated
regions: progeny (red), interface (yellow), parent bone (green), and control
bone (blue). (b) The corresponding color-coded T2*map. (c) A T2-weighted turbo spin echo image with fat suppression depicting
a break in articular cartilage and subchondral bone plate (arrow), a cyst
(arrowhead), and a hyper-intense edema (asterisks). (d) A zoom of the JOCD lesion area.
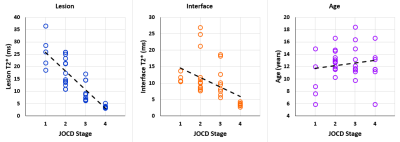
Figure 3. Spearman
rank correlation (ρ) plots. From left a significant negative correlation
between the JOCD stage and the lesion T2* (ρ=-0.871; p<0.001), a significant negative correlation between the JOCD stage
and the interface T2* (ρ=-0.649; p<0.001), and no significant correlation between the JOCD stage and the patient’s
age (ρ=0.081; p=0.65).
-
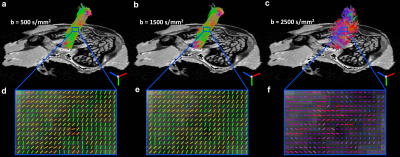
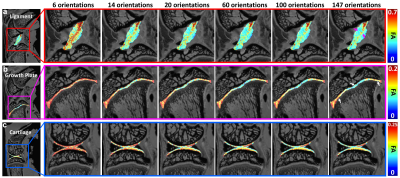
Disruption of collagen fiber architecture after DMM surgery using high-resolution DTI
Nian Wang1, Anthony J. Mirando2, Yi Qi3, Matthew J. Hilton2, and Charles E. Spritzer3
1Radiology and Imaging Sciences, Indiana University, Indianapolis, IN, United States, 2Department of Orthopaedic Surgery, Duke University, Durham, NC, United States, 3Department of Radiology, Duke University, Durham, NC, United States
FA decreased and MD increased after 8 weeks destabilization of the medial meniscus surgery.
Diffusion tractography affords a unique way to visualize the 3D collagen fiber architecture.
Diffusion MRI can be used as imaging biomarker for detecting the degradation of OA.
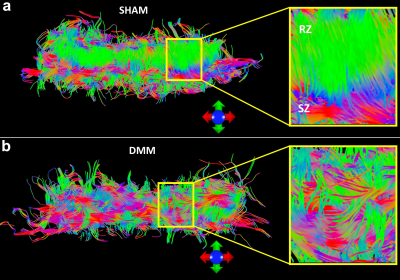
Figure 4. The fiber tracts of articular cartilage for both DMM (b) and SHAM (a) rats.
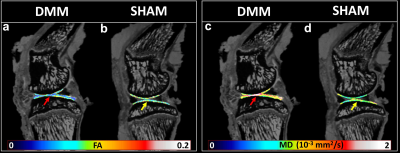
Figure 2. The quantitative fractional anisotropy (FA) and mean diffusivity (MD) maps of articular cartilage for DMM and SHAM rats.
-
Learned knee cartilage and meniscus shape features are associated with osteoarthritis incidence
Claudia Iriondo1, Jinhee Lee1, Sharmila Majumdar1, and Valentina Pedoia1
1University of California, San Francisco, San Francisco, CA, United States
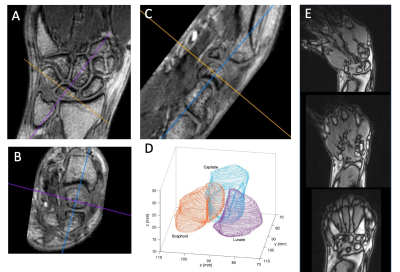
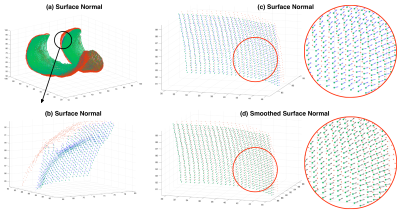
Cartilage and meniscus point clouds from 40,796 knee MR images are used to train point cloud networks to extract shape features. Features are used as variables in a Cox Proportional Hazard model with existing clinical risk factors. Learned shape features predict incident osteoarthritis.
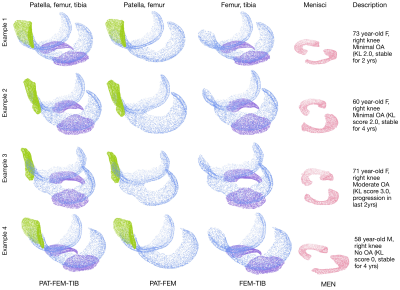
Figure3. Four example subjects, their processed point clouds and subject description. PAT-FEM-TIB, PAT-FEM, FEM-TIB, and MEN compartment combinations were used to train point cloud networks for OA diagnosis. Each compartment is represented by 8192 randomly sampled points. The first three examples are labelled as having osteoarthritis (Kellgren Lawrence grade >=2), while the last example does not. Output p(OA) is used as the shape biomarker feature for Cox PH models. FEM= femur, TIB=tibia, PAT=patella, MEN= menisci
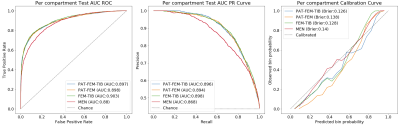
Figure4. Per compartment test results on pretext OA diagnosis task. (L to R) ROC curve, PR curve, and calibration curve with respective performance metrics. Differences between ROC curves are tested using Delong's method, cartilage models were not significantly different from each other, while menisci was significantly different from all cartilage models (p=1e-14, 1e-10, 1e-15).
-
Assessment of knee cartilage volume, thickness and T2 relaxation times in patients with osteoarthritis
Hui Tan1, Bin Wang2, Wulin Kang1, Qiuju Fan1, Nan Yu1, Shaoyu Wang3, Esther Raithel4, Yue Li2, and Tuona Di2
1The affiliated hospital of Shaanxi University of Chinese Medicine, Xianyang, China, 2Shaanxi University of Chinese Medicine, Xianyang, China, 3Siemens Healthineers, Shanghai, China, 4Siemens Healthcare, Erlangen, Germany
In this study, the cartilage volume, thickness and T2 value of mild to moderate knee osteoarthritis were quantitatively measured by using automatic cartilage segmentation software.
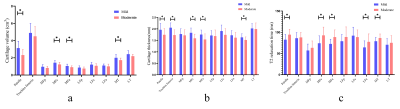
Figure 1. Comparison of the differences of the cartilage volume
(a), thickness (b) and T2 relaxation times (c) between mild and moderate OA
group.
* Statistically significant (P <
0.05).
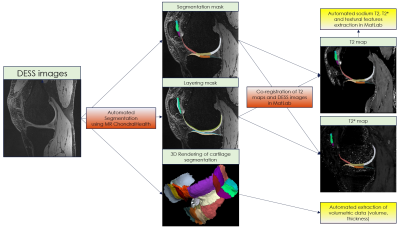
Figure
2. An
example of automated cartilage segmentation: (a) Sagittal view of a knee with
the automated cartilage segmentation. According to the anatomical position, the
cartilage of knee joint was automatically divided into several small regions;
(b and c) automated segmentation view, and the software automatically extracted
the cartilage and display 3D images.
-
Imaging hyaluronan-mediated inflammation in articular cartilage
Jose M Raya1, Alejandra M Duarte1, Dalibel M Bravo1, Elisa M Ramos1, Chongda M Zahng1, Mary M Cowman2, Thorsten M Kirsch1, Mark Wilne3, Len Lyut3, and Amparo M Ruiz1
1New York University Langone Health, New York, NY, United States, 2New York University Tandon School of Engineering, New York, NY, United States, 3University of Western Ontario, Ontario, ON, Canada
This study is the first direct in vivo
indication for the involvement of inflammation in cartilage after injury. Our results provide
insights into the pathogenesis and role of inflammation in OA, showing that
hyaluronan-related inflammation is a common finding.
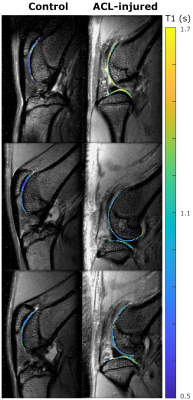
Figure 3. Example of T1 maps on control and ACL-injured limb before IA injection of Cy5.5-P15-1 (top row), and 24 h (middle row) and 48 h (bottom row) after injection. Control showed constant T1 values over time, while ACLT-injured limbs have a trend of decreased T1 values.
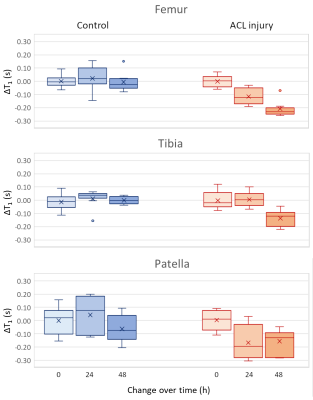
Figure 4. Boxplot showing the change of T1 values after injection of Cy5.5-P1-1 in controls (blue) and ACL-injured limbs (red) for femoral, tibial and patellar cartilage. Both femoral and patellar cartilage showed a significant difference in ΔT1 (p<0.05, one-way ANOVA).
-
Improving Fast 3D-T1rho Mapping of Human Knee Cartilage with Data-Driven Learned Sampling Pattern
Marcelo Victor Wust Zibetti1, Azadeh Sharafi1, and Ravinder Regatte1
1Radiology, NYU Langone Health, New York, NY, United States
-
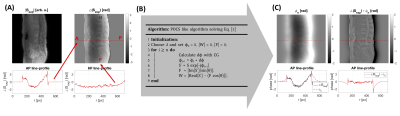
The learned
sampling pattern (SP) improved the median of the normalized absolute deviation
(MNAD) in accelerated T1rho mapping by 7% on average, with a maximum
improvement of 21.5% in the testing data. The largest improvement was achieved for 16-fold acceleration.
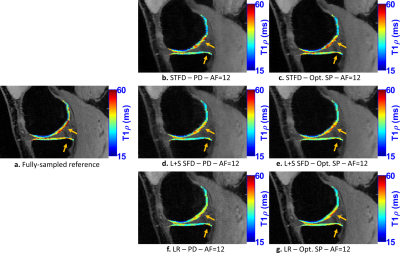
Figure 5:
Representative
T1rho maps of the medial knee joint at acceleration factor (AF) 12. The visual
difference in the medial cartilage is more noticeable at this AF. The optimized
SP is more important at high AFs.
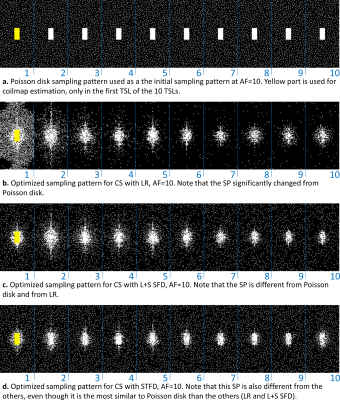
Figure 2: a. Poisson disk sampling pattern (SP), used as an initial SP and b-d.
SP obtained from optimization with bias-accelerated subset selection for
CS with b. LR, c. L+S SFD, and d. STFD.
-
Application value of 3D-MRI based on compressed SENSE technology in meniscal injuries
Peiqi Ma1, Yushan Yuan1, Zongxi Zhang1, Bin Peng1, Jian Xu1, and Xiuzheng Yue2
1Fuyang People's Hospital,Anhui Province,China, Fuyang, China, 2Philips Healthcare, Beijing, China, Beijing, China
In
this study, CS-SENSE in 3D acquisition for knee joint can not only improve the
scanning speed, but also more accurately diagnosis the type of meniscus injury.
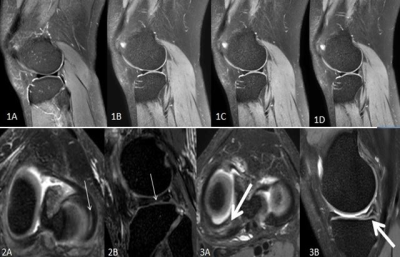
Figures 1A-1D show conventional 2D-MRI sagittal fsPDWI, CS-DSweak, CS-DSmediumand CS-DSstrongspectively.Figures 2A and 2B showlongitudinal cracks of the lateral meniscus(thin arrow). 2A is the reformatted transverse axis of CS-SENSE 3D scanning image (slicethickness of 1mm), and 2B is the reformatted sagittal images. Figures 3A and 3B show the horizontal crack in the posterior angle of the medial meniscus. 3A is the reformatted transverse axis of CS-SENSE 3D scanning image (slicethickness of1mm), and 3B is the reformatted sagittal images.
-
Regional Variations in T2 Relaxations Times in the Hip Cartilage of Female Water Polo Players and Synchronized Swimmers
Elka B Rubin1, Joanna L Langner2, Marianne S Black2, Arjun D Desai2, James W MacKay3, Carly Jones4, Kimberly E Hall2, Marc R Safran2, Feliks Kogan2, and Garry E Gold2
1Radiology, Stanford University, Stanford, CA, United States, 2Stanford University, Stanford, CA, United States, 3Radiology, Cambridge University, Cambridge, United Kingdom, 4Centre for Hip Health and Mobility, University of British Columbia, Vancouver, BC, Canada
This work demonstrates that quantitative MRI can detect regional differences in the hip cartilage of female water polo players and synchronized swimmers; this suggests possible regional differences in cartilage matrix composition between these two groups.
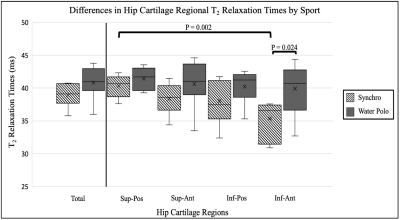
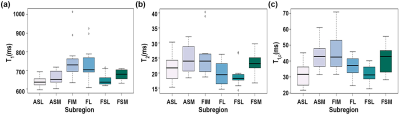
Figure 3: The average T2 Relaxation Times for synchronized swimmers (synchro) and water polo players (water polo) across the total hip cartilage and four subregions: superior-posterior (sup-pos), superior-anterior (sup-ant), inferior-posterior (inf-pos), and inferior-anterior (inf-ant). The average T2 relaxation time means are more stable in water polo players and have more variability in the synchronized swimmers.
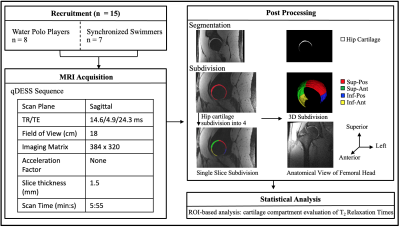
Figure 1: Schematic overview of the study methodology.
-
Deep, intermediate and superficial layers of patella cartilage assessment using T2 mapping in patients with chondromalacia.
Elena Voronkova1,2, Petr Menshchikov3,4, Ilya Melnikov1, Andrei Manzhurtsev1,4, Maxim Ublinskii1,4, Denis Vorobyev1, Dmitriy Kupriyanov3, and Tolib Akhadov1
1Clinical and Research Institute of Emergency Pediatric Surgery and Trauma, Moscow, Russian Federation, 2National Research Nuclear University MEPhI, Moscow, Russian Federation, 3Philips Healthcare, Moscow, Russian Federation, 4Emanuel Institute of Biochemical Physics of RAS, Moscow, Russian Federation
In the intermediate cartilage layer, the transverse
relaxation times are statistically distinguishable for the normal, mild injury,
and severe injury groups – the more severe a damage, the higher T2 values.
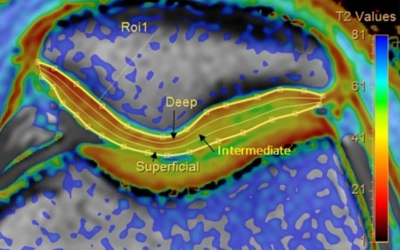
Fig. 1. An example
of patella cartilage T2 map acquired. T2 values were quantified in deep,
intermediate, and superficial layers using Cartilage Assessment utility
(Philips Portal)
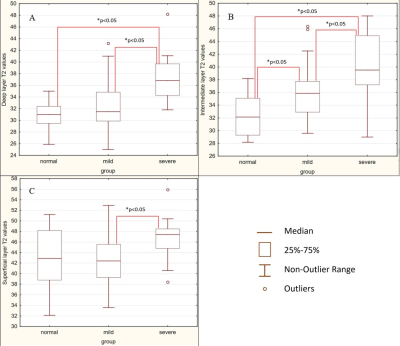
Fig. 3. Comparison of the T2 values in patients
of the normal group, the mild injury group, and the severe injury group. A –
deep layer, B- intermediate layer, C – superficial layer.