-
Deep learning super-resolution MR spectroscopic imaging to map tumor metabolism in mutant IDH glioma patients
Xianqi Li1, Bernhard Strasser1, Kourosh Jafari-Khouzani2, Daniel P Cahill3, Jorg Dietrich4, Tracy T Batchelor4, Martin Bendszus5, Ulf Neuberger6, Philipp Vollmuth6, and Ovidiu Andronesi7
1Radiology, Massachusetts General Hospital, Charlestown, MA, United States, 2IBM Watson Health, Boston, MA, United States, 3Neurosurgery, Massachusetts General Hospital, Boston, MA, United States, 4Massachusetts General Hospital, Boston, MA, United States, 5Heidelberg University Hospital, Boston, MA, United States, 6Heidelberg University Hospital, Heidelberg, Germany, 7Massachusetts General Hospital,, Charlestown, MA, United States
We developed deep learning super-resolution MR spectroscopic imaging
(MRSI) to map tumor metabolism in patients with mutant IDH glioma. The preliminary results on simulated and in vivo data indicate that the
proposed method is effective in enhancing the spatial resolution
of metabolite maps.
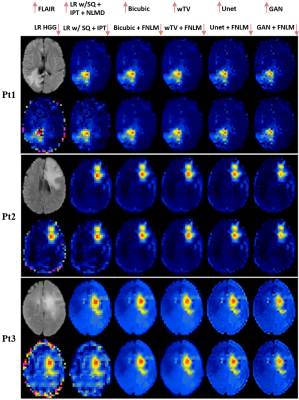
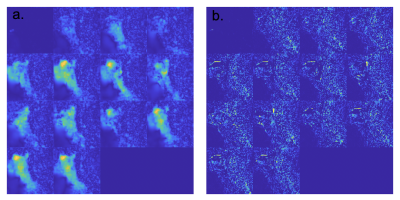
Fig.5: Upsampled HGG metabolic maps with size 184 x 184
using three measured patients data. From left to right (top), FLAIR,
low-resolution (LR) HGG with size 46 x 46 after spectral quality (SQ) control, missing data
filling in by inpainting (IPT) method and nonlocal means denoising (NLMD),
super-resolution (SR) maps by Bicubic, weighted total variation (wTV), Unet and
GAN. From left to right (bottom), LR HGG with size 46 x 46, LR HGG with size 46 x 46 after SQ control, missing data filling in by IPT
method , SR maps by Bicubic+FNLM, wTV+FNLM, Unet+FNLM and GAN+FNLM.
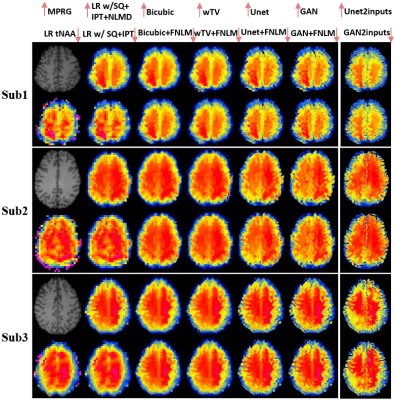
Fig.4: Upsampled total N-acetylaspartate
(tNAA) maps with size 184x184
using three measured healthy subjects data. From left to right (top),
high-resolution (HR) MEMPRAGE (MPRG), low-resolution (LR) tNAA with size 46 x 46 after spectral quality (SQ) control, missing data
filling in by inpainting (IPT) method and nonlocal means denoising (NLMD),
super-resolution (SR) maps by shown methods. From left to right (bottom), LR tNAA with size 46 x 46, LR tNAA with size 46 x 46 after SQ control, missing data filling in by IPT
method , SR maps by shown methods.
-
Twofold Improved Tumor-to-Brain Contrast using a Novel T1 Relaxation-Enhanced Steady-State (T1RESS) Technique
Robert R Edelman1,2, Nondas Leloudas3, Jianing Pang4, Julian Bailes5, Ryan Merrell6, and Ioannis Koktzoglou3,7
1Radiology, NorthShore University HealthSystem, EVANSTON, IL, United States, 2Feinberg School of Medicine, Northwestern University, Chicago, IL, United States, 3Radiology, NorthShore University HealthSystem, Evanston, IL, United States, 4Siemens Medical Solutions USA, Chicago, IL, United States, 5Neurosurgery, NorthShore University HealthSystem, Evanston, IL, United States, 6Medicine, NorthShore University HealthSystem, Evanston, IL, United States, 7Pritzker School of Medicine, University of Chicago, Chicago, IL, United States
We describe a novel class of steady-state pulse sequence called T1RESS that provides excellent SNR and contrast, as well as flexible control of intravascular signal. For contrast-enhanced brain imaging, T1RESS demonstrated a remarkable two-fold improvement in tumor-to-brain contrast.
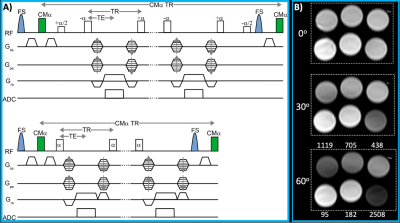
Fig. 1. A) T1RESS pulse sequence using balanced (top) and unbalanced (bottom) steady-state readouts. A non-spatially selective contrast-modifying RF pulse (CMα) is applied periodically over the entire duration of the echo train to introduce an arbitrary amount of T1 weighting. B) Phantom consisting of serial dilutions of gadobutrol imaged with bT1RESS using CMα values of 0o, 30o and 60o. Note that there is negligible T1 contrast for a CMα flip angle of 0o, but substantial T1 contrast is apparent as the flip angle is increased to 60o.
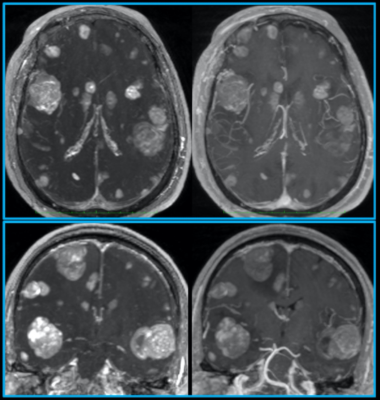
Fig. 2. Pulse sequence comparisons after contrast administration in a patient with metastatic melanoma. 10-mm thick axial (top) and coronal (bottom) maximum intensity projections are shown to highlight differences in lesion visibility for uT1RESS (left) and 3D spoiled GRE (right). Small metastatic lesions are much better visualized using uT1RESS than with 3D spoiled GRE. The combination of twofold increased tumor-to-background contrast, improved CNR and suppression of intravascular signals with uT1RESS is helpful to unambiguously identify small metastases.
-
Predictive Role of the ADC measurements and MRI Morphologic Features on Isocitrate Dehydrogenase Status in Patients with Diffuse Glioma.
jun zhang1,2, Hong Peng1, Yu-Lin Wang1, De-Kang Zhang1, and Lin Ma1
1Radiology, Chinese PLA general hospital, BeiJing, China, 2radiology, the sixth center of Chinese PLA general hospital, BeiJing, China
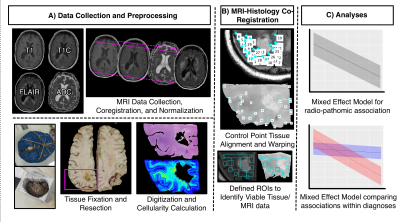
In this study, using machine learning methods, the accurate
prediction of IDH status was achieved for diffuse glioma via noninvasive MR
imaging, including ADC values and tumor morphologic features, and it is worth
mentioning ADC measurements applied are available in clinical workstations.
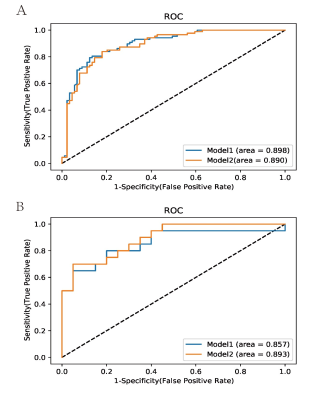
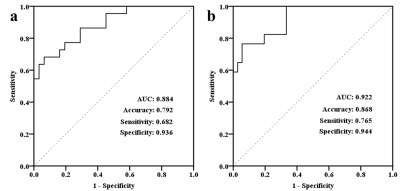
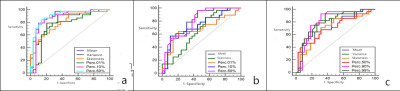
Multivariable
logistic regression analysis (including age, rADC and selected imaging
features) was used to predict IDH status. (A) ROC curves of the
multivariable probabilities for model 1 and model 2 show similar model
performance in the study set. Model
1 consisted of rADC, age, enhancement pattern, calcification, cystic change and
hemorrhage. Model 2 consisted of rADC, age, enhancement pattern, cystic change,
hemorrhage and absence of calcification. (B) ROC curves of the multivariable
probabilities for model 1 and model 2 show similar performance with the test
set.
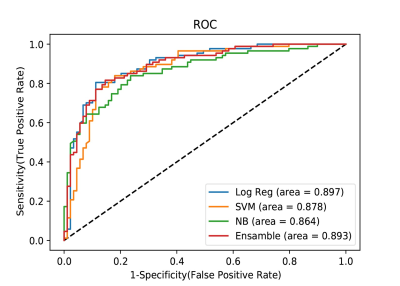
Comparison
of AUCs among machine learning models. Receiver operating characteristic curves
shown for logistic regression (Log Reg), support vector machine (SVM), Naive
Bayes (NB) and Ensemble (random forest + eXtreme Gradient Boosting) in predicting
IDH status of glioma. Log Reg yielded the greatest AUC for single-model
prediction.
-
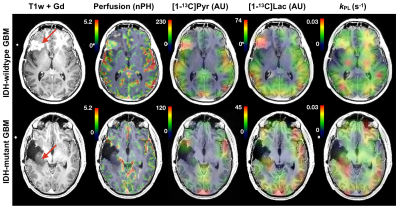
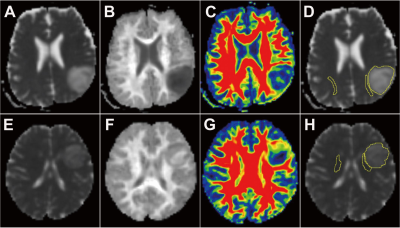
Glioblastoma grading using perfusion parameters: comparing quantitative transport mapping method and kinetic modeling method
Qihao Zhang1, Gloria Chia-Yi Chiang2, Thanh Nguyen2, Pascal Spincemaille2, and Yi Wang1
1Cornell University, New York, NY, United States, 2Weill Cornell Medical College, New York, NY, United States
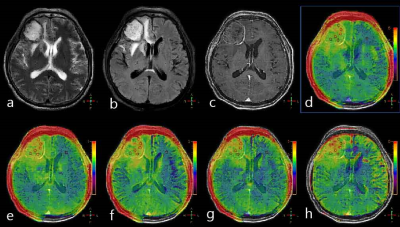
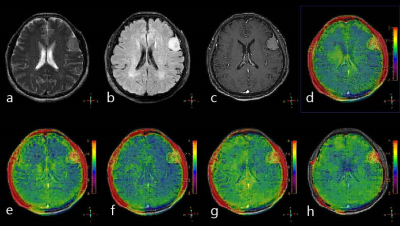
QTM method can be applied to glioblastoma grading to eliminate the artery input function (AIF) dependency of kinetic modeling method.
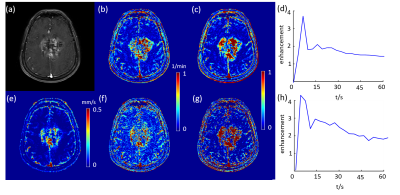
DCE MRI of a grade IV glioblastoma (figure a). (b) and (c) Ktrans and Ve using feeding artery of the tumor, respectively. (d) sampled AIF. (e) QTM velocity magnitude map. (f) and (g) Ktrans and Ve using carotid artery of the tumor, respectively. (h) sampled AIF.

DCE MRI of a grade II glioblastoma (figure a). (b) and (c) Ktrans and Ve using feeding artery of the tumor, respectively. (d) sampled AIF. (e) QTM velocity magnitude map. (f) and (g) Ktrans and Ve using carotid artery of the tumor, respectively. (h) sampled AIF.
-
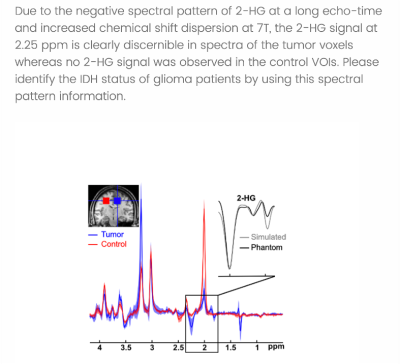
Strategy to overcome the spectral overlap between the 2-hydroxyglutarate and lipid resonances at 2.25 ppm
Pegah Askari1, Ivan E Dimitrov1, Michael Levy1, Toral R Patel1, Edward Pan1, Bruce E Mickey1, Craig R Malloy1, Elizabeth A Maher1, and Changho Choi1
1University of Texas Southwestern Medical Center, Dallas, TX, United States
The lipid resonance
at 2.25 ppm often complicates 1H MRS evaluation of 2HG. Incorporating new lipid
basis sets in spectral fitting of 3T PRESS data from 43 glioma patients showed complete
distinction between IDH mutation and wildtype (accuracy, sensitivity, and
specificity all unity).
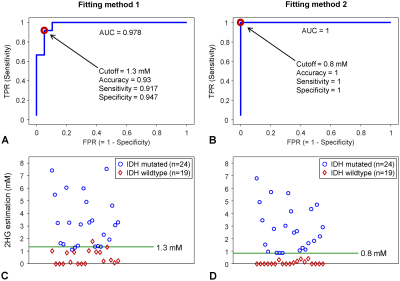
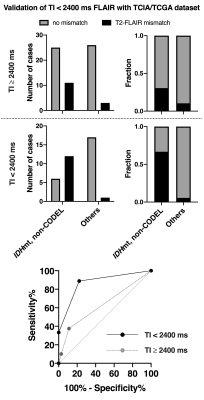
FIG 4. (A,B) ROC analyses of the 2HG
estimates from 43 patients are presented for Fitting methods 1 and 2. A red circle on an ROC curve
corresponds to the smallest distance to the upper-left corner of the curve, at
which a cutoff value was obtained as 1.3 and 0.8 mM for Fitting methods 1 and 2,
respectively. (C,D) 2HG
estimates from 24 IDH mutated and 19 IDH wildtype tumor patients are shown for
Fitting methods 1 and 2. Green lines indicate the cutoff values from the ROC
curves. For Fitting method 2, the 2HG estimates in IDH mutated tumors were 0.8
- 6.8 mM and those in IDH wildtype tumors were 0 - 0.4 mM.
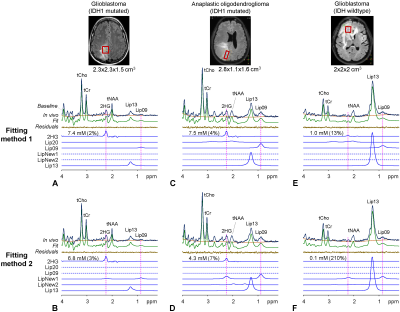
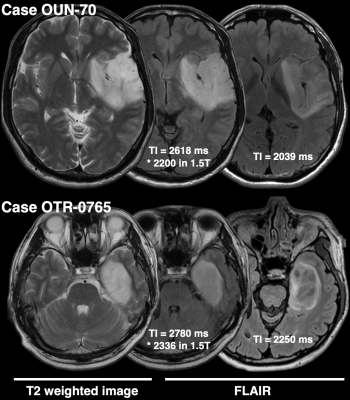
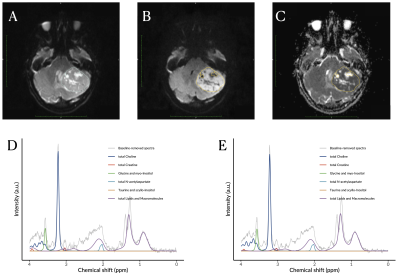
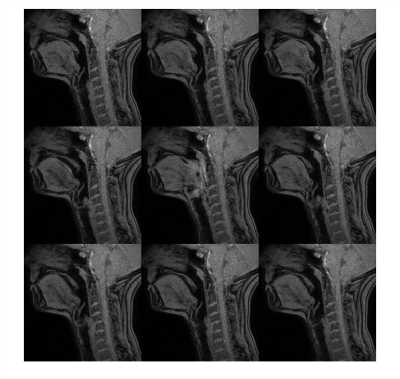
FIG 1. Representative in vivo PRESS TE 97 ms spectra from three glioma patients are presented with LCModel
fitting outputs and voxel positioning on T2-FLAIR images. LCModel-returned 2HG
signals are shown with 2HG estimates and CRLB in brackets. The LCModel
built-in lipid basis set (Fitting method-1) included Lip09, Lip20, and Lip13. New
lipid basis set (Fitting method-2) included LipNew1, LipNew2, and Lip13. Dotted
lines denote exclusion of the lipid signals in the basis set. Spectra are
scaled with respect to the water signal from the voxel. Vertical lines are
drawn at 2.25 and 0.9 ppm.
-
Vascular input function measurement in brain tumor DCE-MRI: a comparison of arterial and venous sinus based approaches
Xiaoping Zhu1, Daniel Lewis2, Ka-Loh Li1, Sha Zhao3, Timothy Cootes1, Andrew King2, David Coope2, and Alan Jackson3
1DIIDS, University of Manchester, Manchester, United Kingdom, 2Neurosurgery, Salford Royal NHS Foundation Trust, Manchester, United Kingdom, 3University of Manchester, Manchester, United Kingdom
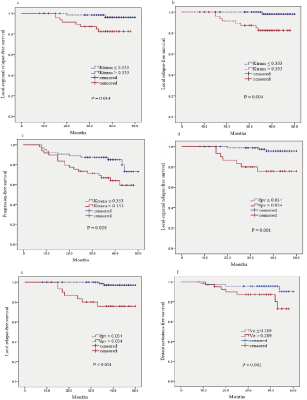
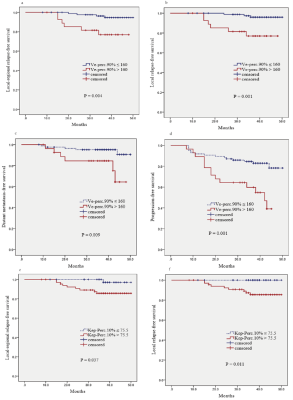
In brain DCE-MRI the superior sagittal sinus can provide a superior global VIF compared to large intracranial arteries, demonstrating lower noise, higher bolus peak-amplitude and greater sensitivity to inter-individual changes in plasma contrast-agent concentration.
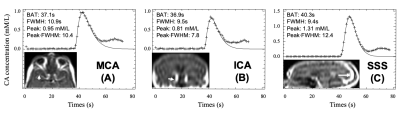
Figure 2: Typical plasma contrast-agent concentration curves Cp(t) extracted from the horizontal segment of the middle cerebral artery (arrow head), MCA (A); vertical segment of the ICA (short arrow), carotid syphon (B); and vertical segment of the SSS (long arrow) (C) following a bolus injection of 0.023 mmol/kg of GBCA. The 1st-pass data are fitted using a gamma variate function, which excludes contrast-agent bolus recirculation. 3D T1-weighted gradient recalled echo mages obtained from a patient with a sporadic VS scanned at 1.5T.
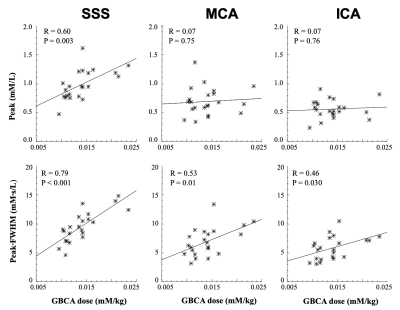
Figure 3: Relationship between extracted VIF features and administered GBCA dose for VIFSSS, VIFMCA and VIFICA. Top row: Scatter plots of VIF peak (mM/L) vs administered GBCA dose (mM/kg). Bottom row: Scatter plots of area (= peak∙FWHM: full-width at half-maximum, mM·s /L) of VIF vs administered GBCA dose.
-
Structural and Functional Changes in Patients with Lower Grade Tumors Receiving Partial Brain Radiotherapy: A Longitudinal Study
Alan Finkelstein1, Arun Venkataraman2, Madalina Tivarus3, Md Nasir Uddin4, Jianhui Zhong1,2,3, Giovanni Schifitto3,4, Michael Milano5, Michelle Janelsins6, and Sara Hardy4,5
1Biomedical Engineering, University of Rochester, Rochester, NY, United States, 2Physics and Astronomy, University of Rochester, Rochester, NY, United States, 3Imaging Sciences, University of Rochester, Rochester, NY, United States, 4Neurology, University of Rochester, Rochester, NY, United States, 5Radiation Oncology, University of Rochester, Rochester, NY, United States, 6Surgery, University of Rochester, Rochester, NY, United States
Patients with lower grade tumors experience cognitive impairment in the setting of partial brain radiotherapy (RT). To understand what structures are susceptible to RT, structural and functional connectivity analysis were performed to evaluate how RT affects network topology.
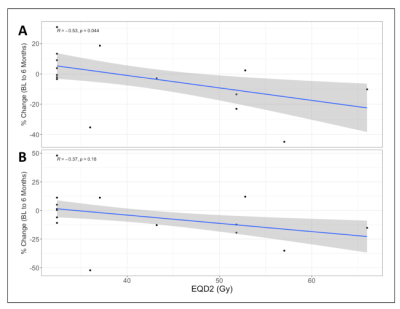
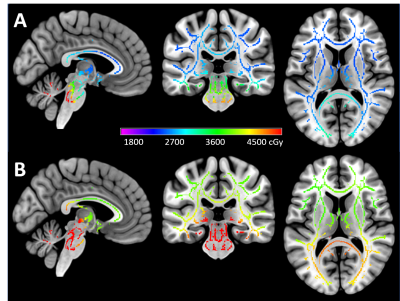
Figure 1. Global graph theory metrics as a function of dose (EQD2) in Gy. A. Global efficiency and B. Transitivity reported as the percent change from baseline to 6 months. Solid lines are linear fits and shaded areas represent the 95% confidence interval. Pearson’s Correlation Coefficient
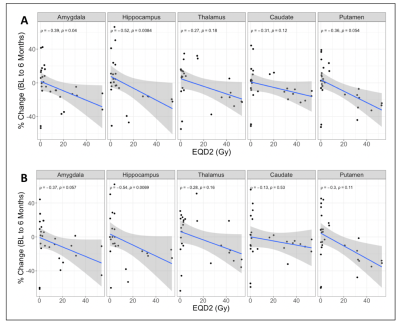
Figure 2. Local graph theory metrics for subcortical regions. Percent change in A. Local efficiency and B. Clustering Coefficient as a function of EQD2 (Dose) in Gy. Solid lines are linear fits and shaded areas are the 95% confidence interval.
-
Contrast-enhanced T1-weighted DANTE-SPACE, PETRA, and MPRAGE: clinical evaluation comparison in intracranial tumor patients at 3T
Qing Fu1,2, Qi-guang Cheng1,2, Xiao-yong Zhang3, Xiang-chuang Kong1,2, Ding-xi Liu1,2, Yi-hao Guo4, John Grinstead5, Zi-qiao Lei1,2, and Chuan-sheng Zheng1,2
1Department of Radiology, Union Hospital, Tongji Medical College, Huazhong University of Science and Technology, Wuhan, China, 2Hubei Province Key Laboratory of Molecular Imaging, Wuhan, China, 3Centers for Biomedical Engineering, University of Science and Technology of China, Hefei, China, 4MR Collaboration, Siemens Healthcare Ltd., Guangzhou, China, 5Siemens Medical Solutions USA, Inc., Portland, OR, United States
Small cerebral metastases can be difficult to differentiate from blood vessels and surrounding parenchyma. Here we show that DANTE-SPACE outperforms both conventional MPRAGE and an advanced technique (PETRA) through blood vessel suppression.
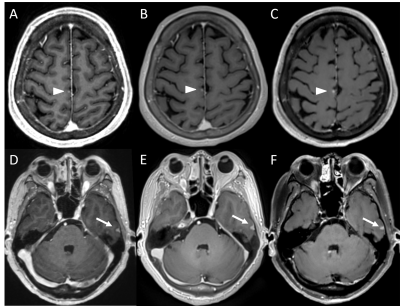
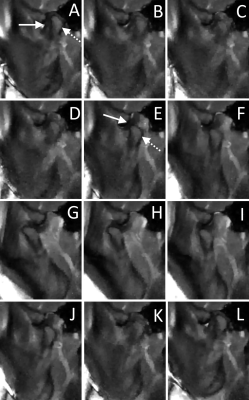
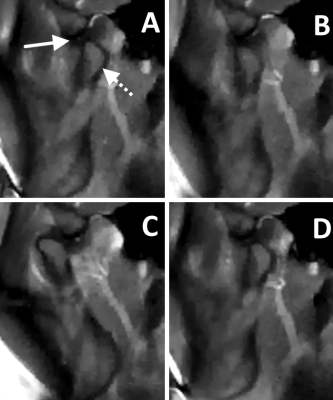
Figure 1. Representative images of MPRAGE (A, D), PETRA (B, E) and DANTE-SPACE (C, F) of a 57-year-old male with cerebral metastases of lung cancer. A-C: a well-enhanced lesion (arrowheads) near the cerebral falx in the right frontal lobe is seen in all sequences. The lesion is more conspicuous with DANTE-SPACE due to blood vessel suppression and high CNR, and could have been mislabeled as a small vessel with MPRAGE and PETRA. D-F: a small homogeneously meningioma in the left temporal lobe was displayed clearly in all sequences with clear margin
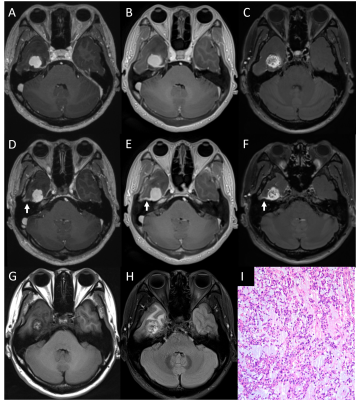
Figure 2. Post-contrast T1-weighted images of an enhancing tumor in right temporal lobe in a 37-year-old female. The signal intensity within this tumor was relatively homogeneous in MPRAGE (A) and PETRA (B), but it was heterogeneous in DANTE-SPACE (C). The enhancing effect (arrows) of adjacent meninges is more continuous in PETRA. The tumor signal from DANTE-SPACE (C) closely resembles pre-contrast T1WI and T2WI (G, H), and it was identified as a myopericytoma by surgical pathology (I).
-
Evaluation of Ultrafast Post-Contrast Wave-CAIPI 3D-T1 MPRAGE Compared to Standard 3D-T1 MPRAGE for Evaluating Enhancing Lesions on 3T MRI.
Augusto Lio M. Goncalves Filho1,2, John Conklin1,2, Chanon Ngamsombat3, Stephen F. Cauley2, Wei Liu4, Daniel N. Splitthoff5, Wei-Ching Lo6, John E. Kirsch1, Pamela W. Schaefer1, Otto Rapalino1, and Susie Y. Huang1,2
1Department of Radiology, Massachusetts General Hospital, Boston, MA, United States, 2Department of Radiology, Athinoula A. Martinos Center for Biomedical Imaging, Charlestown, MA, United States, 3Department of Radiology, Siriraj Hospital, Bangkok, Thailand, 4Siemens Shenzhen Magnetic Resonance Ltd., Shenzhen, China, 5Siemens Healthcare GmbH, Erlangen, Germany, 6Siemens Medical Solutions Inc., Boston, MA, United States
An accelerated post-contrast Wave-CAIPI 3D T1 MPRAGE sequence is
non-inferior to the standard T1 MPRAGE for detection of intracranial enhancing lesions
in 3T MRI while providing a 2-fold reduction in acquisition time and being less
sensitive to motion artifacts.
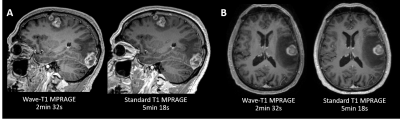
Figure 2. Representative
images showing a comparison of post-contrast Wave-CAIPI T1 MPRAGE and standard
T1 MPRAGE sequences. (A) A 56-year-old male with brain metastases from
squamous-cell carcinoma. (B) A 71-year-old male with brain metastases
from non-small cell lung cancer.
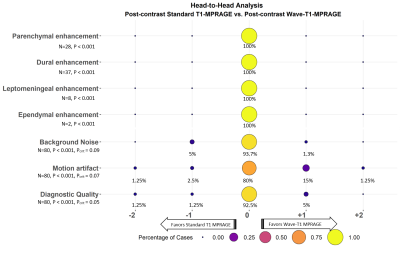
Figure 1. Balloon plot showing the results of the
head-to-head comparison of post-contrast standard T1 MPRAGE and post-contrast
Wave-CAIPI T1 MPRAGE for visualization of abnormal intracranial enhancing
lesions, the perception of noise, presence of artifacts due to motion, and the
overall diagnostic quality. A zero-score indicates equivalency, negative scores
(left) favor standard T1 MPRAGE, and positive scores (right) favor Wave-T1
MPRAGE.
-
DiffusionGo: A fully automatic fiber tracking software for neurosurgeon
Shin Tai Chong1, Jianping Song2, Kuan-Tsen Kuo3, Yu-Ting Ko3, Sanford PC Hsu4, Jinsong Wu2, and Ching-Po Lin1
1Institute of Neuroscience, National Yang-Ming University, Taipei, Taiwan, 2Department of Neurosurgery, Huashan Hospital, Shanghai Medical College, Fudan University, Shanghai, China, 3ABC Solution Co., Ltd, Shanghai, China, 4Department of Neurosurgery, Neurological Institute, Taipei Veterans General Hospital, Taipei, Taiwan
DiffusionGo is an in-house developed software specially designed for neurosurgeons, which integrated a reliable pre-processing pipeline, fully automatically fiber reconstruction algorithm, and multimodalities imaging information to achieve easy modeling and precision surgery.
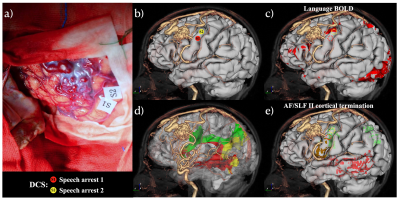
Multimodalities integration in a 60-year-old male with left frontal bAVM in DiffusionGo. S1 and S2 Speech arrest was defined as discontinuation in number counting without simultaneous motor response by DCS (a). AF (red), SLF II (green), and posterior segment of SLF (yellow) were automatically reconstructed (d). Comparing with language BOLD functional activation (c), Tract-based cortical termination (AF termination in red; SLF II termination in green; orange color represented the overlap of AF and SLF II) has more sensitivity to manifest with DCS results (e).
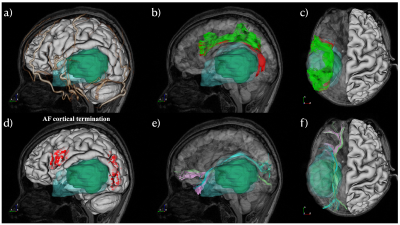
A 41-year-old female with temporal lobe glioblastoma was reconstructed and displayed in DiffusionGo. Cortical surface (white), blood vessel (gold), tumor (green), and peritumoral edema (light blue with translucent) were integrated (a). The lateral view and superior view of the tumor, dorsal language pathway (AF, red; SLF II, green), and ventral language pathway (IFL, light blue; IFOF, light green; UF, pink). The termination projection of AF was shown in d. Superior displacement of left Wernicke’s area was identified with intact AF projecting to left premotor and left Broca areas.
-
The combined value of DKI and DSC MRI in differentiating high-grade glioma recurrence from pseudoprogression
Yan Tan1, Wenwei Shi2, Xiaochun Wang1, and Hui Zhang1
1Department of Radiology, First Hospital of Shanxi Medical University, Taiyuan, China, 2Department of Radiology, Zhongda Hospital, Southeast University, Nanjing, China
rMK can differentiate
recurrent tumor from pseudoprogression with high diagnostic accuracy, and its
application value is similar to that of rCBV. The combination of rMK and rCBV
improves diagnostic performance compared to either technique alone.
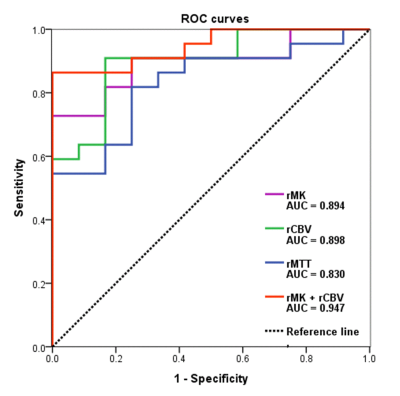
ROC curves of DKI and DSC MRI parameters for differentiating glioma
recurrence from pseudoprogression.
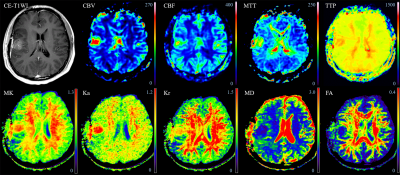
A 21-year-old man with tumor recurrence confirmed by repeat surgery was
initially a high-grade glioma (WHO IV). An increasing
enhanced lesion in the right frontal and temporal lobes was detected on CE-T1WI
with increased CBV, CBF, MTT, TTP, MK, Ka and Kr values, except for MD and FA
values.
-
Development of MR Elastography Methods for Assessing Adhesion Between Pituitary Masses and the Optic Chiasm
Yi Sui1, Myung-Ho In1, Salomon Cohen-Cohen2, Erin Gray1, Kevin Glaser1, Matt A. Bernstein1, Jamie J Van Gompel2, Richard L. Ehman1, John Huston III1, and Ziying Yin1
1Radiology, Mayo Clinic, Rochester, MN, United States, 2Neurologic Surgery, Mayo Clinic, Rochester, MN, United States
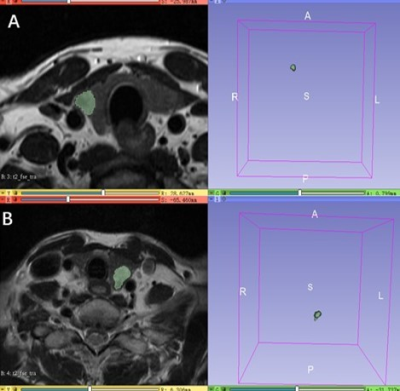
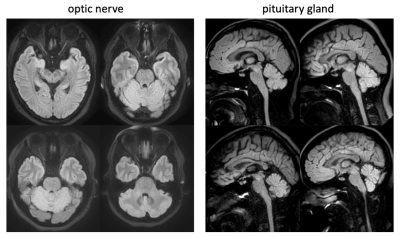
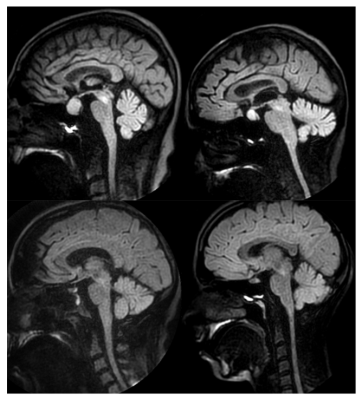
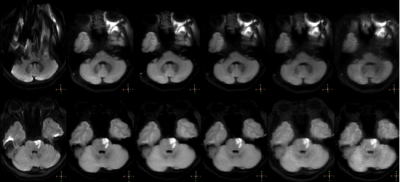
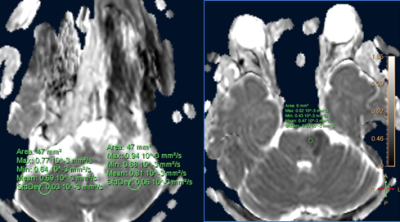
A distortion-free EPI-MRE technique was developed to acquire ~1mm high resolution NOSS map for assessing adhesion between pituitary adenoma and adjacent optic chiasm.
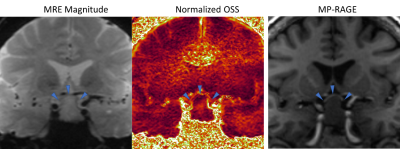
Figure 1: Distortion-free EPI-MRE
magnitude, NOSS map, and MP-RAGE image from a pituitary adenoma patient.
-
Conventional MRI Texture Analysis to Predict Proliferative Behaviour in Gliomas
Xiaoxin Li1, Qingwei Song1, Ailian Liu1, Lizhi Xie2, and Yanwei Miao1
1First Affiliated Hospital of Dalian Medical University, Dalian, China, 2GE Healthcare, MR Research China, Beijing, China
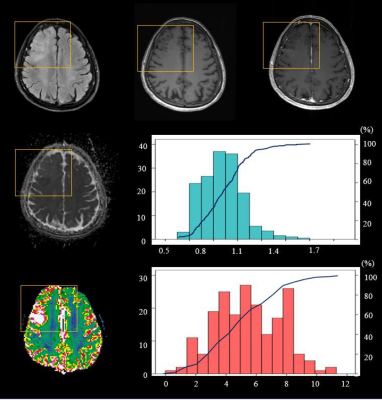
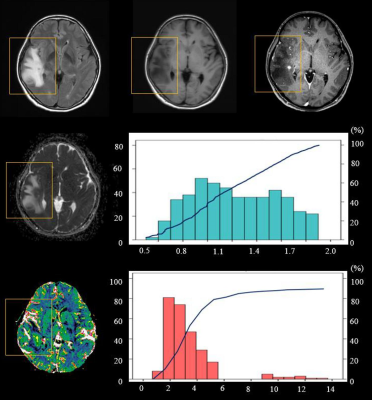
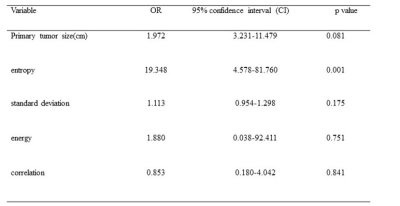
To evaluate the application value of texture analysis based on conventional MRI for predicting the cell proliferation status of glioma.
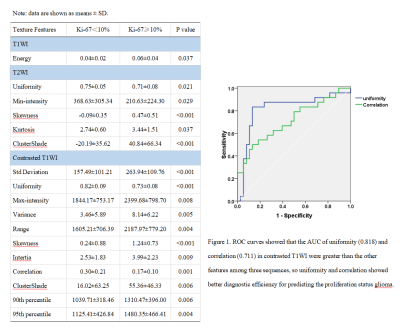
ROC curves showed that the AUC of uniformity (0.818) and correlation (0.711) in contrasted T1WI were greater than the other features among three sequences, so uniformity and correlation showed better diagnostic efficiency for predicting the proliferation status glioma.
-
Value of Diffusion Kurtosis Imaging in Detecting Isocitrate Dehydrogenase Genotype in Low-grade Gliomas
Tao Gong1, Liangjie Lin2, and Yihang Yang3
1Shandong Medical Imaging Research Institute, Jinan, China, 2Philips Healthcare, Beijing, China, 3Shandong provincal hospital, Jinan, China
IDH 1 wild-type gliomas have higher
MK and lower MD values in tumor foci compared with IHD 1 mutant gliomas. Lower FA in perilesional white matter was seen in wild-type gliomas, while no difference was found in mutant patients, suggesting greater infiltrative nature in IDH 1 wild-type gliomas.
Figure
1.
MD
(A), MK (B) and FA color (C) maps in a 35-year-old man with IDH 1-mutated
glioma (WHO II); and MD (E),
MK (F) and FA color (G) maps in a 36-year-old woman with IDH 1 wild-type glioma
(WHO II); ROIs of glioma foci, pWM and cNAWM were drawn on non-smoothed MD maps
(D and H). MD = mean
diffusion; MK = mean kurtosis; FA = fractional anisotropy; pWM = perilesional
white matter; cNAWM = contralateral normal appearing white matter;
ROI
= region of interest.
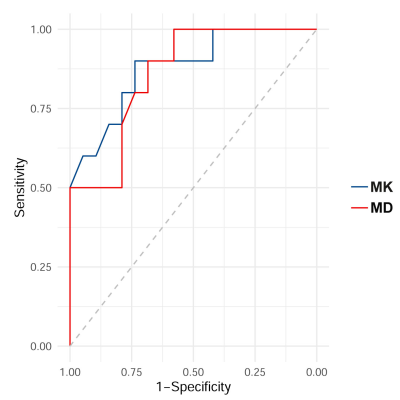
Figure
3.
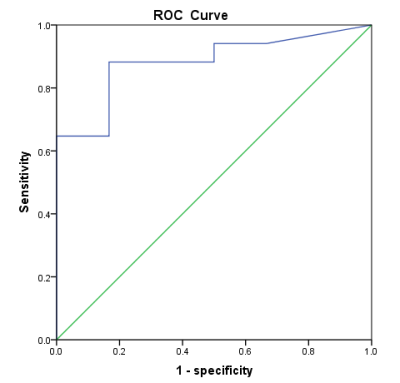
ROC curves of MK and MD values calculated from the glioma foci for
differentiating IDH 1 mutant and wild-type low-grade gliomas. The AUC of MK was
0.88 (95% CI, 0.74~1.00), MD was 0.86 (95%CI, 0.73~0.99). MK = mean kurtosis;
MD = mean diffusion.
-
Simultaneously acquired PET and ASL imaging biomarkers are helpful in differentiating progression from pseudo-progression in treated gliomas
Nadya Pyatigorskaya1,2,3, Arnaud Pellerin1, Maya Kalife4, Marc Bertaux5, Marine Soret5, Didier Dormont1, and Aurélie Kas5
1Neuroradiology, Pitié-Salpêtrière Hospital, APHP, Sorbonne universite, Paris, France, 2UMR S 1127, CNRS UMR 722, ICM, Sorbonne Universités, Paris, France, 3CENIR, ICM, Sorbonne Universités, Paris, France, 4CENIR, ICM, Paris, France, 5Nuclear Medecine, Pitié-Salpêtrière Hospital, APHP, Sorbonne universite, Paris, France
We aimed at investigating the methods based on coupling cerebral perfusion and amino-acid metabolism measurements to evaluate the PET/MRI in glioma follow-up. The tumour isocontour maps and T-maps showed the highest specificity and sensitivity for ASL and 18F-DOPA analysis.
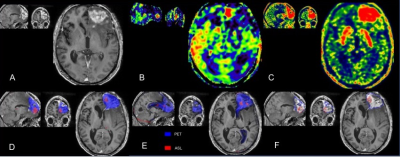
PET-MR of a patient with left WHO IV glioblastoma treated by surgery and adjuvant radio-chemotherapy.
Upper row: A: enhancement on the frontal lesion on a contrast-enhanced axial T1-w image; B: hyper-perfusion with increased CBF on ASL images corresponds to the area of contrast enhancement; C: 18F-DOPA PET map with increased SUV
Lower row: SPM maps were concordant with significant clusters, which confirmed progression. The red ASL clusters appear to be more peripheral than the blue extensive PET clusters. D: T-score map; E: Z-score of asymmetry index; F: isocontour map.
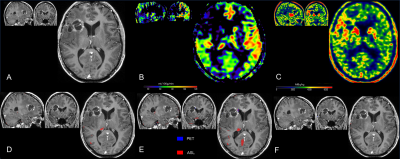
PET-MR of patient with right glioblastoma, treated by surgery and adjuvant radiotherapy
Upper row: A: linear cavitary enhancement observed on the initially-treated frontal lesion site on a contrast-enhanced axial T1-w image; B: the absence of hyper-perfusion as assessed by CBF on ASL images; C: 18F-DOPA PET map showing no significantly increased SUV
Lower row: SPM maps were concordant, with the absence of significant clusters, which confirmed pseudo-progression. D: T-score map; E: Z-score of asymmetry index; F: isocontour map.
-
Applying 2HG MRS in glioma patients during routine clinical MRI examination
Zahra Shams1, Sarah M. Jacobs1, Jan W. Dankbaar1, Changho Choi2, Dennis W.J. Klomp1, Jannie P. Wijnen1, and Evita C. Wiegers1
1Department of Radiology, University Medical Center Utrecht, Utrecht, Netherlands, 2Advanced Imaging Research Center, University of Texas Southwestern Medical Center, Dallas, TX, United States
We implemented 2HG MR spectroscopy in the
clinical routine of the glioma patients. We showed technical feasibility, the
success rate and robustness of the protocol.
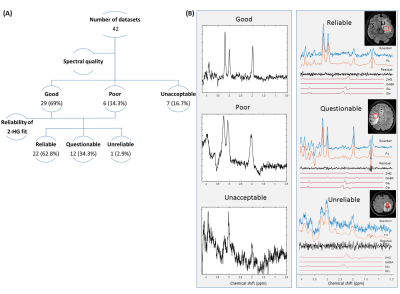
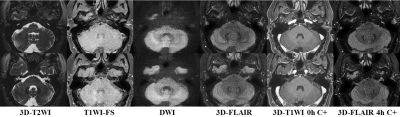
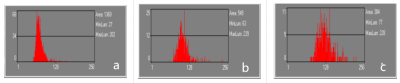
Figure 1. Evaluation of the spectra based on quality and
reliability of the 2HG fit. Examples of each group have been shown in (B).
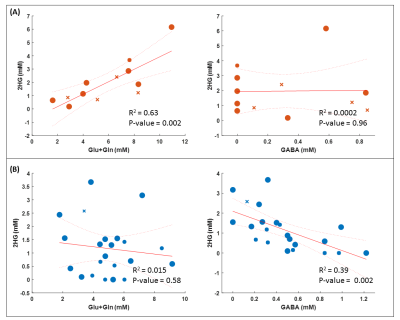
Figure 3. The relationship between 2HG concentration and the
concentration of Glu+Gln and GABA in ‘Questionable’ (A) and ‘Reliable’ (B)
fits. ×: information on voxel location in the tumor tissue is not available.
Small marker size: no tumor (likelihood of 0-25%); big marker size: tumor
(likelihood of 50-100%).
-
High dual-contrast putamen MRI at 1.5T: Application to intraoperative MRI during neurosurgical procedure
Chan Hong Moon1, Krystof Bankiewicz2, Paul Larson2, Adrian Kells3, Alastair J. Martin2, Stephen Mancuso4, and Mark Richardson5
1University of Pittsburgh, Pittsburgh, PA, United States, 2University of California San Francisco, San Francisco, CA, United States, 3Voyager Therapeutics Inc., Cambridge, MA, United States, 4UPMC, Pittsburgh, PA, United States, 5Massachusetts General Hospital, Boston, MA, United States
In this study, we developed new dual-contrast MPRAGE and maximized T1 contrast in putamen as well as good anatomy of whole brain without additional acquisition compared to conventional MPRAGE. The proposed methods were applied to 1.5T iMRI during neurosurgical procedure of PD patients.
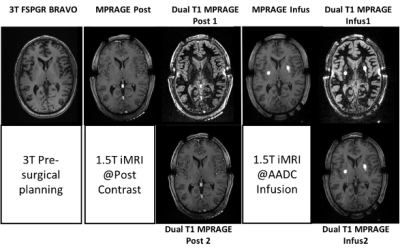
Fig. 3 T1 anatomy MRI; (from left) Pre-surgical @3T, Post contrast at1.5T (MPRAGE, dual T1 MPRAGEs) and AADC infusion at1.5T (MPRAGE, dual T1 MPRAGEs). Note that new dual T1 MPRAGE at1.5T can provide higher contrast of Put than that at 3T. In addition, dual T1 MPRAGE provides good whole brain anatomy. White spots are the targeted infusion regions.
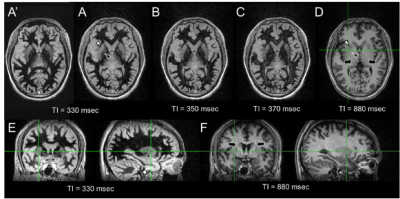
Fig. 2 3D MPRAFGE MR images at effective TI 330 (A and A’), 350 (B), 370 (C) and 880 msec (D) at kz = 0; only axial images are shown. The images in A and A’ were acquired at a week apart sessions. Black arrows indicate the aliasing artifact in conventional MPRAGE image. Note that the signal in the white mater at optimal TI ~330 msec is well suppressed and the contrast of putamen (white arrowhead) and glubus pallidus (black arrowhead) vs. white mater is much higher than those of conventional MPRAGE image at effective TI 880 msec. In addition, the optimal TI MPRAGE MRI is reproducible.
-
Detection of Cystathionine, 2-Hydroxyglutarate and Citrate in Oligodendrogliomas at 7T using Long-TE Semi-LASER
Uzay E Emir1,2, Natalie E Voets3, Sarah E Larkin4, Nick De Pennington4, Puneet E Plaha4, Richard E Stacey4, James E Mccullagh4, Christopher J Schofield4, Stuart E Clare3, Peter Jezzard3, Thomas Cadoux-hudson4, and Olaf E Ansorge4
1School of Health Sciences, Purdue University, West Lafayette, IN, United States, 2Weldon School of Biomedical Engineering, Purdue University, West Lafayette, IN, United States, 3Wellcome Centre for Integrative Neuroimaging, Nuffield Dept of Clinical Neurosciences, University of Oxford, Oxford, United Kingdom, 4University of Oxford, Oxford, United Kingdom
We demonstrate that long-TE semi-LASEr at 7 Tesla has the potential to allow presurgical stratification of patients with IDH-mutant glioma into those with oligodendrogliomas and astrocytomas; which is of important prognostic significance.
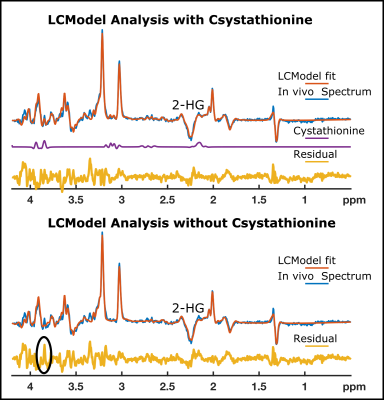
LCModel analysis of an IDH mutant glioma patient's spectrum with and without cystathionine in the basis set
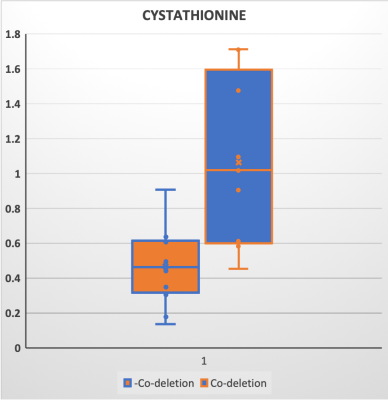
Metabolite ratios of cystathionine over total choline in codeleted and no-codeleted gliomas
-
Dose Painting Intensity-modulated Radiotherapy Guided by 3D arterial spin labeling MRI for Brain Metastases
Chuanke Hou1, Guanzhong Gong1, Weiqiang Dou2, and Yong Yin1
1Department of Radiation Physics, Shandong Cancer Hospital and Institute, Shandong First Medical University and Shandong Academy of Medical Sciences, Jinan, China, 2GE Healthcare, MR Research China, Beijing, China
3D-Araterial Spine Labeling can be used to segment high and low cerebral blood flow sub-volumes. Then the plan with maximum dose constraint performed better for dose escalation in low cerebral blood flow (hypoxic) sub-volumes without increasing the dose delivered to organs at risk.
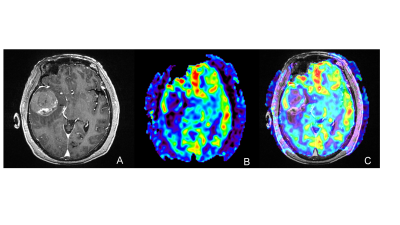
Figure1 Different tumor information was shown between contrast-enhanced T1W images and 3D-ASL images. A: contrast-enhanced T1W images; B:3D-ASL; C: 3D-ASL fusion registration to contrast-enhanced T1W images.According to the enhanced area shown in the figure A, figure B showed the uneven distribution of CBF in tumor. The high cerebral blood flow area was mainly located on the right side of the enhanced edge, while the low cerebral blood flow area and the enhanced area overlap in a large region. Moreover, the fusion image C showed this result more clearly.
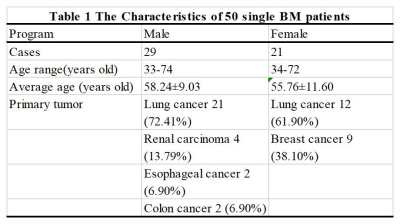
Table 1 The Characteristics of 50 single BM patients
-
Multi-parametric MRI in differentiation between brain tumor and radiation necrosis
Sean P Devan1, Xiaoyu Jiang1, Guozhen Luo2, Jingping Xie1, Zhongliang Zu1, Ashley M Stokes3, Austin N Kirschner2, John C Gore1, and Junzhong Xu1
1Institute of Imaging Science, Vanderbilt University Medical Center, Nashville, TN, United States, 2Radiation Oncology, Vanderbilt University Medical Center, Nashville, TN, United States, 3Keller Center for Imaging Innovation, Barrow Neurological Institute, Phoenix, AZ, United States
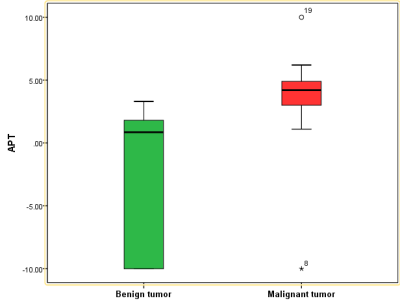
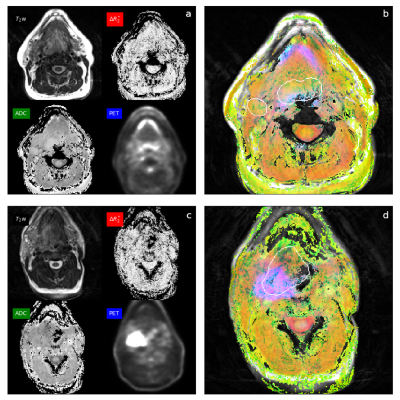
Six MRI methods were
performed and compared to differentiate between normal appearing brain tissues,
9L gliosarcoma brain tumors, and radiation necrosis in animal models. APT and
SSIFT provide the best discrimination of different tissue types.
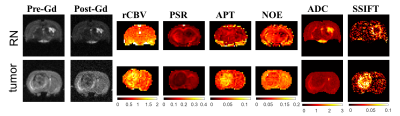
Representative
multi-parametric maps of two rat brains with an RN in the left hemisphere (top)
and a 9L tumor in the right hemisphere (bottom).
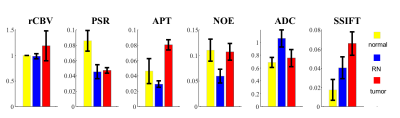
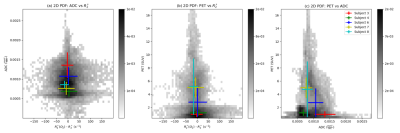
Summarized ROI-based MRI parameters in the differentiation of contralateral normal
appearing brain tissue (n=9), radiation necrosis (RN, n=5), and 9L brain tumor (n=4).