-
Fast High-Resolution 1H-MRSI of the Human Brain at 7T
Rong Guo1,2, Yibo Zhao1,2, Yudu Li1,2, Pallab Bhattacharyya3, Mark Lowe3, Hannes M. Wiesner 4, Yao Li5, Xiao-Hong Zhu4, Wei Chen4, and Zhi-Pei Liang1,2
1Department of Electrical and Computer Engineering, University of Illinois at Urbana-Champaign, Urbana, IL, United States, 2Beckman Institute for Advanced Science and Technology, University of Illinois at Urbana-Champaign, Urbana, IL, United States, 3Imaging Institute, Cleveland Clinic, Cleveland, OH, United States, 4Center for Magnetic Resonance Research, University of Minnesota, Minneapolis, MN, United States, 5School of Biomedical Engineering, Shanghai Jiao Tong University, Shanghai, China
A rapid, high-resolution,
non-water-suppressed MRSI technique was developed at 7T. Using the SPICE
framework, the new technique can
simultaneously obtain metabolite maps at 3.0×3.0×3.0 mm3 resolution
and water signals at 1.0×1.0×3.0 mm3 resolution in an 8 min scan
with high fidelity.
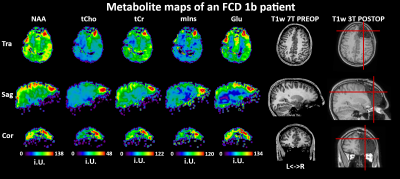
Figure 4. Representative metabolite maps (NAA, Cr, Cho) and
spatially localized spectra obtained from a healthy subject using SPICE. High-quality
spatiospectral distributions of various brain metabolites were obtained.
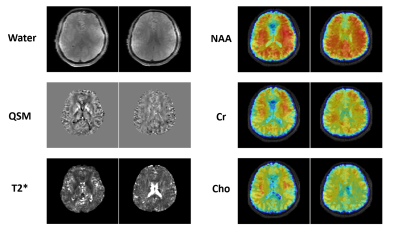
Figure
5. Simultaneously obtained water image, QSM map, T2* map at
1.0×1.0×3.0 mm3 nominal resolution and metabolite maps of NAA, Cr
and Cho from two representative traverse images at 3.0×3.0×3.0 mm3 nominal
resolution from a healthy subject in a single 8-min scan using SPICE.
-
GABA Inhibition Enhances in Epilepsy Associated with Focal Cortical Dysplasia
Tao Gong1, Yufan Chen1, Liangjie Lin2, Youting Lin3, and Guangbin Wang1
1Shandong Medical Imaging Research Institute, Shandong University, Jinan, China, 2Philips Healthcare, Beijing, China, 3Departments of Neurology, Shandong Provincial Hospital Affiliated to Shandong University, Jinan, China
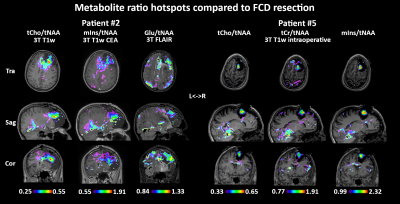
The results of this study indicated that GABAergic inhibition
enhanced in FCD foci of epilepsy patients, while no significant alteration of
GSH and Glx levels was found, suggesting GABA may
play a central role in the pathophysiology of FCD-associated epilepsy.
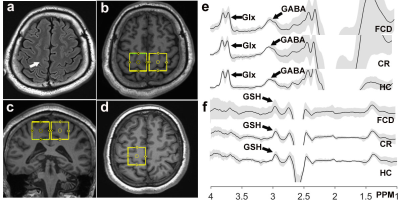
Figure
1.
T2-FLAIR image (a) of an FCD (white arrow) -associated epilepsy patient, the
volumes of interest of HERMES in the patient (b and c) and in a matched healthy
control (d). The mean (± standard deviation) GABA (e), Glx (e) and GSH (f)
-edited spectra from the HERMES sequence in FCD foci, contralateral regions and
healthy controls.
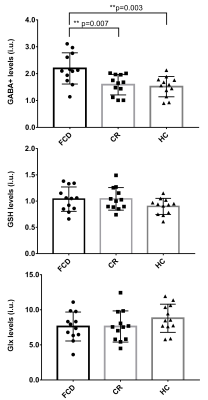
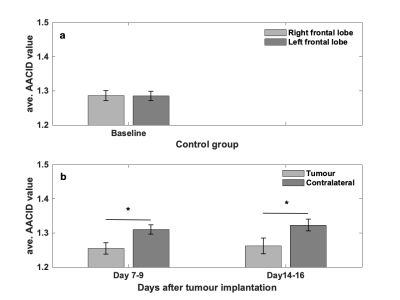
Figure 2. Comparation of GABA, GSH and Glx
levels between the FCD foci, contralateral regions and healthy controls using
ANOVA, and the results indicated that GABA levels was
significantly increased in FCD foci compared with contralateral regions
(p=0.007) and with healthy controls (p=0.003).
-
Multimodal 1H-MRSI and 18F-FDG-PET in Temporal Lobe Epilepsy
Lihong Tang1, Hui Huang1, Miao Zhang2, Yibo Zhao3,4, Rong Guo3,4, Yudu Li3,4, Zhi-Pei Liang3,4, Wei Liu5, Yao Li1, Biao Li2, and Jie Luo1
1School of Biomedical Engineering, Shanghai Jiao Tong University, Shanghai, China, 2Department of Nuclear Medicine, Ruijin Hospital, Shanghai Jiao Tong University School of Medicine, Shanghai, China, 3Department of Electrical and Computer Engineering, University of Illinois at Urbana Champaign, Urbana, IL, United States, 4Beckman Institute for Advanced Sciences and Technology, University of Illinois at Urbana Champaign, Urbana, IL, United States, 5Department of Neurosurgery, Ruijin Hospital, Shanghai Jiao Tong University School of Medicine, Shanghai, China
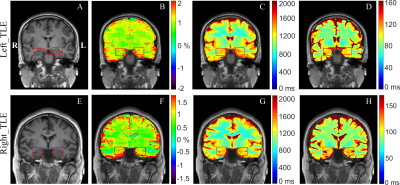
Simultaneous high-resolution 1H-MRSI (2.0 x 3.0 x 3.0 mm3), MWF map, QSM map, and 18F-FDG-PET offer complementary information in subcortical, cortical and white matter regions for drug-resistant TLE patients, demonstrating potential for lateralization of epileptogenic zone.
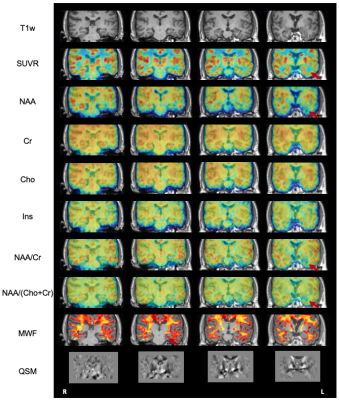
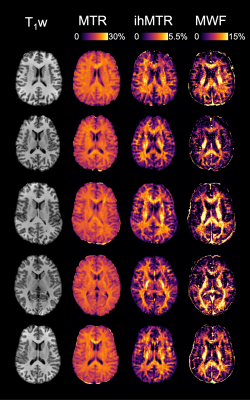
Figure 1. The coronal view high-resolution multimodal imaging of patient #3, including T1w-MPRAGE, PET-SUVR, NAA, Cr, Cho, Ins, NAA/Cr, NAA/(Cho+Cr), MWF, and QSM maps. Red arrows point to the ipsilateral temporal lobe.
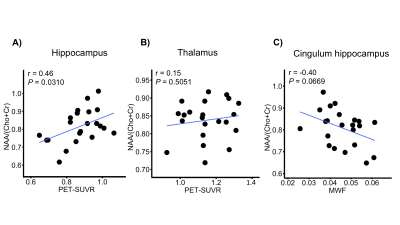
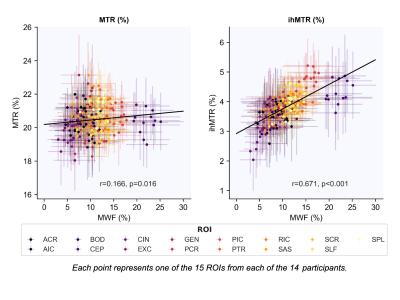
Figure 4. Relationships between A) NAA/(Cho+Cr) and PET-SUVR in hippocampus; B) NAA/(Cho+Cr) and PET-SUVR in thalamus; C) NAA/(Cho+Cr) and MWF in cingulum hippocampus. P and r values are results of Pearson’s correlation.
-
Dopamine Directional Circuits Detected by Metabolic Effective Connectivity and Granger Causality using Integrated PET/MR
Lei Wang1, Longxiao Wei1, and Menghui Yuan1
1Nuclear Medicine, Tangdu Hospital of Air Force Medical University, Xi'an, China
Metabolic effective connection method based on integrated PET/MR technology gives more consistent directional pathways than granger causality. Metabolic effective connection is more suitable for region-wise study.
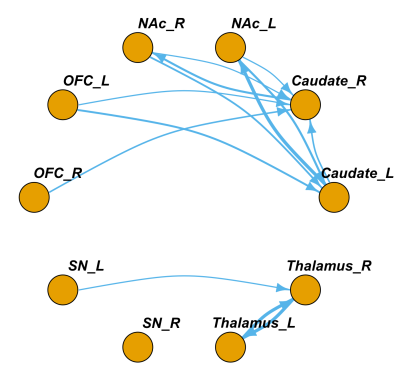
Fig3. The group-wise directional pathways identified by Metabolic effective connection(MEC) method. Arrows represent the direction of the pathways. The line thickness represents the relative strength of the MEC. There were more bidirectional interactions between NAc and caudate, and the unidirectional pathway from OFC to caudate revealed the regulation in frontostriatal dopamine pathway. (One-sample t-test, p<0.05, fdr correted)
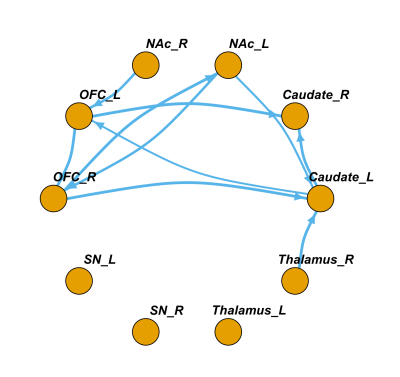
Fig2. The group-wise directional network identified by Granger causality. Arrows represent the direction of the pathways. The line thickness represents the relative strength of the granger causality index of that pathway. The SN and thalamus were almost isolated from other nucleus and cortex. Bidirectional connection were identified between the right OFC and left NAc. (One-sample Wilcoxcon signed rank test, p<0.05, fdr corrected)
-
Simultaneous 3D 1H-MRSI and PET Imaging Associates Neurometabolism with Beta-amyloid Aggregation in Alzheimer's Disease
Jialin Hu1, Miao Zhang2, Yaoyu Zhang1, Rong Guo3,4, Yudu Li3,4, Yibo Zhao3,4, Ziyu Meng1, Biao Li2, Jun Liu5, Binyin Li5, Jie Luo1, Chao Ma6, Georges El Fakhri6, Zhi-Pei Liang3,4, and Yao Li1
1School of Biomedical Engineering, Shanghai Jiao Tong University, Shanghai, China, 2Department of Nuclear Medicine, Ruijin Hospital, Shanghai Jiao Tong University School of Medicine, Shanghai, China, 3Beckman Institute for Advanced Science and Technology, University of Illinois at Urbana-Champaign, Urbana, IL, United States, 4Department of Electrical and Computer Engineering, University of Illinois at Urbana-Champaign, Urbana, IL, United States, 5Department of Neurology and Institute of Neurology, Ruijin Hospital, Shanghai Jiao Tong University School of Medicine, Shanghai, China, 6Gordon Center for Medical Imaging, Massachusetts General Hospital, Harvard Medical School, Boston, MA, United States
We used simultaneous 3D MRSI and PET imaging to
investigate association of
neurometabolism with Aβ aggregation in
HC, MCI and AD patients. Increase in mI and decrease in NAA were found as
dementia severity increased.
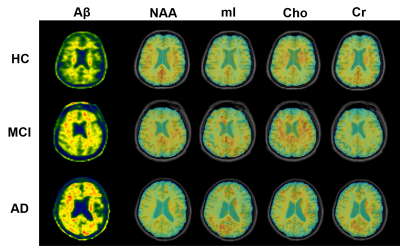
Figure 1. High-resolution metabolite maps and
PET images simultaneously acquired from a HC, an MCI patient, and an AD patient,
respectively. A global NAA reduction and mI elevation were observed with the
increased dementia severity.
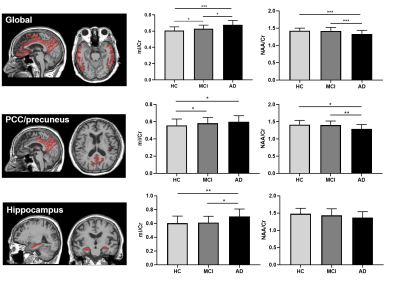
Figure 3. Comparisons of neurometabolic concentrations
among the HC, MCI, and AD groups for the global composite regions (top),
PCC/precuneus (middle) and hippocampus (bottom). * p<0.05, ** p<0.01, ***
p<0.001.
-
Non-invasive assessment of glycolytic and oxidative metabolism in mouse glioma using DGE 2H-MRS
Rui Vasco Simoes1, Rafael N Henriques1, Beatriz M Cardoso1, Francisca F Fernandes1, Jonas L Olesen2, Sune N Jespersen2, and Noam Shemesh1
1Champalimaud Research, Champalimaud Foundation, Lisbon, Portugal, 2Center of Functionally Integrative Neuroscience (CFIN) and MINDLab, Department of Clinical Medicine, Aarhus University, Aarhus, Denmark
Glycolytic and oxidative turnover rates of glucose can be
measured in mouse gliomas with DGE-2H-MRS. MP-PCA denoising improves
the time-course detection and quantification of glucose oxidation, which in
turn demonstrates correlation with MRI features of heterogeneity in
the tumor region.
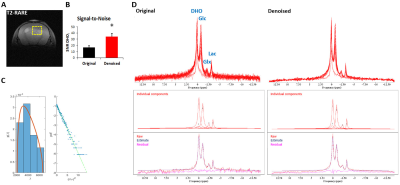
Figure 2 – Improvement of DGE 2H-MRS spectral quality upon MP-PCA
denoising. GL7: (A) T2-RARE showing the tumor region
selected for DGE 2H-MRS (yellow dashed line); (B) SNRDHOi
before and after denoising (average±SD); (C) left – eigenvalue spectrum from PCA decomposition (blue) and fit of MP distribution (orange), right – Gaussian distribution of denoising
residuals, verified by the linearity of their logarithm; (D) DGE 2H-MRS
data stacked, original and denoised, and spectral fitting including individual components, raw data,
estimate and residual. * p=0.0003, paired t-Test.
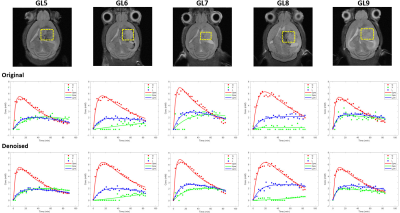
Figure 3 – Robustness of the kinetic
model for different tumors and improvement of Glx fitting with MP-PCA denoising. Tumor volumes selected for DGE 2H-MRS
(yellow dashed line) overlaid on reference T2-RARE transversal images for each
animal (GL5-9, top). Fitting of Glc (red line), Glx (green line) and Lac (blue
line) time-course changes displayed, before (center) and after denoising
(bottom).
-
1H-MRS of Primary Progressive and Relapsing-Remitting Multiple Sclerosis in brain white matter compared to healthy controls
Bretta Russell-Schulz1, Jasmyne Kassam2, Michael Waine2, Erin L MacMillan1,3,4, Irene Vavasour1, Helen Cross2, Anthony Traboulsee2, Robert Carruthers2, and Shannon Kolind2,5,6
1Radiology, UBC MRI Research Centre, Vancouver, BC, Canada, 2Medicine, University of British Columbia, Vancouver, BC, Canada, 3Philips Healthcare Canada, Markham, ON, Canada, 4Simon Fraser University's ImageTech Lab, Surrey, BC, Canada, 5Physics & Astronomy, University of British Columbia, Vancouver, BC, Canada, 6Radiology, University of British Columbia, Vancouver, BC, Canada
This study establishes pre-treatment baseline metabolite concentrations for a longitudinal clinical trial for RRMS and PPMS using 1H-MRS. The high MRS data quality and similar in FWHM across all participants creates a strong baseline for detecting change over time.
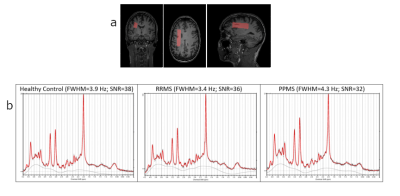
Figure 2a - Sample volume of interest (65x15x20mm3)
in white matter region on MPRAGE ‘anatomical’ scan for healthy control.
b - Sample spectrum output from LCModel for each participant group with fit quality measures.
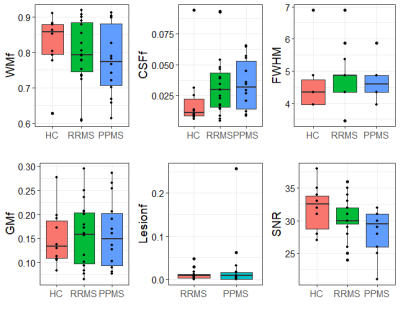
Figure 4 - Tissue content within VOI separated by subject
group and measures of spectrum fit quality (Full-Width-Half-Maximum, FWHM and
Signal-to-Noise Ratio, SNR); FWHM and SNR. Where WMf, GMf, CSFf and Lesionf,
are fraction of white matter, grey matter, cerebrospinal fluid and lesional
tissue, respectively.
-
Evaluation of the agreement of metabolite levels between PRESS and MEGA-PRESS techniques in the grading of glioma patients
Gerd Melkus1,2, Michael Taccone3,4, Ioana D Moldovan4,5, John Woulfe3,5,6, Gerard Jansen3,7, Ian Cameron1,2, Fahad AlKherayf3,4,5, and Thanh Binh Nguyen1,2
1Medical Imaging, The Ottawa Hospital, Ottawa, ON, Canada, 2Radiology, University of Ottawa, Ottawa, ON, Canada, 3University of Ottawa, Ottawa, ON, Canada, 4Division of Neurosurgery, The Ottawa Hospital, Ottawa, ON, Canada, 5The Ottawa Hospital Research Institute, Ottawa, ON, Canada, 6Division of Neurology, University of Ottawa, Ottawa, ON, Canada, 7Department of Pathology and Laboratory Medicine, The Ottawa Hospital, Ottawa, ON, Canada
T2 corrected
metabolite levels of NAA, Cho and Cr obtained from the edit off spectrum of the
MEGA-PRESS sequence are in good agreement with those obtained from a standard long TE PRESS
sequence. No significant difference in the diagnostic accuracy was found.
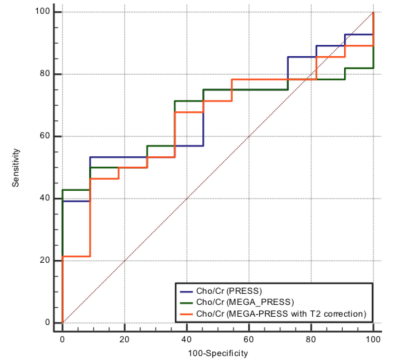
Figure 4. Diagnostic
accuracy of the Cho/Cr ratio in the differentiation between high grade and low
grade gliomas.
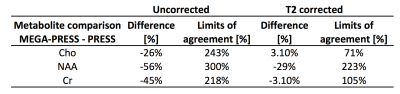
Figure 1. Comparison of metabolite levels obtained from PRESS and
edit-off spectrum using Bland-Altman analysis.
-
Quantification of neurobiological responses in the hippocampus: Towards in vivo neurochemical profiling of cuprizone-induced demyelination
Do-Wan Lee1, Yeon Ji Chae2, Monica Young Choi2, Jae-Im Kwon3, Joongkee Min3, Chul‐Woong Woo3, Hwon Heo2, Dong‐Cheol Woo2,3, Jeong Kon Kim1, Kyung Won Kim1, Hyo Jeong Chin4, and Dong‐Hoon Lee4
1Department of Radiology, Asan Medical Center, University of Ulsan College of Medicine, Seoul, Korea, Republic of, 2Department of Convergence Medicine, Asan Medical Center, University of Ulsan College of Medicine, Seoul, Korea, Republic of, 3Convergence Medicine Research Center, Asan Institute for Life Sciences, Asan Medical Center, Seoul, Korea, Republic of, 4Department of Radiological Science, College of Health Sciences, Yonsei University, Wonju, Korea, Republic of
The present study demonstrates how axonal demyelination affects cerebral
metabolites in the gray matter of the hippocampal region, quantified using 7-T
proton MR spectra.
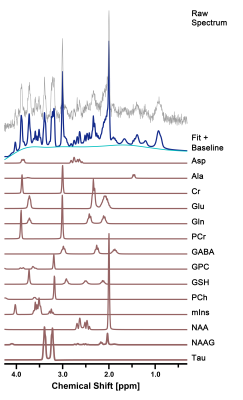
Figure 2. Representative
in vivo 1H MR spectra in the right hippocampus of cuprizone-treated
rats. The figure shows the raw spectrum (gray), fitted spectrum (navy),
baseline (light blue), and 14 individual metabolite fits below (brown).
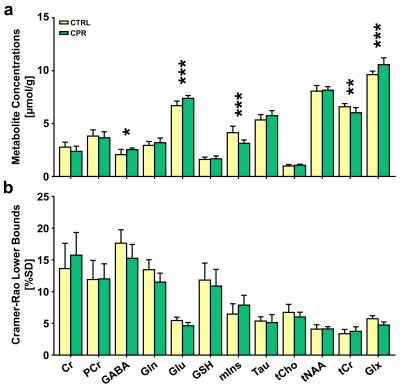
Figure 3. Bar graph indicating the mean cerebral
metabolite concentrations (a) and Cramer-Rao lower bounds (CRLBs) (b) in the
right hippocampal region in control (CTRL) and cuprizone-treated (CPR) rats,
quantified using the Linear Combination of Models software. The vertical lines
on each of the bars indicate the (+) standard deviation of the mean values. *p
< 0.05; **p < 0.01; ***p < 0.005.
-
Simultaneous Myelin Water Imaging and 3D 1H-MRSI Relates Myelin Degradation to Neurometabolic Changes in Mild Traumatic Brain Injury Patients
Tianyao Wang1, Danni Wang2, Yujie Hu2, Rong Guo3,4, Yudu Li3,4, Yibo Zhao3,4, Jun Liu5, Zhi-Pei Liang3,4, and Yao Li2
1Radiology Department, Shanghai Fifth People's Hospital, Fudan University, Shanghai, China, 2School of Biomedical Engineering, Shanghai Jiao Tong University, Shanghai, China, 3Department of Electrical and Computer Engineering, University of Illinois at Urbana-Champaign, Urbana, IL, United States, 4Beckman Institute for Advanced Science and Technology, University of Illinois at Urbana-Champaign, Urbana, IL, United States, 5Radiology Department, Tong Ren Hospital Shanghai Jiao Tong University School Medicine, Shanghai, China
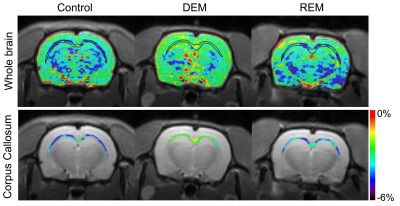
We investigated simultaneous myelin and neurometabolic alterations in acute mTBI patients. Our experimental results showed coupled myelin degradation and NAA reduction in the occipital corpus callosum.
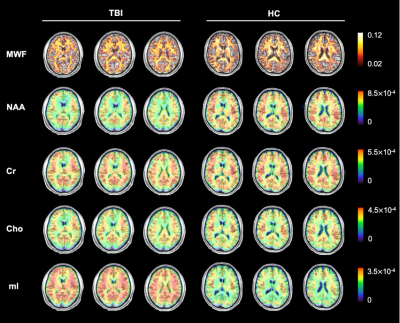
Figure 1. Reconstructed MWF and neurometabolites maps of an acute mTBI patient and a healthy control. The neurometabolites include NAA, Cr, Cho and mI. The FOV covers the whole brain (240x240x120 mm3) and the data acquisition takes 8 minutes.
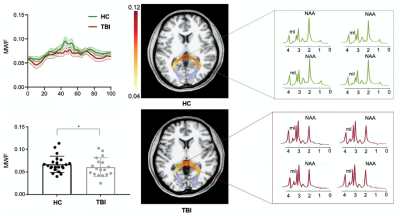
Figure 2. A reduction in MWF was observed in the occipital tract of acute mTBI patients group and the spatially resolved spectra revealed a reduction of NAA and increase of mI in the patient.
-
Biochemical and behavioral alterations in a ferret model of blast related mild traumatic brain injury
Shiyu Tang1,2, Su Xu1,2, Donna Wilder3, Joseph Long3, Venkata Siva Sai Sujith Sajja3,4, and Rao Gullapalli1,2
1Department of Diagnostic Radiology and Nuclear Medicine, University of Maryland School of Medicine, Baltimore, MD, United States, 2Center for Advanced Imaging Research (CAIR), University of Maryland School of Medicine, Baltimore, MD, United States, 3Blast Induced Neurotrauma Branch, Walter Reed Army Institute of Research, Silver Spring, MD, United States, 4The Geneva Foundation, Tacoma, WA, United States
Metabolic changes using magnetic resonance spectroscopy and behavioral changes following blast injury were assessed. Metabolic changes in glutamate and taurine were observed concomitant increase in impulsivity at 1- and 3-months post blast TBI.
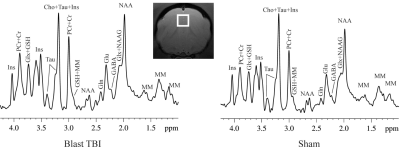
Figure 1. A demonstration
of
the
MRS
voxel
in
prefrontal
cortex
and
spectrums
of
a
blast
and
sham
ferret
at
3-day
post-blast.
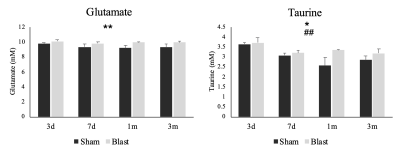
Figure 3. Glutamate
and
taurine
levels
in
prefrontal
cortex
in
sham
and
blast
exposed
ferret
from
3-day
to
3-month
post-blast.
*p<0.05,
**p<0.01, group main effect;
##p<0.01,
visit main effect.
-
Longitudinal Neurochemical Changes of Riluzole Therapy in Post-Traumatic Stress Disorder
Sam H. Jiang1, David M. Benedek2, Patricia Spangler2, James West2, Catherine L. Dempsey2, Ashley Phares2, Brian Andrews-Shigaki3, Eduardo Coello1, and Alexander P. Lin1
1Center for Clinical Spectroscopy, Brigham and Women's Hospital and Harvard Medical School, Boston, MA, United States, 2Uniformed Services University of the Health Sciences, Bethesda, MD, United States, 3Office of Naval Research, United States Navy and Marine Corps, Alexandria, VA, United States
The addition of riluzole to ongoing selective serotonin reuptake inhibitor therapy for combat-related post-traumatic stress disorder modulated glutamate-glutamine cycling, improved neural energetics, and induced cholinergic changes indicative of neuroprotective inflammation.
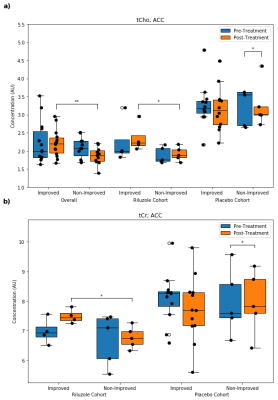
Figure 3. Distributions of anterior cingulate cortex (ACC) a) phosphocholine + glycerophosphocholine (tCho) in the overall, riluzole, and placebo cohorts, and b) creatine + phosphocreatine (tCr) in the riluzole and placebo cohorts (* = p < 0.05, ** = p < 0.01).
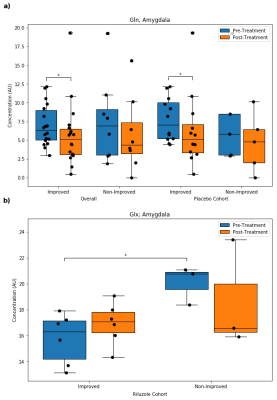
Figure 4. Distributions of amygdala a) glutamine (Gln) in the overall and placebo cohorts, and b) glutamate + glutamine (Glx) in the riluzole cohort (* = p < 0.05).
-
Temporal correlation of functional connectivity and Choline in the monkey brain following ischemic stroke
Chun-Xia Li1, Frank Tong2, Doty Kempf1, Leonard Howell1, and Xiaodong Zhang1
1Yerkes Imaging Center, Yerkes National Primate Research Center, Emory University, Atlanta, GA, United States, 2Department of Radiology, Emory University, Atlanta, GA, United States
Previous studies have
suggested cerebral
Choline (Cho) is a sensitive marker of acute stroke and
could protect the tissue from ischemic injury. Also the relative connectivity (RelCon) could be a
robust index to reveal the functional connectivity
changes using resting state fMRI
(rs-fMRI). The results indicated progressively increased
RelCon in
secondary somatosensory cortex (RelCon-S2)
and a significant positive correlation between RelCon-S2 and relative cerebral
Choline level (RelCho) from hyper-acute phase to 96 hours post stroke. The
RelCon and RelCho combined detection might be an optimized and promising approach in management and prediction
of stroke recovery.
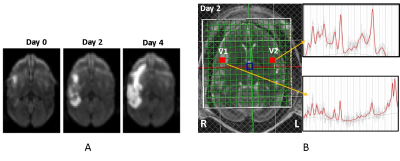
Figure 1. A) The diffusion-weighted images of a
stroke monkey brain demonstrated infarct
evolution on Day 0, 2, and 4 post
stroke (left). B) in vivo proton MR
spectra in the contralateral and ipsilateral voxels in the stroke monkey brain
2 days post stroke. V1, MR Spectrum of
contralateral voxel; V2, MR spectrum of ipsilateral area after MCA occlusion.
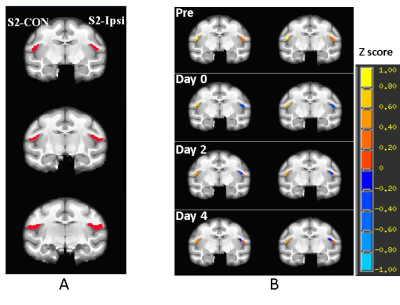
Figure 2. A) Illustration of the representative
slices of a stroke monkey brain with regions of interest of contralateral
secondary somatosensory cortex (S2)(S2-CON, seed for functional
connectivity analysis)
and the ipsilateral S2 (S2-Ipsi). B) representative correlation map of
S2 in a stroke monkey brain before stroke surgery
(Pre) and post surgery. p = 0.026 with 20 voxels as threshold.
-
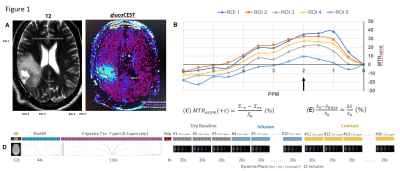
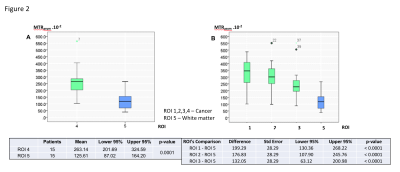
Standard Frame of Reference for the Identification of Metabolic Phenotypes of Brain Tumors using Single Voxel MR Spectroscopy
Eduardo Coello1, Victoria Sanchez1, Marcia Louis1, Huijun Liao1, Sam Jiang1, Wufan Zhao1, Katherine M. Breedlove1, Raymond Huang1, and Alexander Lin1
1Radiology, Brigham and Women's Hospital, Boston, MA, United States
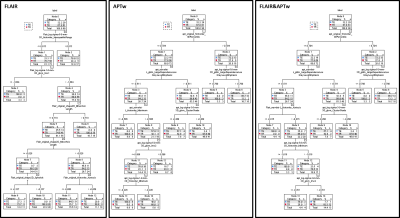
A method for the robust classification of MRS samples was developed. The model was able to correctly classify samples between tumor vs. non-tumor voxels, and IDH vs. non-IDH tumors.
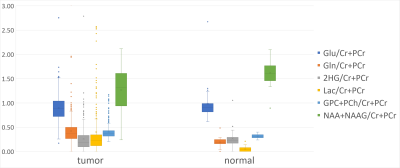
Fig. 2. Distribution of the quantified metabolite ratios in the analyzed datasets. The plot shows the variability of tumor tissue samples in comparison to the normal-appearing tissue.
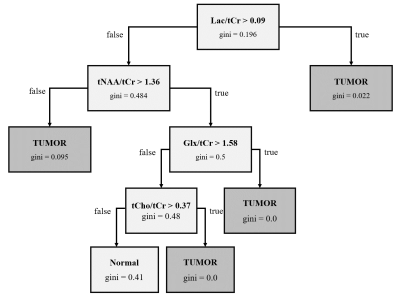
Fig.
4. Decision tree for the classification of tumor samples in normal-appearing
tissue (normal) and tumor tissue.
-
GABA and Susceptibility Changes in Striatum in Liver Cirrhosis: Preliminary Results
Gasper Zupan1,2, Sebastian Stefanovic3, Marjana Turk Jerovsek3, Borut Stabuc3, Georg Oeltzschner4,5, Stefan Ropele6, Dusan Suput1, and Andrej Vovk1
1Faculty of Medicine, University of Ljubljana, Ljubljana, Slovenia, 2Institute of Radiology, University Medical Center Ljubljana, Ljubljana, Slovenia, 3Department of Gastroenterology and Hepatology, University Medical Center Ljubljana, Ljubljana, Slovenia, 4Russell H. Morgan Department of Radiology and Radiological Sciences, The John Hopkins University School of Medicine, Baltimore, MD, United States, 5M. Kirby Research Center for Functional Brain Imaging, Kennedy Krieger Institute, Baltimore, MD, United States, 6Department of Neurology, Neuroimaging Research Unit, Medical University of Graz, Graz, Austria
Liver cirrhosis in a systemic disease that affects brain as well. Using advanced MR methods, we demonstrated decreased striatal GABA levels, decreased susceptibility in caudate nucleus and increased susceptibility in putamen in patients with liver cirrhosis compared to healthy controls.
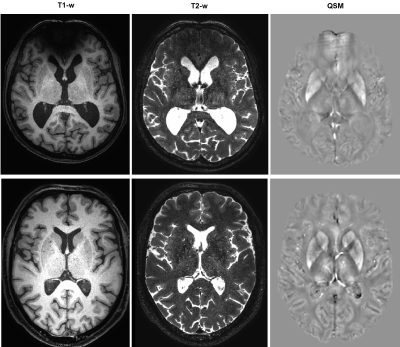
Figure
4: Exemplary T1-, T2-weighted MR images and corresponding QSM (Quantitative Susceptibility
Maps) of a LC patient (upper row) and a healthy control (lower row).
Figure
2: Exemplary spectra of two LC pacients and a healthy control.
-
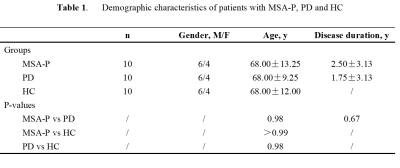
Upper brainstem GABA levels in Parkinson’s disease
Yulu Song1, Tao Gong1, Muhammad G. Saleh2,3, Mark Mikkelsen2,3, Guangbin Wang 1, and Richard Edden2,3
1Shandong Medical Imaging Research Institute, Shandong University, jinan, China, 2Russell H. Morgan Department of Radiology and Radiological Science, The Johns Hopkins University School of Medicine, baltimore, MD, United States, 3FM Kirby Center for Functional Brain Imaging, Kennedy Krieger Institute, baltimore, MD, United States
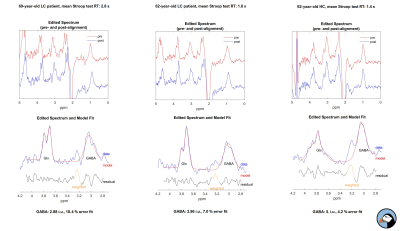
We confirmed the hypothesis that a significant reduction
in the GABA+ levels in the upper brainstem regions of patients with PD compared
with the HCs.
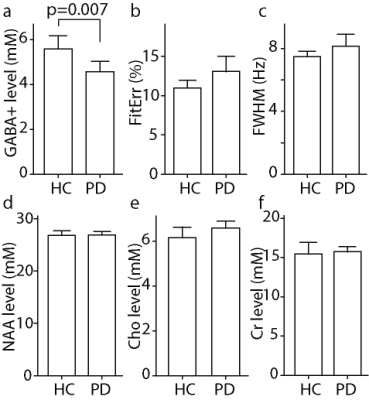
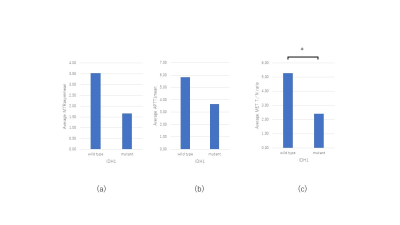
Bar Charts of
the distributions of GABA+ levels, normalized fitting errors, linewidth in Hz,
NAA, Cr, Cho levels
PD Parkinson’s disease, HC
healthy control, NAA N-acetyl aspartate, Cr creatine, Cho choline
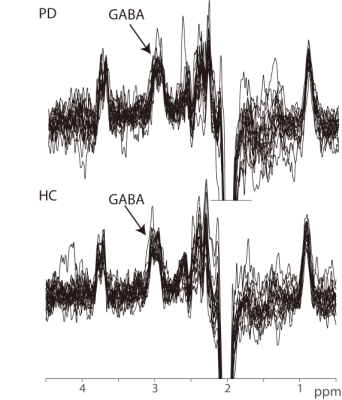
GABA+-edited
spectra in the upper brainstem of all 36 participants, showing the intended
signal at 3 ppm
-
In vivo detection of GSH in the mouse brain using MEGA-PRESS at 9.4T
David Jing Ma1, Sabrina Gjerswold-Selleck2, Yanping Sun3, Matt Mattingly Mattingly4, and Jia Guo5
1Biomedical Engineering, Columbia University, New York, NY, United States, 2Columbia University, New York, NY, United States, 3Herbert Irving Comprehensive Cancer Centre, Columbia University, New York, NY, United States, 4Bruker BioSpin, Billerica, MA, United States, 5Department of Psychiatry, Columbia University, New York, NY, United States
MEGA-PRESS is a feasible technique to measure GSH in the mouse brain in vivo at 9.4T.
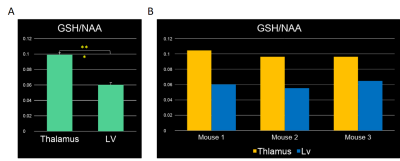
Figure 4: Graphical representation of the GSH content in different brain regions. [A] Bar graphs of GSH/NAA at the thalamus and at the lateral ventricle with Student's t‐test result. It can be seen that there is a significantly less GSH/NAA content in the region around the lateral ventricle compared to the thalamus. [B] Bar graphs of GSH/NAA for the thalamus and lateral ventricular for each individual mouse. It can be seen that thalamus has significantly greater GSH/NAA than the lateral ventricle.
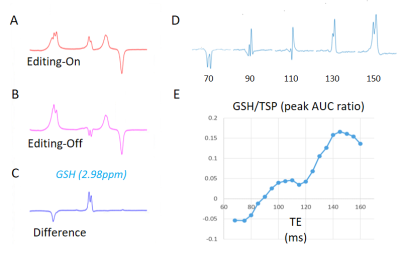
Figure 2: GSH detection in the phantom solution with J-edited 1H MRS. Figure indicates single-voxel spectra of the 30 mM GSH phosphate buffer solution (PBS) acquired at 37 ºC in 4 min. [A] ‘ON’ Spectra with editing pulse applied at 4.56 ppm. [B] ‘OFF’ spectra with editing pulse applied at 8 ppm. [C] Difference spectra between [A] and [B] showing edited GSH resonance at 2.98 ppm. [D] GSH peak graphs at the following TE: 68, 90, 110, 130 and 150. [E] Plot of the GSH peak area under the curve versus TE.
-
Reproducibility of metabolite measurements in the preterm brain using magnetic resonance spectroscopy
Subechhya Pradhan1,2,3, Sudeepta Basu4, Kushal Kapse1, Devon Fisher1, Stephanie Norman1, and Catherine Limperopoulos1,2,3
1Developing Brain Institute, Children's National Hospital, Washington, DC, United States, 2Radiology, Pediatrics, George Washinton University, Washington, DC, United States, 3Radiology and Diagnostic Imaging, Children's National Hospital, Washington, DC, United States, 4Neonatalogy, Children's National Hospital, Washington, DC, United States
Evaluation of reproducibility of metabolite measurements in the preterm infants using 4 MRS pulse sequences/ parameters showed good reproducibility for the largest number of metabolites using MEGA-PRESS sequence at TE = 68 ms and editing pulses at 1.9 and 7.8 ppm.
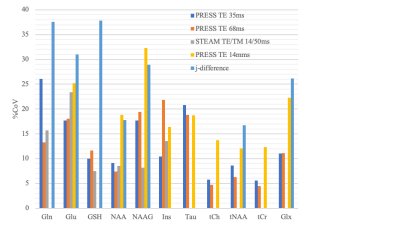
Figure 2. Bar graph showing coefficient of variations for different metabolites measurements made using different pulse sequences
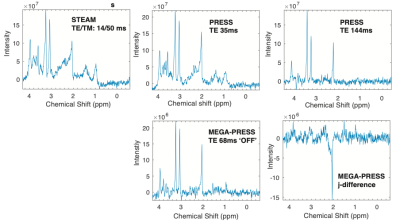
Figure 1. Representative spectra showing spectra acquired from right basal ganglia using different pulse sequences.
-
Quantitative measurement of changes in 23Na MRI following transcranial direct current stimulation (tDCS) of the motor cortex
Iris Asllani1,2, Francesco Di Lorenzo1, Balazs Orzsik1, Guillaume Madelin3, Neil Harrison4, and Mara Cercignani1
1University of Sussex, Brighton, United Kingdom, 2Rochester Institute of Technology, Rochester, NY, United States, 3New York University, New York, NY, United States, 4University of Cardiff, Cardiff, United Kingdom
- Anodal tDCS of M1 was associated with an increase in gray matter sodium concentration [Na]GM in the stimulated area measured using partial volume corrected 23MRI.
- Subjects exhibited a widespread pattern of increased [Na]GM.
- There were no changes in [Na]GM associated with sham tDCS.
-

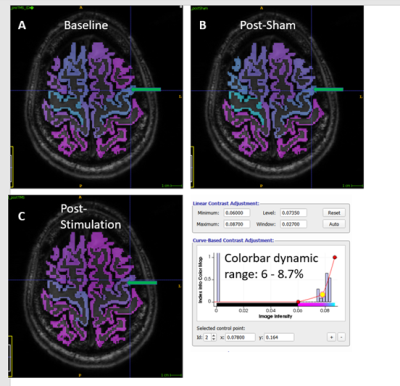
Fig.3: Areas in GM that survived the Δ%[NA] > 10% are shown for 2 randomly selected subjects. The arrows point to the "blob" that was identified under the marker on the MPRAGE (as demonstrated in Fig.1). The widespread pattern of Δ%[NA] was similar across the group.
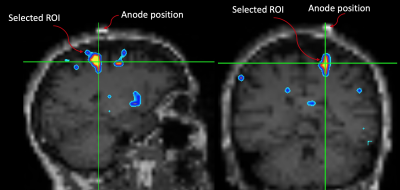
Fig.1: The motor ROI was selected by overlapping the GM Δ%[NA] image onto the subject's down-sampled MPRAGE. A MatLab script was written to identify "blobs" where Δ%[NA] > 10%. The script yields a blob ID number which is then used to extract the motor ROI for further analyses. Note the spatial relationship between the marker and the ROI.
-
Non-Invasive Brain Metabolic and Cytometric Imaging: Insights from Activity MRI [aMRI]
Charles S. Springer1, Brendan Moloney1, Eric Baker1, Martin M. Pike1, and Xin Li1
1Advanced Imaging Research Center, Oregon Health & Science University, Portland, OR, United States
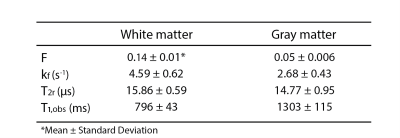
A map of awake, resting human brain homeostatic metabolic activity is shown for the first time. Sodium Pump enzymatic turnover [fmol(ATP)consumed/s/cell] is particularly high in brain white matter. This may have significant implications.
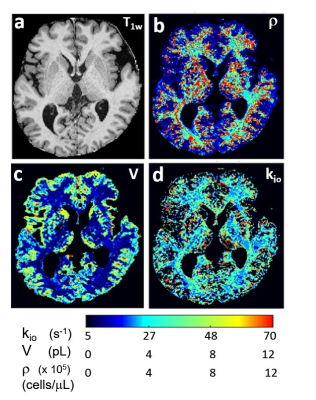
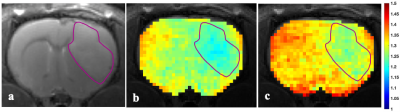
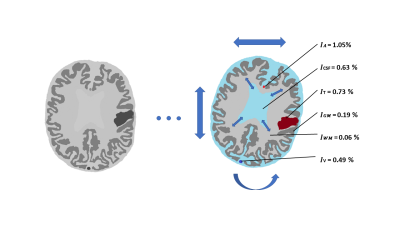
Figure 1. The first aMRI maps of an axial image slice of the awake, healthy resting human brain. Panel (a) is the T1-weighted image. Panel (b) maps the cell density, r (cells/μL). Panel (c) maps the average cell volume, V (pL). Panel (d) maps the cellular water efflux rate constant, kio (s-1), reflecting cytoplasmic Sodium Pump enzymatic turnover. Note the particularly large kio values in white matter [panel (d)].