-
Evaluation of a spectroscopy sequence using polychromatic refocusing to suppress J-modulation and measure lactate diffusion in the rodent brain
Sophie Malaquin1, Eloïse Mougel1, Melissa Vincent1, and Julien Valette1
1Université Paris-Saclay, Commissariat à l'Energie Atomique et aux Energies Alternatives (CEA), Centre National de la Recherche Scientifique (CNRS), Molecular Imaging Research Center (MIRCen), Laboratoire des Maladies Neurodégénératives, Fontenay aux Roses, France
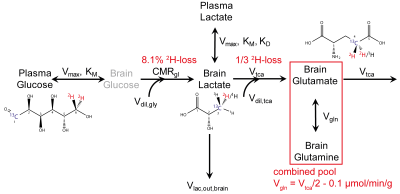
In an effort to optimize lactate detection in diffusion-weighted
NMR spectroscopy, we compare different sequences including a spin echo sequence
using polychromatic pulse to suppress the J-coupling. This sequence results in
stronger lactate signal and more precise diffusion measurements.
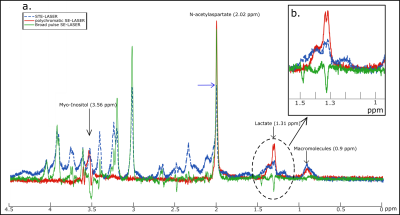
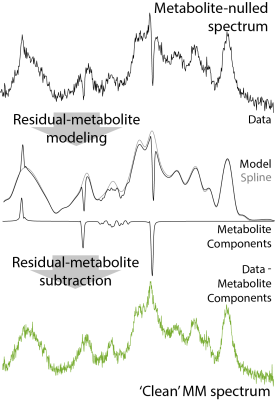
Figure 2: a. Spectra without
diffusion-weighting obtained with the STE-LASER sequence (blue dotted line),
the broad pulse SE-LASER sequence (green line) and the polychromatic SE-LASER
sequence (red line). b. The gain of lactate signal is spectacular when using
the polychromatic SE-LASER sequence.
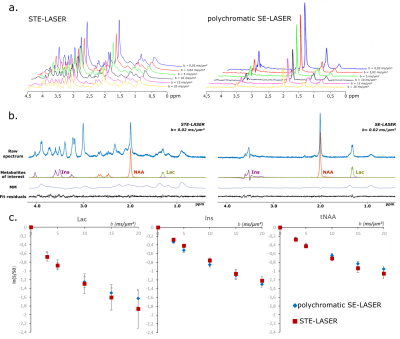
Figure 3: STE-LASER and
polychromatic SE-LASER data at high diffusion-weighting in WT mice. a. Spectra
acquired up to high diffusion-weighting (from b = 0.02 ms/µm² to 20 ms/µm²)
with the STE-LASER sequence (left) and the polychromatic SE-LASER sequence
(right).
b. LCModel analysis for
metabolites of interest. Macromolecules contribution on 1.31 ppm lactate peak
is noticeable.
c. Signal attenuation as a
function of b for three metabolites by using the two sequences (blue diamonds =
polychromatic SE-LASER, red squares = STE-LASER). Data points and error bars
stand for mean ± s.d.
-
In Vivo J-difference Editing of (Phosphoryl)ethanolamine
Muhammad G Saleh1, Steve Hui2, Helge Zöllner2, and Richard A Edden2
1University of Maryland School of Medicine, Baltimore, MD, United States, 2The Johns Hopkins University School of Medicine, Baltimore, MD, United States
MEGA-PRESS editing of Phosphorylethanolamine/ethanolamine was successfully demonstrated at both 3.22 and 3.98 ppm. In vivo experiments show that the 3.22 ppm signal is better resolved and yield reproducible quantification.
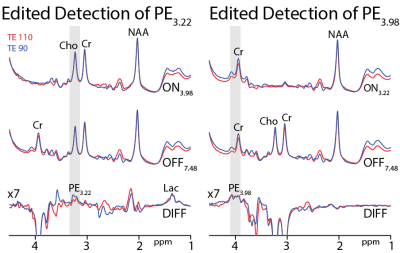
Figure 2: In vivo MEGA-PRESS experiments at TE 90 and 110 ms for editing the PE3.22 (left) and PE3.98 (right). NAA: N-acetylaspartate; Lac: lactate; Cho: choline; and Cr: creatine.
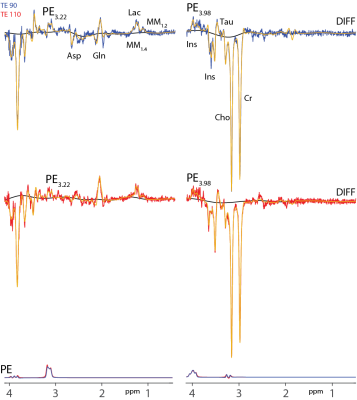
Figure 3: Linear-combination modeling of PE3.22 and PE3.98 difference spectra with complete fit (yellow), spline baseline (black), and PE estimates at both TEs 90 ms (blue) and 110 ms (red). Asp: aspartate, Cho: choline, Cr: creatine, Gln: glutamine, Ins: myo-Inositol, Lac: lactate, MM: macromolecules, Tau: taurine.
-
Spectral quality of J-refocused spectroscopic imaging at 7T
Jullie W Pan1, Victor W Yushmanov2, Chan H Moon3, Brian Soher4, Frank H Lieberman5, and Hoby P Hetherington2
1Radiology, University of Pittsburgh, Pittsburgh, PA, United States, 2university of pittsburgh, pittsburgh, PA, United States, 3University of Pittsburgh, Pittsburgh, PA, United States, 4Radiiology, Duke University, Durham, NC, United States, 5Neurology, University of Pittsburgh, Pittsburgh, PA, United States
Spectral quality of fast 7T MR spectroscopic imaging is evaluated for multiplet compounds including Glutamine, myo-Inositol, Choline and demonstrated in brain tumor patients
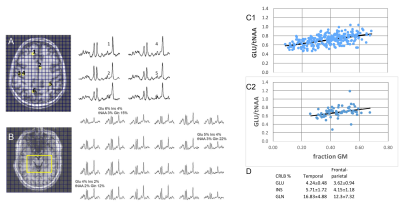
FIg. 2. (A,B) Spectral data from the frontal-parietal (A) and temporal (B) regions. CRLB % are shown for several loci in the temporal study. (C1,C2) The GLU/tNAA regresses significantly with fraction GM from both studied regions. (D) The CRLB % are shown for GLU, INS and GLN for the frontal-parietal and temporal regions.
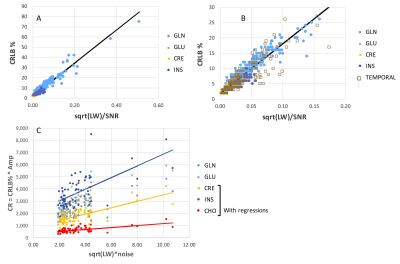
Fig. 3. (A) Regression of CRLB % with ξk=√LW/SNRk from the frontal-parietal region. (B) Same as (A) but with superimposed data from the temporal region, and magnified in X and Y axes. (C) Plots of CRk = CRLBk% * Ampk, with ξ0 =√LW*σ, with different compounds. The regressions for CRE, INS and CHO are shown.
-
Associations of tau aggregates and oxidative stress to apathy levels in progressive supranuclear palsy
Kiwamu Matsuoka1,2, Yuhei Takado1, Kenji Tagai1, Manabu Kubota3, Yasunori Sano1, Keisuke Takahata1, Maiko Ono1, Chie Seki1, Hideki Matsumoto1,4, Hironobu Endo1, Hitoshi Shinotoh1, Jamie Near5, Kazunori Kawamura1, Ming-Rong Zhang1, Hitoshi Shimada1, and Makoto Higuchi1
1National Institute of Radiological Sciences, National Institutes for Quantum and Radiological Science and Technology, Chiba, Japan, 2Department of Psychiatry, Nara Medical University, Kashihara, Japan, 3Department of Psychiatry, Kyoto University Graduate School of Medicine, Kyoto, Japan, 4Department of Oral and Maxillofacial Radiology, Tokyo Dental College, the city of Chiyoda-ku, Japan, 5Douglas Mental Health University Institute and Department of Psychiatry, McGill University, Montréal, QC, Canada
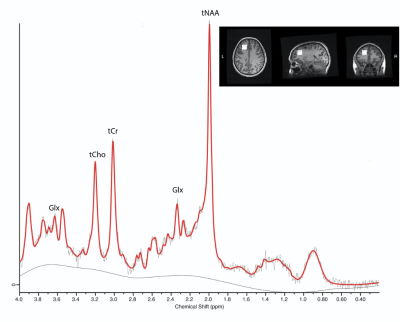
This multi-modal imaging study of tau aggregates
and antioxidant glutathione using tau PET and magnetic resonance
spectroscopy revealed associations of apathy
in progressive supranuclear palsy with tau aggregates and oxidative stress.
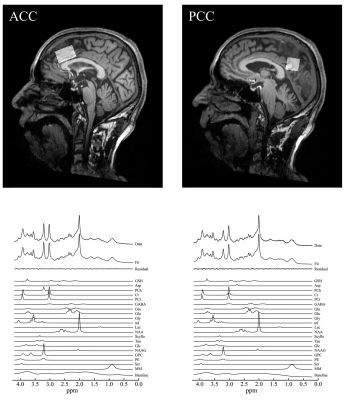
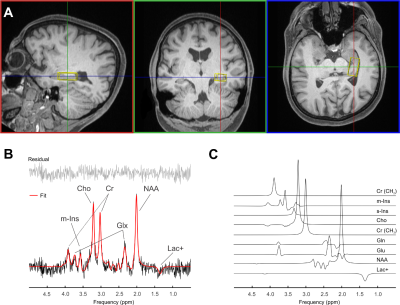
Representative
spectrum in the ACC and PCC. Volumes of interest of magnetic
resonance spectrum were placed at the ACC and PCC. A representative
MRS acquired with the SPECIAL sequence, the corresponding LCModel spectral fit,
fit residual, macromolecules (MM), baseline and individual metabolite fits
including GSH in the ACC and PCC.
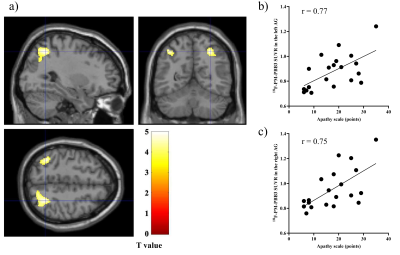
a) Sagittal,
coronal, and transverse brain views showed voxels with positive associations between apathy scale scores and 18F-PM-PBB3
SUVRs
in patients with PSP after controlling for the effects of age and PSPRS. b, c)
Scatterplots showing the association between apathy scale scores and 18F-PM-PBB3
SUVRs in the detected areas (AG).
-
Sleep-Wake Lactate Dynamics in Human Brain
Selda Yildiz1,2, Miranda M. Lim2,3,4,5,6, Manoj K. Sammi1,7, Katherine Powers1, Charles F. Murchison2,8, Jeffrey J. Iliff9,10,11,12,13, and William D. Rooney1,2,5,10
1Advanced Imaging Research Center, Oregon Health & Science University, Portland, OR, United States, 2Department of Neurology, Oregon Health & Science University, Portland, OR, United States, 3VA Portland Health Care System, Portland, OR, United States, 4Department of Medicine, Division of Pulmonary and Critical Care Medicine, Oregon Health & Science University, Portland, OR, United States, 5Department of Behavioral Neuroscience, Oregon Health & Science University, Portland, OR, United States, 6Oregon Institute of Occupational Health Sciences;, Oregon Health & Science University, Portland, OR, United States, 7BENFRA Botanical Dietary Supplements Research Center, Oregon Health & Science University, Portland, OR, United States, 8Department of Biostatistics, University of Alabama, Birmingham, AL, United States, 9Department of Anesthesiology and Perioperative Medicine, Oregon Health & Science University, Portland, OR, United States, 10Knight Cardiovascular Institute, Oregon Health & Science University, Portland, OR, United States, 11VISN 20 Mental Illness Research, Education and Clinical Center (MIRECC), VA Puget Sound Health Care System, Seattle, WA, United States, 12Department of Psychiatry and Behavioral Sciences, University of Washington, Seattle, WA, United States, 13Department of Neurology, University of Washington, Seattle, WA, United States
We present the first in-vivo demonstration of reductions in lactate levels and diffusivity during sleep versus wake in human brain. Findings, in consistent with invasive small-animal studies, support an altered lactate metabolism and/or increased glymphatics in sleeping human brain.
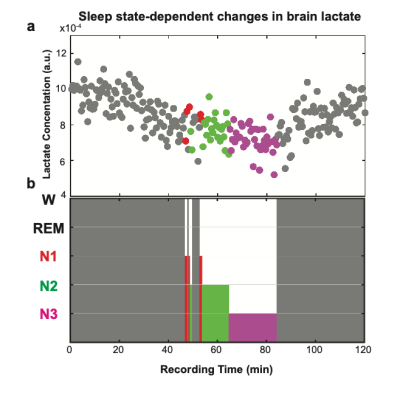
Figure 2. a) Subject 1: mean lactate concentration across sleep-wake cycles decline during sleep relative to wakefulness: 4.6 % in N1 (2.5 min), 12.0 % in N2 (12 min), and 18.0 % in N3. b) Representative sleep stages were visually scored for 30 s epochs and classified into: Wake (W), Non-REM sleep stage 1 (N1), Non-REM sleep stage 2 (N2), and Non-REM sleep stage 3 (N3).
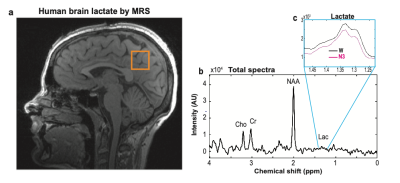
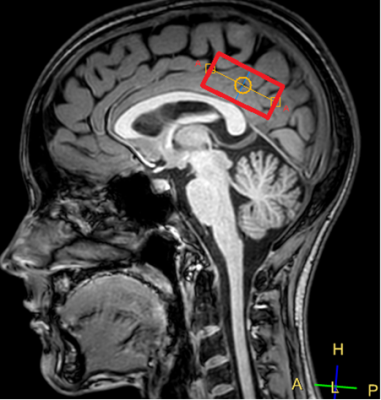
Figure 1. a) Measured single voxel (22 cm3, orange square) on a sagittal anatomical MR image of a 27-year old healthy young female (subject 1). b) A 7.5 sec 3T single voxel 1H-MR spectroscopy showing metabolites including lactate, c) Lactate concentrations, calculated within [1.23-1.48 ppm], are averaged over each sleep stage including Wake (W), non-REM stage 2 (N1), non-REM stage 2 (N2) and non-REM stage 3 (N3).
-
Reduced fMRI activation in the fusiform face area is related to higher hallucination proneness and lower glutamate levels assessed by 1H MRS
Ralf Mekle1, Jochen B. Fiebach1, and Heiner Stuke2
1Center for Stroke Research Berlin, Charité – Universitätsmedizin Berlin, Berlin, Germany, 2Department of Psychiatry and Psychotherapy, Charité – Universitätsmedizin Berlin, Berlin, Germany
Combining fMRI and 1H MRS
at 3T revealed that reduced activation in the fusiform face area is related to higher hallucination
proneness and lower glutamate levels, thus supporting theories of impaired
glutamatergic transmission being involved in the formation of hallucinations.
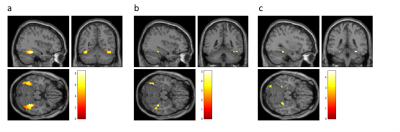
Fig. 2. Activations in the
a priori defined ROI of the bilateral gyrus fusisormis for face-stimuli versus
non-face stimuli (a, N = 18, MNI peak voxel = 38, -38, -18, puncorr < 0.001, pfwe < 0.001) and correlations of
these activations with hallucination proneness in the face task (b, negative
correlation, N = 18, MNI peak voxel = 38, -38, -18, puncorr < 0.001, pfwe = 0.040) and glutamate/NAA
ratios obtained from MRS (c, N = 16, MNI peak voxel = 32, -40, -16, puncorr < 0.001, pfwe = 0.121). In the figure, p-values of 0.005 were used for
illustration purposes.
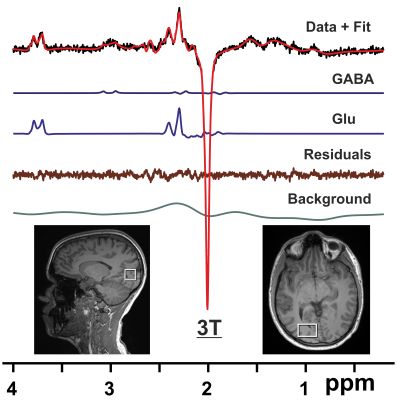
Fig. 1. 1H difference MR spectra from a VOI
in the right visual cortex (bottom inset) acquired at 3T with the MEGA-PRESS
sequence (TR/TE = 3000/68 ms) for a healthy volunteer together with
LCModel fit, LCModel output for GABA, Glu, fit residuals, and background.
Preprocessing of data included coil combination, removal of bad averages, and
phase and frequency correction.
-
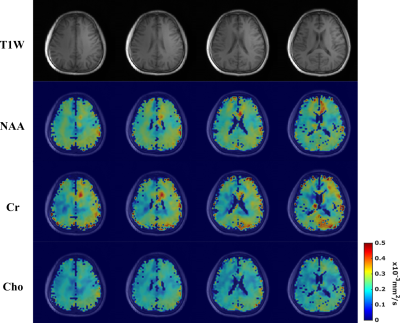
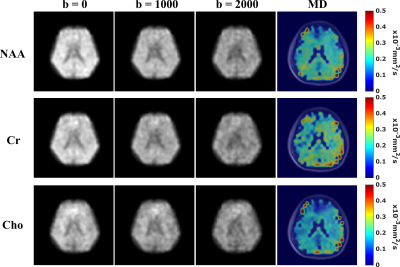
Simultaneous spectral and bi-exponential diffusion modeling of doubly motion-corrected human brain spectra with very high b-values
Kadir Şimşek1, André Döring1,2, André Pampel3, Harald E. Möller3, and Roland Kreis1
1Department of Radiology and Biomedical Research, University of Bern, Bern, Switzerland, 2Cardiff University Brain Research Imaging Centre (CUBRIC), School of Psychology, Cardiff University, Cardiff, United Kingdom, 3Max-Planck Institution for Human Cognitive and Brain Sciences, Leipzig, Germany
Diffusion-weighted
MRS is used at short-TE in human brain with two motion compensation methods and
a novel simultaneous spectral/diffusion-decay model to study non-Gaussian
diffusivity of metabolites at high b-values and to determine the macromolecular
background spectrum by diffusion.
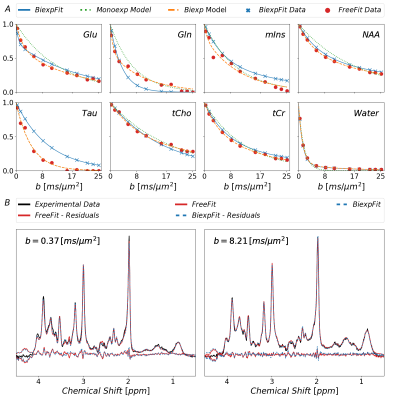
Fig.3: Fitted
diffusion decays as obtained with the different approaches described in the
text. Free-Fit data was modeled as mono- and biexponential decay. Biexp-Fit
(blue) is consistent for some metabolites but shows diverging results for
others. The non-Gaussian nature of diffusion is evident in both approaches for most
metabolites. At the bottom, spectra with the fits from Free-Fit as well as
Biexp-Fit are shown documenting how small the differences are even though the
decay function seem to differ substantially for some metabolites. (blue: Biexp-Fit;
red; Free-Fit)
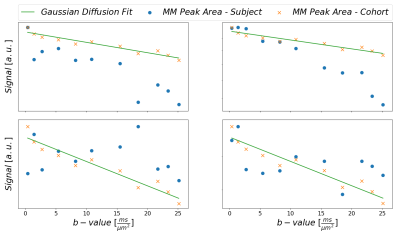
Fig. 1: Illustration
to motivate the need for the MM peak-based signal correction. For multiple
subjects, the peak areas of MM0.9 are plotted in relation to the monoexponential
decay fit for the cohort data from subjects without apparent strong artifactual
signal decay. Subject 2 shows systematic additional signal decay with higher
b-values on top of the MM diffusion effect, while subjects 1 and 3 show strong random
fluctuations.
-
Rapid MRSI of the Brain on 7T Using Subspace-Based Processing
Fan Lam1,2, Hoby Hetherington3, and Jullie Pan3
1Bioengineering, University of Illinois Urbana-Champaign, Urbana, IL, United States, 2Beckman Institute for Advanced Science and Technology, University of Illinois Urbana-Champaign, Urbana, IL, United States, 3Radiology, University of Pittsburgh, Pittsburgh, PA, United States
We present a new method for rapid 7T MRSI of the brain that uses subspace imaging to improve rosette MRSI (RSI). In vivo results showed substantial improvement over the standard RSI reconstruction and highlight the potentials of integrating acquisition and processing for ultrahigh-field MRSI.
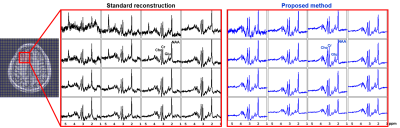
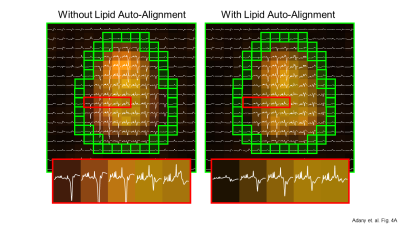
Spatially-localized spectra for a 4x4 voxel array from an anterior brain region are compared, with results produced by the standard reconstruction (see texts) and the proposed method (the blue curves). The location of the region-of-interest is indicated by the red box in the anatomical image on the left with overlaid voxel grids. Significant reduction in lipid leakage and SNR improvement can be observed for the spectra from the proposed method, especially for the edge voxels. Spectra are shown in real parts.
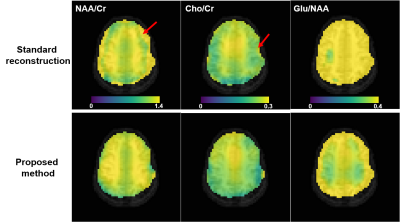
Comparison of NAA/Cr (column 1), Cho/Cr (column 2), Glu/NAA (column 3) maps from the standard reconstruction and the proposed method for one subject. As can be seen, the metabolite ratio maps produced by the proposed method have less artifacts (examples indicated by the red arrows) and better gray/white matter contrast (e.g., the Glu/NAA maps). The color scales were the same for the same column. The metabolite levels were obtained using spectral integration for this preliminary study, and no relaxation correction was performed.
-
Echo-planar Spectroscopic Imaging with Readout-segmented COKE at 7T: Artifact Analysis using a Purpose-Built Phantom and Simulation
Graeme A. Keith1, Amir Seginer2, David A. Porter1, and Rita Schmidt3
1Institute of Neuroscience and Psychology, University of Glasgow, Glasgow, Scotland, 2Siemens Healthcare Ltd, Rosh Ha’ayin, Israel, 3Neurobiology Department, Weizmann Institute of Science, Rehovot, Israel
Readout-segmented COKE achieves high spectral width EPSI spectra,
with coherent phase evolution at 7T, in the human brain. Residual lipid
contamination, due to the readout-segmented trajectory, is investigated in
simulations and phantom scans.
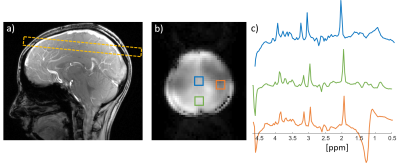
Figure
3: Human
scan results. a) Reference image with the scan location, b) water image with
the same parameters as the spectroscopic imaging scan. c) 1H spectra
at three regions shown in b). The scan parameters are described in the main
text.
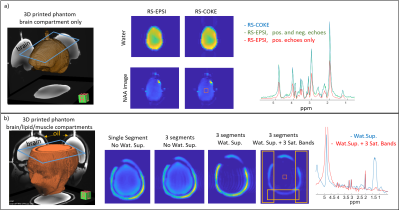
Figure
4: 3D-shaped
phantom imaging a) RS-EPSI versus RS-COKE with 3 readout segments with the “brain only” phantom. Images show water and
NAA maps and the spectrum for the central box (5x5 pixels). b) 3D-shaped
phantom including brain-like compounds and a
superficial compartment with a lipid-like compound. The slice location is
shown by blue overlay. Images compare single and 3-segment water images, a
3-segment acquisition with water suppression, and a 3-segment acquisition with
both water suppression and three saturation bands. Sequence parameters are given in the main text.
-
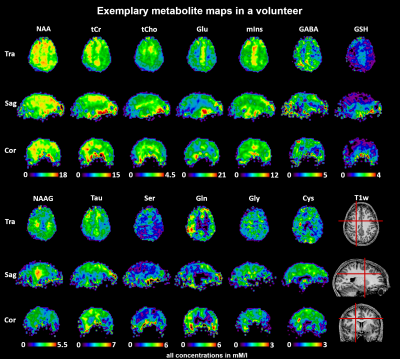
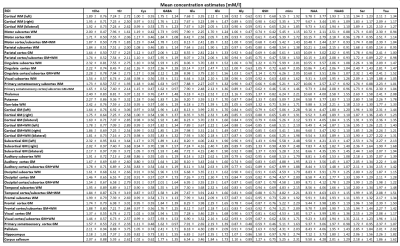
Whole Brain 3D-FIDESI-MRSI: Revisiting Free-Induction-Decay & Spin-Echo Readouts with Concentric Rings at 7 T
Lukas Hingerl1, Wolfgang Bogner1, Bernhard Strasser1, Petr Bednarik1, Stanislav Motyka1, Eva Heckova1, Ivica Just1, Alexandra Lipka1, Ovidiu Andronesi2, Stephan Gruber1, Siegfried Trattnig1,3, and Gilbert Hangel1,4
1Department of Biomedical Imaging and Image-guided Therapy, Medical University of Vienna, High Field MR Centre, Vienna, Austria, 2Department of Radiology, Massachusetts General Hospital, Martinos Center for Biomedical Imaging, Boston, MA, United States, 3Christian Doppler Laboratory for Clinical Molecular MR Imaging, Vienna, Austria, 4Department of Neurosurgery, Medical University of Vienna, Vienna, Austria
3D-FIDESI-MRSI
enables whole-brain lactate mapping without lipid contamination by
extending an FID sequence with a spin-echo readout, which features a
reduced but oversampled spherical k-space readout.
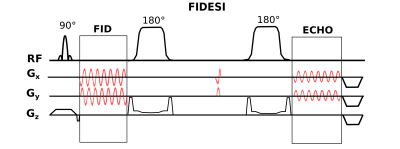
Figure 1: FIDESI features two analog-to-digital-converter readouts: Large k-space coverages for the high SNR FID scan and a small k-space coverage for the low SNR echo scan at TE 288 ms. The crusher gradient superimposed on the localization gradient ramp-down caused spectral acoustic sideband artifacts. A special pair of gradients was played out between the GOIA pulses for nulling the zero-order magnetization caused by the initial CRT gradients which move the trajectory to the specific ring radii.
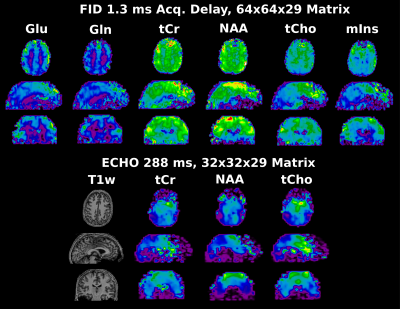
Figure 4: Whole brain metabolic Maps of the healthy Volunteer. FID maps have an effective measured matrix size of 64x64x29, echo maps have an effective measured matrix size of 32x32x15, but are interpolated to 32x32x29 before quantification. All maps are additionally interpolated by a factor of 2 for visualization purposes.
-
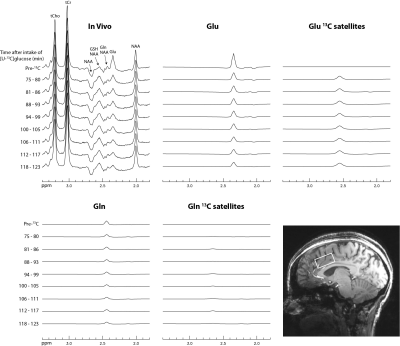
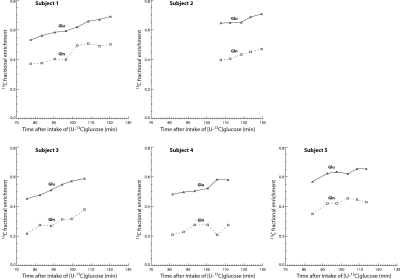
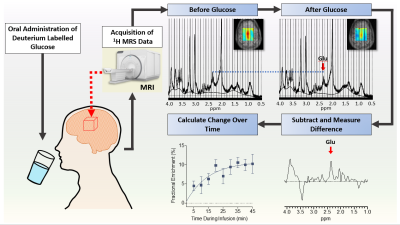
13C-Glucose Labeling Effects measured in the Occipital Lobe and the Frontal Cortex using short TE 1H MC-semiLASER SVS at 9.4T
Theresia Ziegs1,2, Johanna Dorst1,2, and Anke Henning1,3
1MRZ, MPI for Biological Cybernetics, Tuebingen, Germany, 2IMPRS for Cognitive and Systems Neuroscience, Tuebingen, Germany, 3Advanced Imaging Research Center, University of Texas Southwestern Medical Center, Dallas, TX, United States
Labeling effects after oral
intake of [13C-1]glucose are observed
in humans using a 1H
MC-semiLASER sequence at 9.4 T. Spectral time series acquired in the frontal
cortex as well as the occipital lobe show labelling induced changes of Glu and Gln spectral pattern directly detected
with 1H MRS.
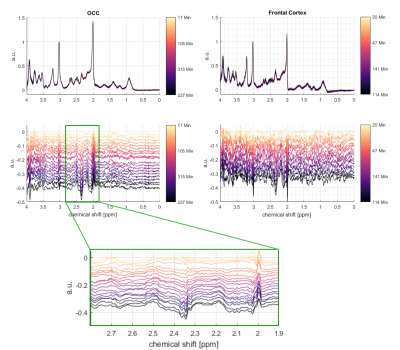
Figure 2: Time
series of the MC-semiLASER spectra from the occipital lobe (left) and frontal cortex (right)
and the corresponding difference spectra underneath. The difference spectra in
the spectral region of interest between 1.9 and 2.8 is zoomed in to make
changes more visible. The colorbar indicates the time of the (difference)
spectra after the glucose administration. Changes in the spectral region of NAA
and Cr can occur due to subtraction errors.
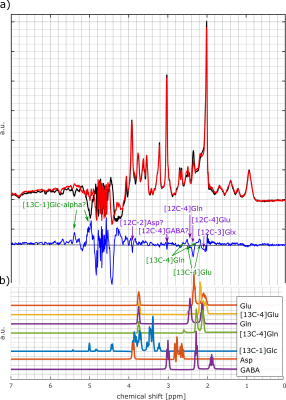
Figure 3: a) 1H MC-semiLaser
spectrum from one volunteer of the occipital lobe before glucose administration
(black line) and 127 minutes after the administration (red line) and the
difference spectrum (blue line). Obvious peak changes are marked: Decreasing
peaks are marked in purple and increasing peaks are marked in green. The
spectra contain 64 averages. b) Simulated spectra for selected metabolites and
labeled metabolites.
-
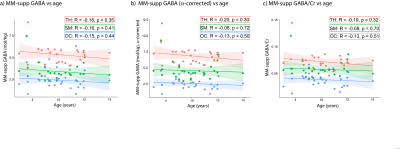
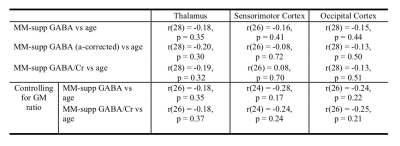
Repeatability assessment of GABA and GSH concentrations with HERMES: a comparison between traditional analysis and a novel approach
Diana Rotaru1, Georg Oeltzschner2,3, Richard Edden2,3, and David Lythgoe1
1Neuroimaging, King's College London, London, United Kingdom, 2Russell H. Morgan Department of Radiology and Radiological Science, The Johns Hopkins University School of Medicine, Baltimore, MD, United States, 3F. M. Kirby Research Center for Functional Brain Imaging, Kennedy Krieger Institute, Baltimore, MD, United States
A novel analysis method is proposed, the simultaneous modelling of HERMES GABA and GSH difference and sum spectra. The repeatability of this approach yielded comparable results to those produced by traditional single-spectrum analysis.
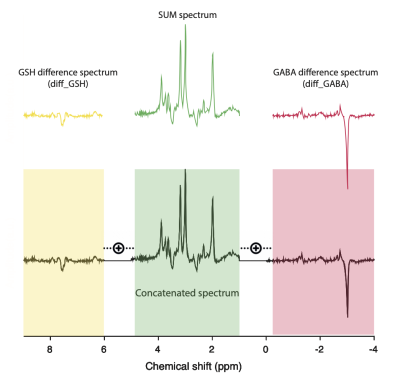
Figure.1 Transformation of the Hadamard reconstructed spectra (SUM - green, diff_GABA - red, diff_GSH - yellow) into a single concatenated spectrum with 1.2 ppm gap separation
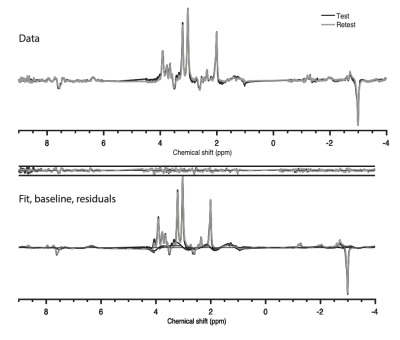
Figure 3. Mean processed spectral data is shown for test (black) and retest (grey) acquisitions at the top; mean LCModel fits, residuals and baselines are presented for test (black) and retest (grey) at the bottom
-
Constrained Optimized Water Suppression (COWS) for 1H Magnetic Resonance Spectroscopy
Karl Landheer1, Martin Gajdošík1, and Christoph Juchem1,2
1Biomedical Engineering, Columbia University, New York City, NY, United States, 2Radiology, Columbia University, New York City, NY, United States
A novel algorithm for water
suppression was introduced and validated, which can accommodate an arbitrary
number of pulses, minimum durations between pulses, total module duration and
maximum flip angles.
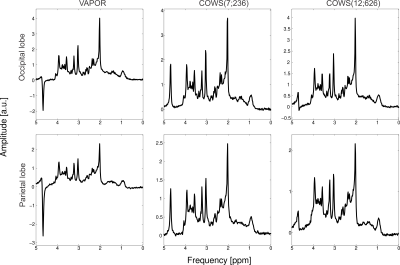
Figure
3: Metabolite spectra obtained from the occipital lobe (top row) and
parietal lobe (bottom row) for the three water suppression schemes tested here,
VAPOR, COWS(7;236) and COWS(12;626). COWS(7;236) has comparable performance to
VAPOR, while COWS(12;626) has marked improvement over both. Note that WS
schemes were applied as theoretically optimized and no experimental fine tuning
was performed.
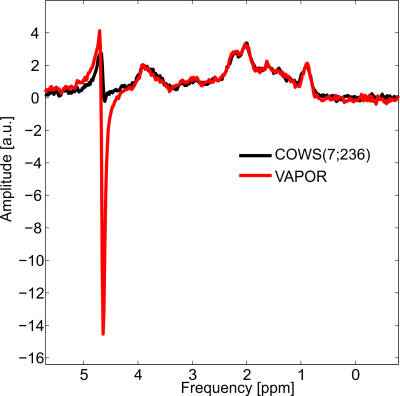
Figure
4: Macromolecule spectra obtained from the parietal lobe for VAPOR (red)
and COWS(7;236) (black). Marked reduction of residual water for COWS(7;236) was
observed over VAPOR. COWS(12;626) was not used due to its interference with the double
inversion preparation module.
-
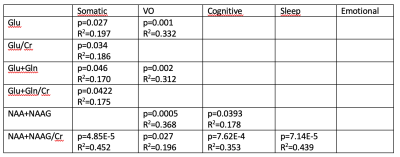
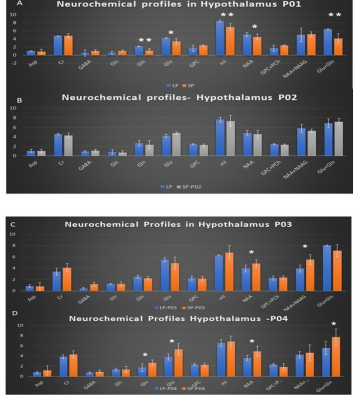
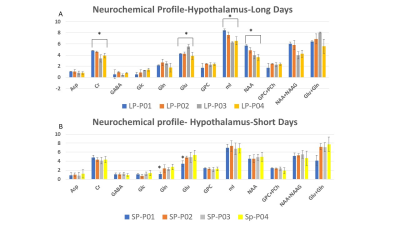
Feasibility of 1H-[13C] MRS of hippocampal and hypothalamic metabolism in the very same mouse with dynamic shim update (DSU)
Hikari Yoshihara1, Nicolas Kunz2, and Hongxia Lei2,3
1EPFL-LIFMET, Lausanne, Switzerland, 2EPFL-CIBM, Lausanne, Switzerland, 3United-Imaging Co. Ltd, Wuhan, China
13C MRS of the very same mouse hippocampus and hypothalamus at 14.1T is feasible using dynamic shimming update (DSU).
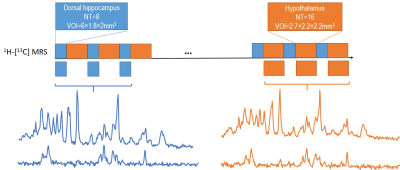
Figure 1. Schematic layout of the experimental
design for 1H-[13C] MRS acquisition of both hippocampus
and hypothalamus with dynamic shim update (DSU) (a), and typical non-edited (b)
and edited (c) MR spectra of hippocampus (blue) and hypothalamus (orange).
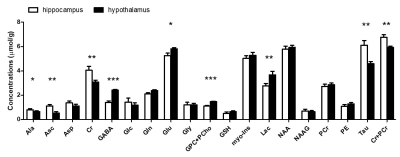
Figure 3. Neurochemical profiles of hippocampus and
hypothalamus
-
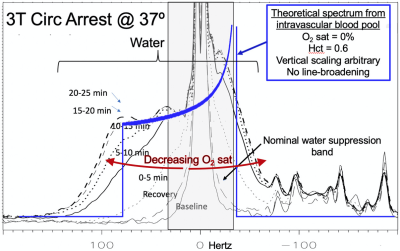
Utility of Residual Water in Proton MR Spectroscopy. The Measurement of Voxel Temperature and Hypoxia
Ralph E. Hurd1, Meng Gu1, Phil Adamson2, Kirk Riemer3, Ryan Beckman3, Michael Ma3, Kenichi Okamura3, Frank Hanley3, and Daniel Spielman1
1Radiology, Stanford, Stanford, CA, United States, 2Electrical Engineering, Stanford, Stanford, CA, United States, 3Cardiothoracic Surgery, Stanford, Stanford, CA, United States
A dominant, but manageable residual water signal in MR spectroscopy provides substantial value. A residual water-by-design strategy should be considered in sequence and protocol design.
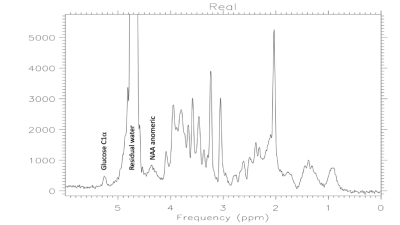
Figure 2. Baseline 37°C spectrum after PWS to 1% residual water. Good fidelity observed for nearest neighbors, the C1α of glucose and the anomeric proton of NAA. Spectral baseline for normal fit region above 4.2 ppm is unperturbed.
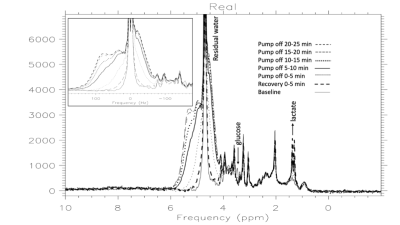
Figure 4. 37C Circulatory arrest. Powder-pattern develops during circulatory arrest and resolves after 5 minutes of recovery. The residual water reveals low level powder pattern which provides a measure of deoxy-Hb and hypoxia. Glucose recovers but lactate persists after hypoxia reversed.
-
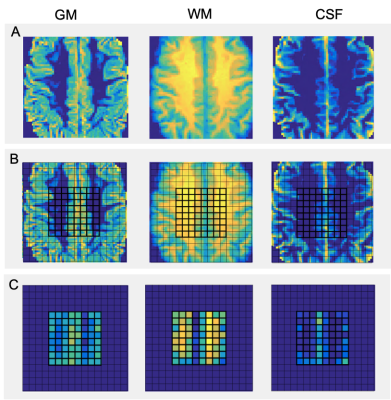
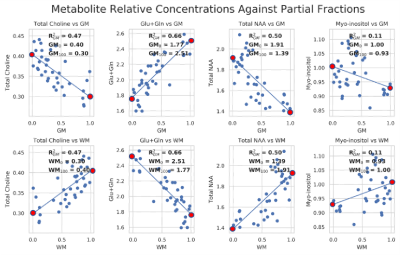
Mapping of differential metabolic regions of RRMS patients in multi-slices dimensional using Spiral-MRSI technique
Oun Al-iedani1,2, Jeannette Lechner-Scott2,3,4, Rodney Lea2, Ovidiu Andronesi5, and Saadallah Ramadan2,6
1School of Health Sciences, University of Newcastle, Newcastle, Australia, 2Hunter Medical Research Institute, Newcastle, Australia, 3Department of Neurology, John Hunter Hospital, Newcastle, Australia, 4School of Medicine and Public Health, University of Newcastle, Newcastle, Australia, 5Harvard Medical School, Massachusetts General Hospital, Boston, MA, United States, 6Faculty of Health and Medicine, University of Newcastle, Newcastle, Australia
Novel pipeline of Multi-slice spiral-MRSI coupled
with DMRs revealed NAA mapping in WM-lesions
was significantly lower than NAWM-MS and HCs, and is sensitive
in diagnosing NAWM in RRMS.
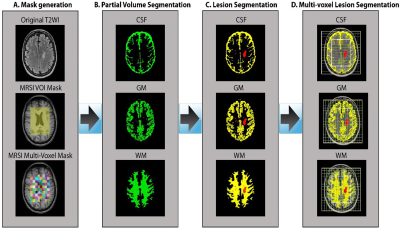
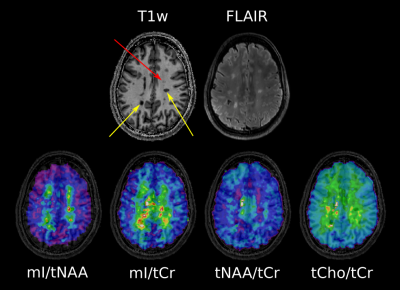
Pipeline of volumetric brain tissue segmentation from MRI and MRSI data.
A. A binary mask of a MRSI single slice VOI (8x10 cm2) was created
using the SPM toolbox. B. partial volume masks for each tissue type were
created using FSL FAST. C. Partial volume segmentation of the lesion filled
T1-MPRAGE structural images. D. Tissue segmentation of MRSI VOI (CSF, GM and
WM) and lesion segmentation overlaid on the T2-FLAIR image.
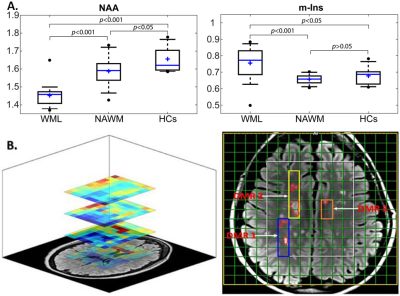
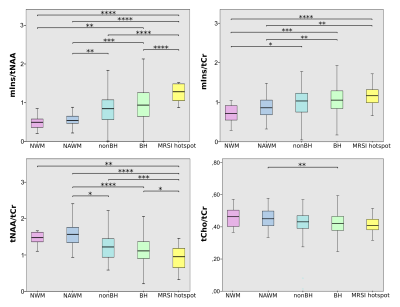
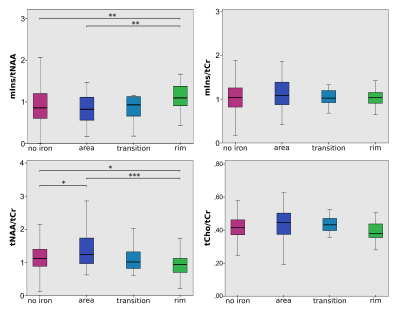
A. Box plot
of significant differences in the neurometabolic ratios (NAA/tCr)and
(m-Ins/tCr) for WML voxels, NAWM-MS and HC voxels in four slices of one DMR,
located within deep cortical white matter in posterior parietal lobes (left).
B. Mapping of NAA/tCr
ratios in single slice and multi-slice of 3 DMRs located in one axial brain
slice of an MS patient, using spiral-MRSI based representation of data, overlayed with
structural image.
-
Metabolic Impact of Spontaneous Trigeminal Allodynia in Sprague-Dawley Rats: Implications for Migraine & other Neurological Disorders
Samuel W. Holder1,2, Michael Graham Harrington3, and Samuel Colles Grant1,2
1National High Magnetic Field Laboratory, Florida State University, Tallahassee, FL, United States, 2Chemical & Biomedical Engineering, FAMU-FSU College of Engineering, Tallahassee, FL, United States, 3Molecular Neurology Program, Huntington Medical Research Institutes, Pasadena, CA, United States
Relaxation-enhanced
MRS at 21.1 T evaluated spontaneous trigeminal allodynia (STA) in the female
rat thalamus with and without nitroglycerin-induced sensitization. STA impacts the
buildup of naïve Glx signal but is reversed with nitroglycerin.
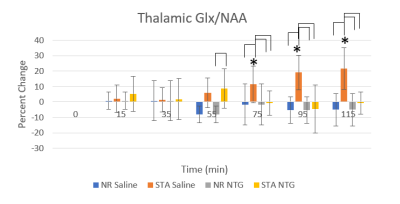
Figure 3: Temporal Glx increases
are observed in saline-injected STA animals, showing both between group and baseline significance. Baseline
significance begins 75 min post-injection, slightly before behavioral migraine
symptoms present in the nitroglycerin (NTG) group. NTG (10 mg/mg) was injected
at t=0 min. Brackets indicate significance between groups (p<0.05); * is
significance to baseline (p<0.05).
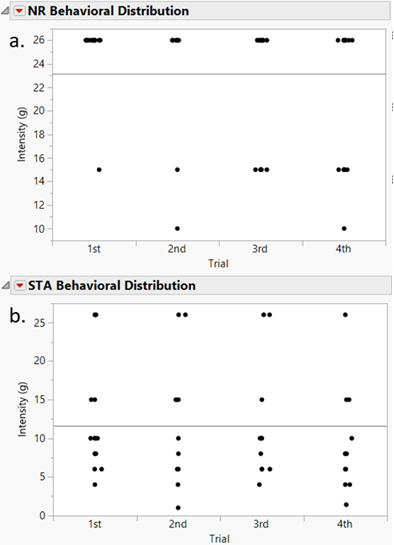
Figure 2: Periorbital
Von Frey mechanical sensitivity thresholds (force based on filament stiffness) for both (a) Naturally Resilient
(NR) and (b) Spontaneous Trigeminal Allodynic (STA) rats
-
1H MRS biomarkers in spinocerebellar ataxia type 1
Kirsten Kapteijns1, Teije van Prooije1, Jack JA van Asten2, Bart van de Warrenburg1, and Tom WJ Scheenen2
1Dept of Neurology, Radboudumc, Nijmegen, Netherlands, 2Dept of Medical Imaging, Radboudumc, Nijmegen, Netherlands
Altered
relative metabolite levels in tNAA, glutamate, and myo-Inositol could be replicated in SCA1 and correlated with clinical
scores. This indicates consistency of these MRS biomarkers, which can be
considered for future trials.
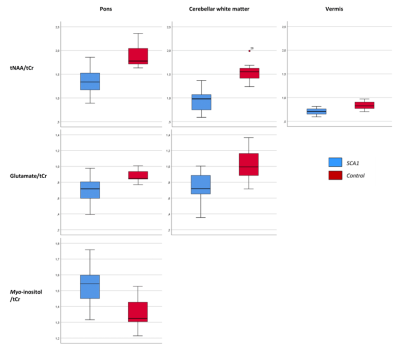
Figure 2 Visualization of the
significant differences in relative metaboliteslevels between patients with SCA1 and controls
in the three VOIs
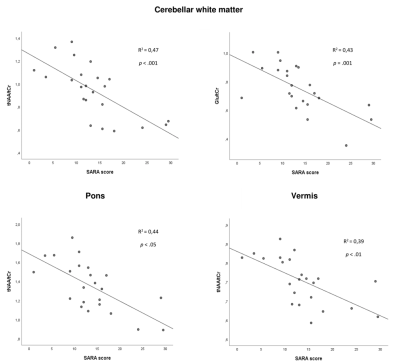
Figure 3 Correlation between relative metabolite levels
in the brain and clinical SARA scores. tNAA is significantly correlated in all
three VOIs, glutamate is correlated with clinical scores in the cerebellar
white matter.
-
Examining the relationship between glutathione and post-traumatic headache in patients with persistent post-concussive symptoms
Julie M Joyce1,2,3,4, Leah J Mercier2,4,5, Parker L La1,2,3,4, Tiffany Bell1,2,3, Julia M Batycky2,4,5, Chantel T Debert2,3,4,5, and Ashley D Harris1,2,3,4
1Department of Radiology, University of Calgary, Calgary, AB, Canada, 2Hotchkiss Brain Institute, University of Calgary, Calgary, AB, Canada, 3Alberta Children's Hospital Research Institute, University of Calgary, Calgary, AB, Canada, 4Integrated Concussion Research Program, University of Calgary, Calgary, AB, Canada, 5Department of Clinical Neurosciences, University of Calgary, Calgary, AB, Canada
Using edited spectroscopy, we found increased glutathione in the anterior cingulate is associated with greater functional impact of headache in patients with persistent post-concussive symptoms suggesting oxidative stress is related to post-traumatic headache.
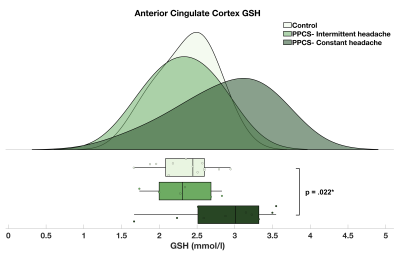
Figure 2. Raincloud plot depicting the GSH concentration distribution (mmol/l) in the anterior cingulate cortex of PPCS participants with intermittent (mean = 2.31 ± 0.41; n = 6) and constant headache (mean = 2.86 ± 0.61; n = 10) and matched, injury-free controls (mean = 2.36 ± 0.37; n = 13).
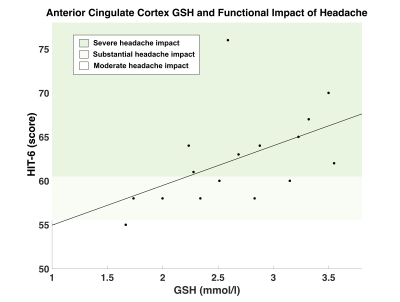
Figure 3. Association between functional impact of headache and GSH concentration (mmol/l) in the anterior cingulate cortex. GSH in the anterior cingulate cortex was positively correlated with HIT-6 scores; (higher HIT-6 scores indicates greater functional impact of headache) r(16) = 0.507, p = 0.045*. HIT-6 score classifications: (1) little-to-no impact (score: 36-39), (2) moderate impact (score: 50-55), (3) substantial impact (score: 56-59), (4) severe impact (score 60-78).
-
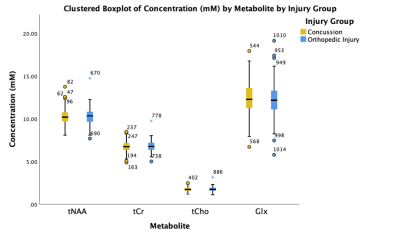
1H MR spectroscopic imaging for identifying diffuse abnormalities in mild traumatic brain injury: initial results from a reproducibility study
Anna M Chen1, Teresa Gerhalter1, Seena Dehkharghani1,2, Rosemary Peralta1, Fatemeh Adlparvar1, Martin Gajdošík3, Mickael Tordjman1,4, Julia Zabludovsky1, Sulaiman Sheriff5, James S Babb1, Tamara Bushnik6, Jonathan M Silver7, Brian S Im6, Stephen P Wall8, Guillaume Madelin1, and Ivan I Kirov1,2,9
1Center for Biomedical Imaging, Department of Radiology, New York University Grossman School of Medicine, New York, NY, United States, 2Department of Neurology, New York University Grossman School of Medicine, New York, NY, United States, 3Department of Biomedical Engineering, Columbia University School of Engineering and Applied Science, New York, NY, United States, 4Department of Radiology, Cochin Hospital, Paris, France, 5Department of Radiology, University of Miami Miller School of Medicine, Miami, FL, United States, 6Department of Rehabilitation Medicine, New York University Grossman School of Medicine, New York, NY, United States, 7Department of Psychiatry, New York University Grossman School of Medicine, New York, NY, United States, 8Ronald O. Perelman Department of Emergency Medicine, New York University Grossman School of Medicine, New York, NY, United States, 9Center for Advanced Imaging Innovation and Research, Department of Radiology, New York University Grossman School of Medicine, New York, NY, United States
Lobar linear regression analysis yielded higher Cho, Cr and mI in WM in mTBI patients compared to controls. No group differences for NAA were found in WM, nor for any metabolites in GM. Associations were detected between metabolites and symptoms in WM, and between metabolites and cognition in GM.
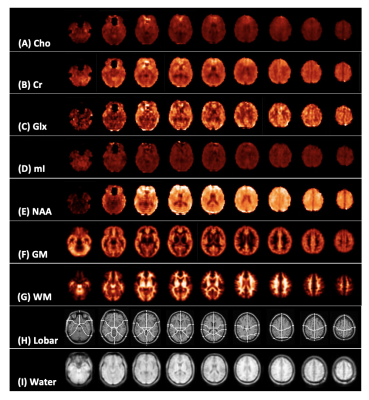
Figure 1: Representative spectroscopic map images for a single control subject. Presented is every fifth slice from the volumetric data for (A) creatine (Cr), (B) choline (Cho), (C) myo-inositol (mI), (D) glutamate plus glutamine (Glx), (E) N-acetyl aspartate (NAA), (F) grey and (G) white matter segmentation (GM, WM), (H) lobar parcellation, and (I) water (used as quantification reference) at the spectroscopic image spatial resolution.
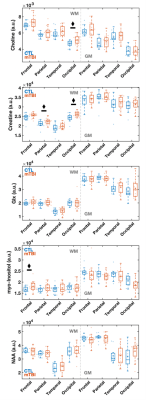
Figure 3: Boxplots of lobar metabolite distributions within mTBI and control (CTL) cohorts. Occipital WM Cho and Cr, parietal WM Cr, and frontal WM mI are higher in mTBI patients compared to controls (MW, ♦: p 0.05). Note that in all lobes WM Cr and Cho medians are higher in mTBI patients compared to controls. Cho: choline, Cr: creatine, mI: myo-inositol, Glx: glutamine plus glutamate; NAA: N-acetyl aspartate; WM: white matter.