-
Cognitive training-derived microstructural and functional neuroplasticity and the neural mechanisms underlying the far-transfer effect
Daisuke Sawamura1,2, Ryusuke Suzuki3, Shinya Sakai1, Keita Ogawa4, Xinnan Li2, Hiroyuki Hamaguchi2, and Khin Khin Tha5
1Department of Rehabilitation Science, Hokkaido University, Sapporo, Japan, 2Department of Biomarker Imaging Science, Hokkaido University, Sapporo, Japan, 3Department of Medical Physics, Hokkaido University Hospital, Sapporo, Japan, 4Department of Rehabilitation, Hokkaido University Hospital, Sapporo, Japan, 5Global Center for Biomedical Science and Engineering, Hokkaido University Faculty of Medicine, Sapporo, Japan
The right inferior parietal lobule, its
neural connections, and the right cerebellar vermis are the key regions
modulating cognitive functions such as provoking the far-transfer effect.
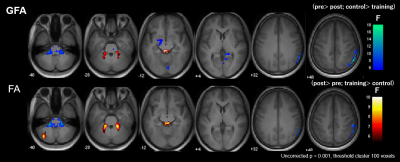
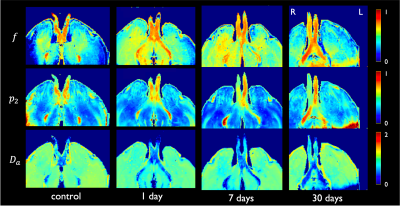
Figure 3. Significant group-by-time interaction
observed in GFA and FA.
Clusters with significant interaction in the 2 × 2
mixed-design ANOVA (uncorrected P< 0.001, cluster threshold= 100 voxels) of
GFA (upper low) and FA (lower row). The clusters are overlaid on the MPRAGE
images. The look-up table indicates F-values for group × time interaction. Cool
color indicates post-training assessment < pre-training assessment, training
< control, and hot color indicates pre-training assessment <
post-training assessment, control< training.
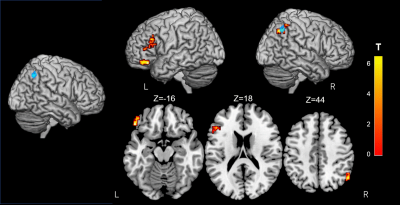
Figure 4. Alterations of resting-state functional connectivity in
significant GFA Clusters.
The brain voxels
which are functionally connected to the right inferior parietal lobule cluster
(Blue) reveal a significant interaction in GFA using a 2 × 2 mixed-design
ANOVA. The rsFC between this region and the left frontal pole, the inferior
frontal gyrus and the right lateral occipital cortex, increases upon cognitive
training (FWE-corrected P< 0.05). Significant clusters are shown on ch2better.nii
template using MRIcron. The look-up table indicates the T-value.
-
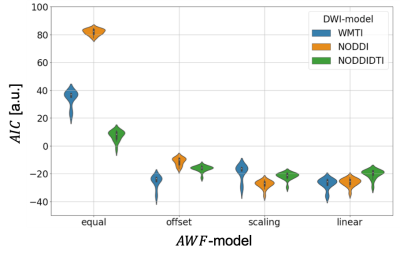
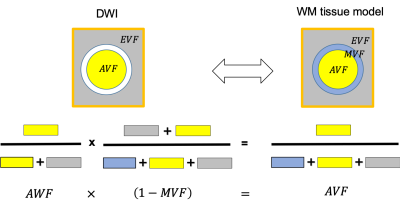
Quantifying tissue microstructural changes associated with short-term learning using model-based diffusion MRI
Michele Guerreri1, Thomas Villemonteix2,3, Whitney Stee3, Evelyne Balteau4, Philippe Peigneux3,4, and Hui Zhang1
1Computer Science & Centre for Medical Image Computing, University College London, London, United Kingdom, 2Laboratoire de Psychopathologie et Neuropsychologie, Saint Denis, Paris 8 Vincennes - St Denis University, Paris, France, 3Neuropsychology and Functional Neuroimaging Research Group (UR2NF) at the Centre for Research in Cognition and Neurosciences (CRCN), Université Libre de Bruxelles, Brussels, Belgium, 4Cyclotron Research Centre, University of Liège, Liège, Belgium
NODDI
and CHARMED used to investigate MD changes associated with brain plasticity induced
by a spatial navigation task. Free water fraction (FWF) from NODDI provide higher
sensitivity than MD and CHARMED metrics.
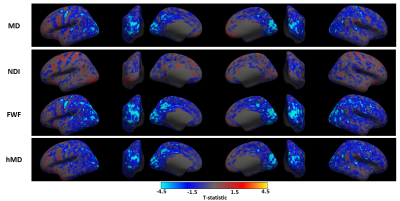
Figure
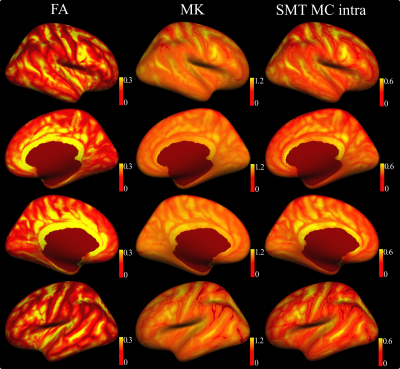
1. Surface analysis output: the t-statistic is reported vertex-wise for each of
the diffusion metrics. The direction of the learning related changes is color-coded,
bluish for decrease, reddish for increase of the parameter value. Each row
corresponds to a different metric. We report only those metrics with at least a
significant cluster after cluster-wise correction (figure 2). From top to
bottom: DTI’s mean diffusivity (MD); NODDI’s neurite density index (NDI) and
free water fraction (FWF); CHARMED’s mean diffusivity of the hindered
compartment (hMD).
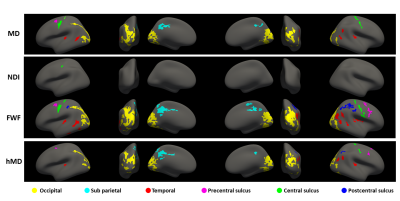
Figure
2. Surface analysis - significant clusters: same as figure 1 but reporting the clusters
of vertices found significant after cluster-wise correction. The
cluster-forming threshold was set at p<0.001. We report clusters with pFWE<0.05.
We use different colours to help comparing groups of clusters across metrics.
We identified an occipital group (yellow), a sub parietal group (cyan), a temporal
group (red), a precentral sulcus group (magenta) a central sulcus group (green)
and a postcentral sulcus group (blue).
-
White matter microstructure associated with functional connectivity changes following short-term learning of a visuomotor sequence
Stefanie A. Tremblay1,2, Anna-Thekla Jäger3, Julia Huck1, Chiara Giacosa1, Stephanie Beram1, Uta Schneider3, Sophia Grahl3, Arno Villringer3,4,5,6, Christine Lucas Tardif7,8, Pierre-Louis Bazin3,9, Christopher J Steele3,10, and Claudine J. Gauthier1,2
1Physics, Concordia University, Montreal, QC, Canada, 2Montreal Heart Institute, Montreal, QC, Canada, 3Neurology, Max Planck Institute for Human Cognitive and Brain Sciences, Leipzig, Germany, 4Clinic for Cognitive Neurology, Leipzig, Germany, 5Leipzig University Medical Centre, IFB Adiposity Diseases, Leipzig, Germany, 6Collaborative Research Centre 1052-A5, University of Leipzig, Leipzig, Germany, 7Biomedical Engineering, McGill University, Montreal, QC, Canada, 8Montreal Neurological Institute, Montreal, QC, Canada, 9Faculty of Social and Behavioral Sciences, University of Amsterdam, Amsterdam, Netherlands, 10Psychology, Concordia University, Montreal, QC, Canada
WM microstructure is altered in a stage-specific manner in the sensorimotor network in participants learning a complex motor sequence. Fast changes in WM tracts underlying the SMA, a region known for its role in sequence processing, as well as slower changes in S1 and M1, were observed.
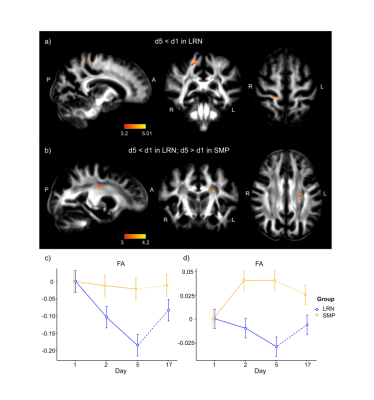
Figure 2. Changes in FA from voxel-wise analyses. a) Decrease in FA in the LRN group in WM tracts underlying S1 during overall learning (d1-d5). b) Decrease in FA in LRN and increase in SMP in WM tracts underlying M1 during overall learning (d1-d5). c-d) Mean changes in FA across time in both groups in the right S1 (c) and in the left M1 (d). Expressed as relative changes from baseline (d1). LRN: learning group (in blue); SMP: control group (in orange).
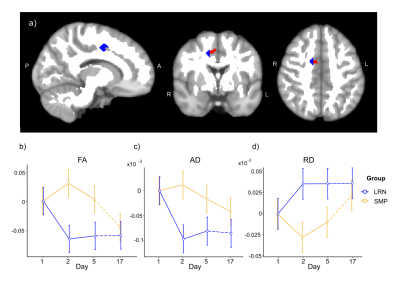
Figure 3. Changes in WM microstructure in the ROI underlying the right supplementary area (SMA) where changes in functional connectivity were found (unpublished). a) The right SMA ROI from resting-state analyses (in red) and the WM ROI (in blue; overlaid on the WM mask in white) are both overlaid on the MNI152 template. b-d) Mean changes in DTI metrics from baseline (d1) in both groups: FA (b) and AD (c) decreased in the LRN group between d1 and d2 and remained lower at d5 and d17. RD increased between d1 and d2 in LRN and remained higher at d5 and d17 (d).
-
Tissue Microstructural Changes following Four-Week Neurocognitive Training: Observations of Double Diffusion Encoding MRI
Xinnan Li1, Daisuke Sawamura2, Hiroyuki Hamaguchi1, Yuta Urushibata3, Thorsten Feiweier4, Keita Ogawa5, and Khin Khin Tha1,6
1Department of Biomarker Imaging Science, Graduate School of Biomedical Science and Engineering, Hokkaido University, Sapporo, Japan, 2Department of Functioning and Disability, Faculty of Health Sciences, Hokkaido University, Sapporo, Japan, 3Siemens Healthcare K.K., Tokyo, Japan, 4Siemens Healthcare GmbH, Erlangen, Germany, 5Department of Rehabilitation, Hokkaido University Hospital, Sapporo, Japan, 6Global Center for Biomedical Science and Engineering, Faculty of Medicine, Hokkaido University, Sapporo, Japan
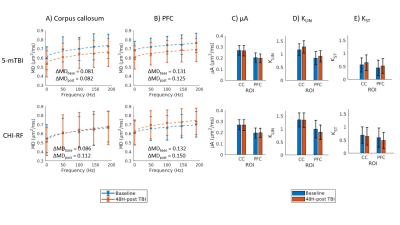
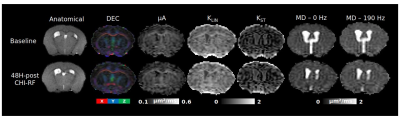
A decrease in μFA in the left middle frontal
gyrus was observed upon neurocognitive training. This decrease showed a
significant negative correlation with the changes in the response time as
assessed by the orienting attention network test.
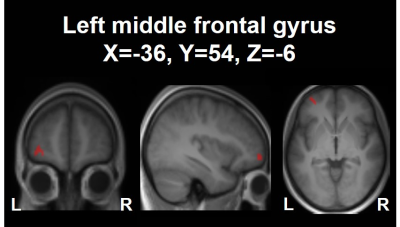
The cluster in the left middle frontal
gyrus (MNI
coordinates: X=-36, Y=54, Z=-6) showing a decrease in μFA upon the 4-week neurocognitive
training. The cluster is shown as an overlay on a 3D-MPRAGE template.
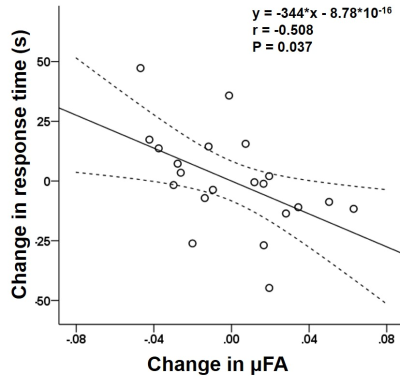
Scatterplots showing significant negative correlation between the change
in μFA of the left middle frontal gyrus and the changes in the response time as
assessed by the orienting attention network test (r=-0.508,
P=0.037). The straight and curved lines indicate the mean and 95% confidence
interval.
-
Microstructural alterations in the white matter of children with dyslexia assessed by multi-fascicle diffusion compartment imaging
Nicolas Delinte1, Claire Gosse2,3, Laurence Dricot3, Quentin Dessain1, Mathieu Simon1, Benoit Macq1, Marie Van Reybroeck2,3, and Gaetan Rensonnet1
1ICTEAM, UCLouvain, Louvain-la-Neuve, Belgium, 2IPSY, UCLouvain, Louvain-la-Neuve, Belgium, 3IoNS, UCLouvain, Brussels, Belgium
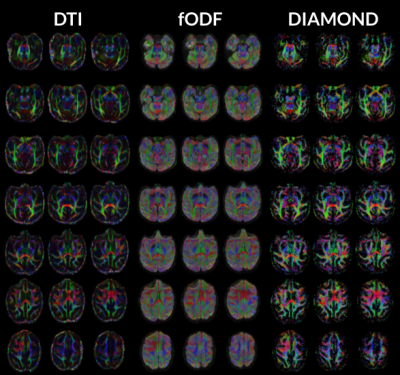
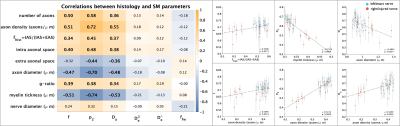
This study analyzed multi-shell diffusion MRI on a population of 17 dyslexic children and 18 controls. Advanced models (Diamond & Microstructure Fingerprinting), obtained stronger correlations with children's reading and spelling performance than DTI and showed increased sensitivity.
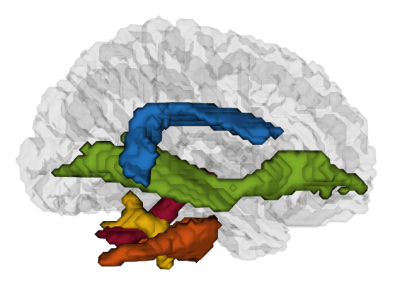
Figure 2. Sagittal view of a 3D representation of the regions of interest described in this report : arcuate fasciculus (in blue), inferior fronto-occipital fasciculus (in green), inferior cerebellar pedunculus (in yellow), middle cerebellar pedunculus (in orange) and superior cerebellar pedunculus (in red).
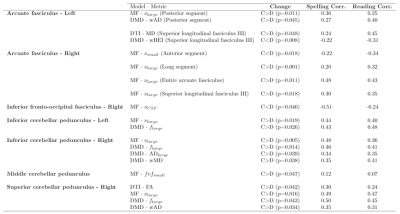
Table 2. Statistically significant differences between the control (C) and dyslexic (D) populations per region and per metric. The models from which the metrics are obtained are mentioned : Diffusion Tensor Imaging (DTI), Microstructure Fingerprinting (MF) or Diamond (DMD). The correlation observed between each metric and the spelling and reading performances in both populations are also provided in the leftmost columns.
-
Robust estimation of the fetal brain architecture from in-utero diffusion-weighted imaging
Davood Karimi1, Onur Afacan1, Clemente Velasco-Annis1, Camilo Jaimes1, Caitlin Rollins1, Simon Warfield1, and Ali Gholipour1
1Boston Children's Hospital, Harvard Medical School, Boston, MA, United States
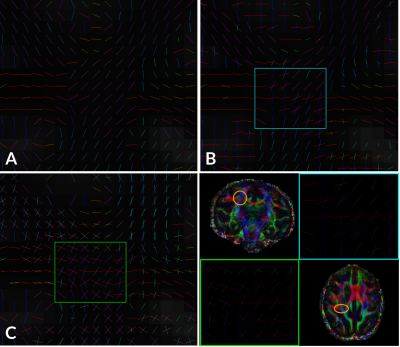
We propose a novel deep learning method for accurate and roust estimation of color fractional anisotropy from fetal diffusion-weighted magnetic resonance imaging scans. The proposed method is significantly more accurate than standard estimation methods.
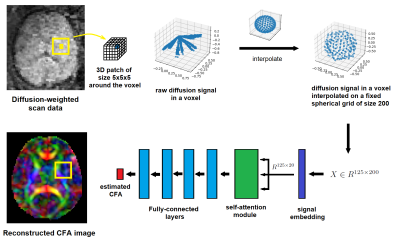
To estimate CFA in a voxel, a 3D patch of size 5 around that voxel is considered. The diffusion signal in each voxel is interpolated onto a fixed spherical grid of size 200. This results in a matrix of interpolated signals, X, where each of 125 rows is the signal for one of the voxels in the patch. The signals are first embedded into a smaller space of dimension equal to 20, where a self-attention module learns the correlation between the signals from neighboring voxels. A series of fully-connected layers are then applied to estimate the CFA for the voxel.
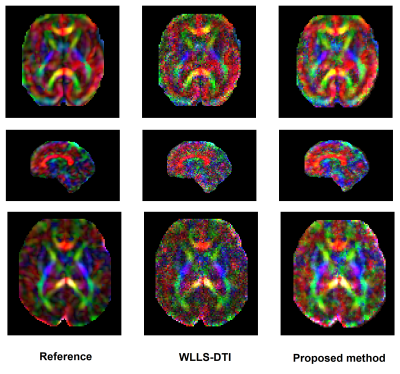
Comparison of our proposed method and WLLS-DTI on three fetal scans. In each row, the left image is the reference CFA image reconstructed with WLLS-DTI using the full DW-MRI measurements. The middle image is the CFA image reconstructed with WLLS-DTI using 20% of the measurements. The right image is the CFA image reconstructed with the proposed deep learning method using 20% of the measurements.
-
The value of quantitative diffusion tensor MRI in diagnosis of hypoxic ischemic brain injury (HIBD) in premature infant
Xueyuan Wang1, Bohao Zhang2, Xianglong Liu3, Kaiyu Shang4, Jinxia Guo4, Xin Zhao1, and Xiaoan Zhang1
1Third Affiliated Hospital of Zhengzhou University, Zhengzhou, China, Zhengzhou, China, 2College of Chemistry, Zhengzhou University, Zhengzhou, China, Zhengzhou, China, 3Zhengzhou Central Hospital Affiliated to Zhengzhou University, Zhengzhou, China, Zhengzhou, China, 4GE Healthcare, MR Research China, Beijing, China, Beijing, China
DTI can detect changes in white matter bundles that were not found by conventional MRI between mild HIBD and control group, showing promises for its use in the early diagnosis of HIBD. The FA values can reflect the development of prognosis.
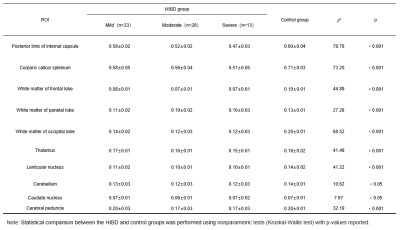
Table 1 The comparison of nonparametric test of FA values in four groups
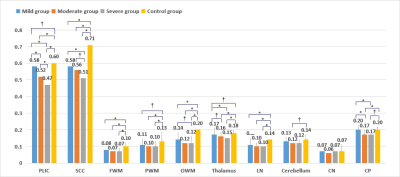
Fig.1 The multiple comparisons’results of four groups (†, p < 0.05; *, p < 0.001)The multiple comparisons between each HIBD subgroup (mild, moderate and severe group) and the control group were analyzed using Bonferroni method with significantly difference denoted by † p < 0.05, * p < 0.001.
-
Characterizing axonal and myelin microstructure development across early childhood using NODDI and qihMT
Jess E Reynolds1,2, Emma Tarasoff3, R Marc Lebel1,4, Bryce L Geeraert1, and Catherine Lebel1
1Department of Radiology, University of Calgary, Calgary, AB, Canada, 2Telethon Kids Institute, The University of Western Australia, Perth, Australia, 3Department of Neuroscience, University of Calgary, Calgary, AB, Canada, 4GE Healthcare, Calgary, AB, Canada
NODDI and qiHMT
metrics demonstrate that white matter development during early childhood is
dominated by increasing axon density, alongside ongoing myelination and
slightly decreasing axon coherence.
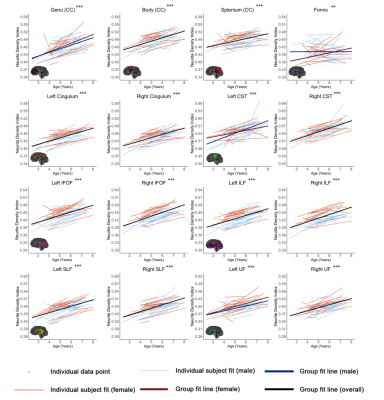
Figure 1. Relationships between age and NDI are shown for all tracts. Linear fit
lines for the entire dataset are shown in black (where there is no significant
age*sex interaction) or red and blue (separated for females and males, where
there is a significant age*sex interaction). Linear fit lines for each
individual subject are shown in thinner red (girls) and blue (boys) lines.
Individual data points are shown in grey. Significance of linear age term *** p
< 0.001, ** p < 0.01, * p < 0.05
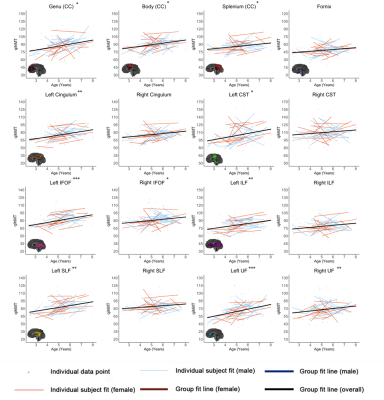
Figure 3. Relationships between age and qihMT (1/ms) are shown for all tracts. Linear fit
lines for the entire dataset are shown in black (where there is no significant
age*sex interaction) or red and blue (separated for females and males, where
there is a significant age*sex interaction). Linear fit lines for each
individual subject are shown in thinner red (girls) and blue (boys) lines.
Individual data points are shown in grey. Significance of linear age term *** p
< 0.001, ** p < 0.01, * p < 0.05
-
Investigating cortical microstructure in preterm-born adolescents using three-tissue compositional analysis
Thijs Dhollander1, Claire Kelly1,2, Ian Harding3,4, Wasim Khan3, Richard Beare1, Jeanie Cheong2,5,6, Lex Doyle2,5,6,7, Marc Seal1,7, Deanne Thompson1,2,7, and Peter Anderson2,8
1Developmental Imaging, Murdoch Children's Research Institute, Melbourne, Australia, 2Victorian Infant Brain Studies (VIBeS), Murdoch Children's Research Institute, Melbourne, Australia, 3Department of Neuroscience, Central Clinical School, Monash University, Melbourne, Australia, 4Monash Biomedical Imaging, Monash University, Melbourne, Australia, 5Newborn Research, The Royal Women's Hospital, Melbourne, Australia, 6Department of Obstetrics and Gynaecology, The University of Melbourne, Melbourne, Australia, 7Department of Paediatrics, The University of Melbourne, Melbourne, Australia, 8Turner Institute for Brain and Mental Health and School of Psychological Sciences, Monash University, Melbourne, Australia
We demonstrate the application of 3-tissue compositional analysis to study cortical microstructure, and identified changes to the cortical microstructural tissue composition in preterm-born children at age 13 years compared to typically developing children.
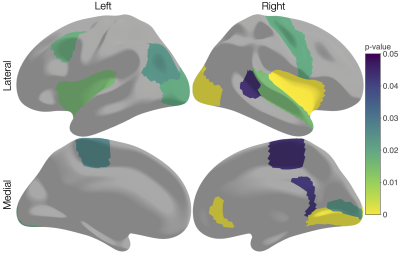
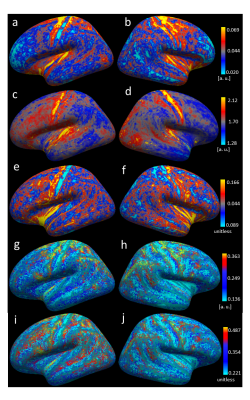
Figure 2. Cortical regions in which the overall 3-tissue composition differed significantly (p<0.05, FDR-corrected) between preterm-born and term-born children, when performing compositional data analysis via multivariate statistical analysis on the isometric log-ratio transformed 3-tissue compositions.
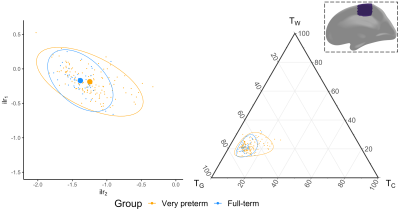
Figure 4. For a region in the sensorimotor (right paracentral) cortex, this shows: a scatter plot of the isometric log ratios (ilr), highlighting the overall group difference in tissue compositions (left); a ternary plot of the relative fractions of WM-like (TW), GM-like (TG), and CSF-like (TC) signal per participant, highlighting the relative shift from TG towards fluid-like (TC) composition (right). Ellipses are 95% confidence areas (the same area takes on a different shape in the ternary plot visually).
-
More than just axons: A positive relationship between an intracellular isotropic diffusion signal & pubertal development in white matter regions
Benjamin T Newman1,2, James T Patrie3, and T Jason Druzgal1
1Department of Radiology and Medical Imaging, University of Virginia, Charlottesville, VA, United States, 2Brain Institute, University of Virginia, Charlottesville, VA, United States, 3Department of Public Health Sciences, University of Virginia, Charlottesville, VA, United States
In the Adolescent Brain Cognitive Development (ABCD) study, we find a positive relationship between an intracellular isotropic diffusion signal and pubertal development in WM regions, providing evidence for complex microstructure changes in brain development within the WM skeleton.
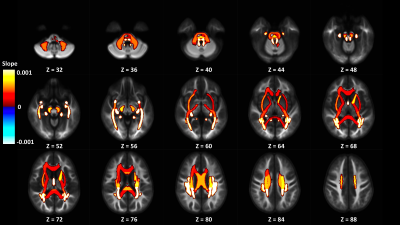
Figure 3: Display of significant adjusted GM-like signal fraction model slopes from ROIs in the JHU WM atlas colored by slope and displayed on the cohort specific template. ROIs located in the posterior parts of the brain appear to be more strongly positively associated with PDSS score than regions elsewhere.
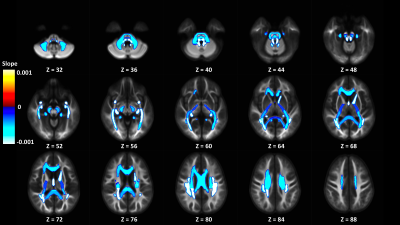
Figure 2: Display of significant adjusted WM-like signal fraction model slopes from ROIs in the JHU WM atlas colored by slope and displayed on the cohort specific template. ROIs located in the posterior parts of the brain appear to be more strongly negatively associated with PDSS score than regions elsewhere.
-
Harmonization of multi-site diffusion MRI data of the Adolescent Brain Cognitive Development (ABCD) Study
Suheyla Cetin-Karayumak1, Fan Zhang1, Tashrif Billah2, Sylvain Bouix1, Steve Pieper3, Lauren J. O'Donnell1, and Yogesh Rathi1
1Brigham and Women's Hospital and Harvard Medical School, Boston, MA, United States, 2Brigham and Women's Hospital, Boston, MA, United States, 3Isomics, Boston, MA, United States
The full harmonized diffusion MRI dataset will allow analysis of ~12,000 subjects altogether, which significantly will increase statistical power with the ability to better characterize the neurodevelopmental changes in the white matter of adolescents.
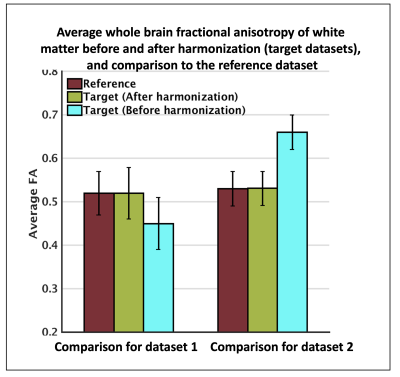
Harmonization performance on two datasets: one dataset was selected as a reference, two other datasets (from the rest of the 44) were selected as target (dataset 1, dataset 2) to be harmonized to the reference. To evaluate the performance of the harmonization, average fractional anisotropy along the whole brain white matter was computed for the reference, as well as target datasets before and after harmonization. Unpaired t-tests showed large between-dataset differences (p=0.0017) prior to harmonization. Statistical differences were removed after harmonization (p=0.53).
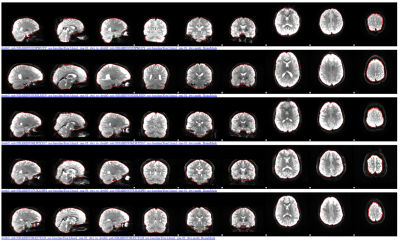
Brain masking of the dMRI data of the ABCD study using our software (https://github.com/pnlbwh/CNN-Diffusion-MRIBrain-Segmentation). Red outlines the brain of the five subjects from the ABCD study (fsl’s slicesdir was used for visualization). Each row shows a different subject brain and each column depicts the different brain slices of each subject.
-
Characterizing Temporal Pole Microstructure with Diffusion Kurtosis Imaging in Temporal Lobe Epilepsy
Loxlan Wesley Kasa1,2, Terry Peters1,2,3,4, Seyed M Mirsattari3,4,5, Ali R Khan1,2,3, and Roy AM Haast1
1Imaging Research Laboratories, Robarts Research Institute, London, ON, Canada, 2School of Biomedical Engineering, Western University, London, ON, Canada, 3Department of Medical Biophysics, Western University, London, ON, Canada, 4Department of Medical Imaging, Western University, London, ON, Canada, 5Department of CNS, Western University, London, ON, Canada
Diffusion kurtosis imaging was able to detect possible microstructure anomalies near the temporal pole in both lesional and nonlesional temporal lobe epilepsy subjects, though changes in the nonlesional group were not clearly visible using diffusion tensor imaging metrics.
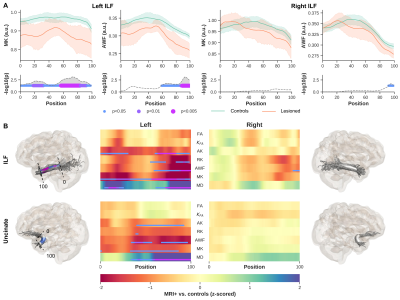
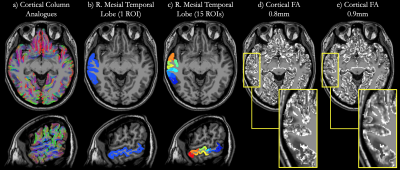
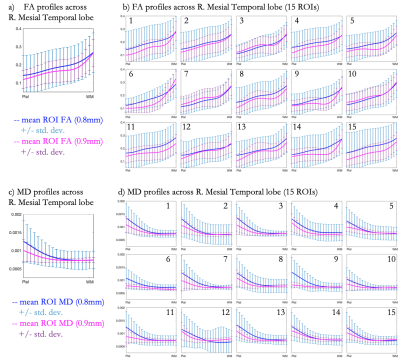
Figures 2. MRI+ patients vs controls. Showing only MK and AWF profiles for left and right ILF (A, top row) and corresponding p-values corrected for multiple comparisons using Bonferroni, age and sex (A, bottom row). Heat maps show z-scores for all DKI derived maps, for ILF (B, top row) and Unc (B, bottom row). To visualize the profile differences at corresponding anatomical locations along the bundles (0-100), the p-values are rendered onto the respective fiber bundles, showing here for MK only. Notice, only results from the side of lesions are shown for each bundle.
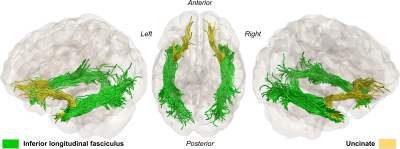
Figures 1. Anatomically constrained tractography, showing the two WM bundles of interest (inferior longitudinal and uncinate fasciculus) for a representative healthy subject.
-
Assessment of Perivascular Glymphatic System Activity in Middle-aged HIV Infected Patients on Combination Antiretroviral Therapies
Benedictor Alexander Nguchu1, Jing Zhao 2,3, Yanming Wang1, Jean de Dieu Uwisengeyimana1, Xiaoxiao Wang1, Bensheng Qiu1, and Hongjun Li2,3
1Hefei National Lab for Physical Sciences at the Microscale and the Centers for Biomedical Engineering, University of Science and Technology of China, Hefei, China, 2Department of Radiology, Beijing Youan Hospital, Capital Medical University, Beijing, China, 3School of Biological Science and Medical Engineering, Beihang University, Beijing, China
Glymphatic system activity is increased in the middle-aged HIV patients successfully adhering to cART. The increase is related to attention/working memory, suggesting a role of long-term use of cART in elevating glymphatic system and improving homeostasis for cognitive functioning.
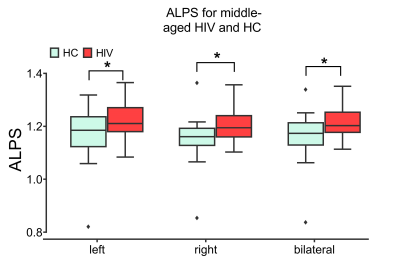
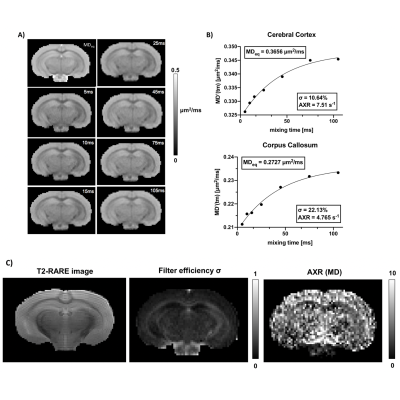
Figure
2. Comparison of ALPS indexes
in periventricular white matter between HIV-infected individuals and healthy
controls. ALPS indexes increased significantly (p<0.05, FDR-corrected) in
middle-aged HIV-infected patients stably adhering to cART.
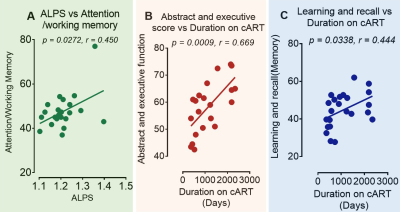
Figure 3. Results
of correlation analyses in middle-aged HIV patients. (A) The ALPS indexes of
the right perivascular space were correlated with attention/working memory. The
duration in which middle-aged HIV-infected patients were on antiretroviral
therapy correlated positively with the performance scores of (B) abstract and
executive function and (C) Learning and recall. Note, the correlation was
significant at p <0.05.
-
Altered Functional Connection and Neuroinflammation in Fibromyalgia Using Independent Component Analysis and Diffusion Kurtosis MRI
JIA-WEI Liang1, Tang-Jun Li2, Yao-Wen Liang3, Ting-Chun Lin3, Yi-Chen Lin3, Jiunn-Horng Kang2,4, You-Yin Chen3,5, and Yu-Chun Lo5
1Department of Biomedical Optoelectronic, Taipei Medical University, Taipei, Taiwan, 2College of Medicine, Taipei Medical University, Taipei, Taiwan, 3Department of Biomedical Engineering, National Yang Ming University, Taipei, Taiwan, 4Department of Physical Medicine & Rehabilitation, Taipei Medical University, Taipei, Taiwan, 5Ph.D. Program for Neural Regenerative Medicine, Taipei Medical University, Taipei, Taiwan
We
found that different functional connection between fibromyalgia patients and healthy control participants. The status of
neuroinflammation may play an important role of influencing functional
connection and brain structure may be the part of characteristic feature of fibromyalgia.
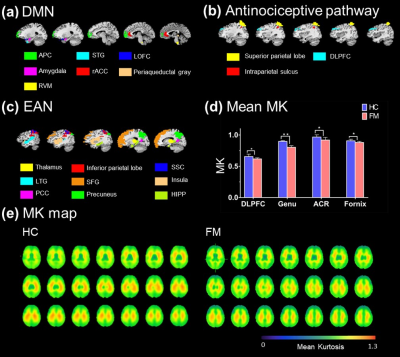
Figure 2. (a) (b) (c) The ROIs were selected form
DMN, antinociceptive pathway and EAN, respectively. (d) Comparison of DKI
parameters showed the significant
differences between HC and FM. In FM, decrease MK values shown in DLPFC
(HC: 0.655 ± 0.00386, FM: 0.617 ± 0.0178 [*p = 0.032]), ACR (control: 0.967 ± 0.036, FM: 0.919 ± 0.042 [**p = 0.007]), fornix (control: 0.907 ±
0.036, FM: 0.88 ± 0.016 [*p
= 0.037]) and genu of corpus callosum (HC: 0.897 ± 0.012, FM: 0.803 ± 0.017 [*p = 0.042]. (e) The MK map of whole
brain shows that decrease MK values.
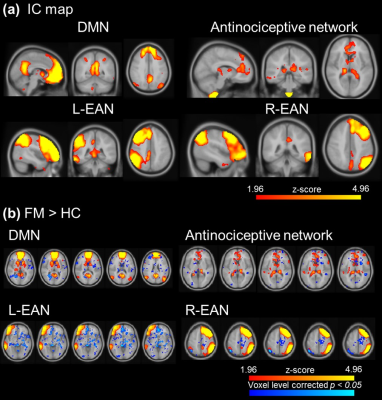
Figure 1. The
visualization of ICA after dual regression. (a) The IC map of DMN, antinociceptive network
and left and right EAN. (b) FM showed significant higher activation
in DMN, antinociceptive network and EAN.
-
Clinical correlations of DTI and volumetric metrics in people with multiple sclerosis
Abdulaziz Alshehri1,2, Oun Al-iedani1,2, Jameen Arm1,2, Neda Gholizadeh1, Thibo Billiet3, Rodney Lea2, Jeannette Lechner-Scott1,2,4, and Saadallah Ramadan1,2
1University of Newcastle, Newcastle, Australia, 2Hunter Medical Research Institute, Newcastle, Australia, 3Icometrix, Leuven, Australia, 4John Hunter Hospital, Newcastle, Australia
DTI correlated with disability and mental health of RRMS
patients and it is a sensitive tool in the evaluation of subtle and
inconspicuous disease processes within the total brain white matter and white matter lesions that are otherwise undetectable with structural MRI.
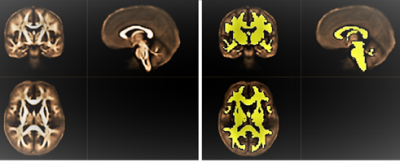
Figure
1. Left: Population-specific FA-template for the group under study. Right:
white matter mask overlaid on mean FA map.
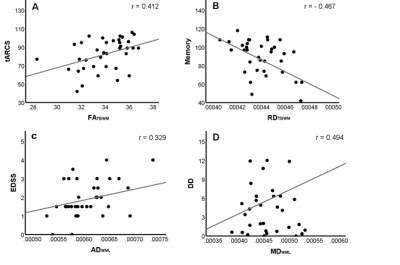
Figure 2. Scatter
plots showing some significant correlations: A) FATBWM with tARCS
(r=0.412), B) RDTBWM with Memory (r=-0.467), C) ADWML
with EDSS (r=0.329) and D) MDWML with DD (r=0.494).
-
Microstructural Gray Matter Abnormalities in Progressive Supranuclear Palsy and Corticobasal Syndrome: Evaluation by Free-water Imaging
Koji Kamagata1, Christina Andica1, Kaito Takabayashi1, Yuya Saito1, Wataru Uchida1,2, Shohei Fujita1, Toshiaki Akashi1, Akihiko Wada1, Kouhei Kamiya3, Masaaki Hori3, and Shigeki Aoki1
1Department of Radiology, Juntendo University Graduate School of Medicine, Tokyo, Japan, 2Department of Radiological Sciences, Tokyo Metropolitan University, Tokyo, Japan, 3Department of Radiology, Toho University Omori Medical Center, Tokyo, Japan
Diffusion tensor imaging and free-water imaging could detect cerebral grey matter abnormalities, which likely reflected the tau-related pathology, in corticobasal syndrome and progressive supranuclear palsy patients more sensitively than conventional voxel-based morphometry.
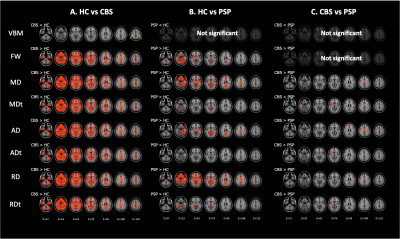
Figure 3. Comparison of VBM, DTI (MD, AD, and RD), and FW imaging (MDt, ADt, RDt, and FW) indices between patients with CBS and PSP and healthy controls.
The results showed reduced gray matter volume (blue–right blue voxels) and increased FW, MD, MDt, AD, ADt, RD, and RDt (red–yellow voxels) in CBS patients relative to controls (A). GBSS results showed increased FW, MD, MDt, AD, ADt, RD, and RDt (red–yellow voxels) in PSP patients relative to controls (B). GBSS results showed increased MD, MDt, AD, ADt, RD, and RDt (red–yellow voxels) in CBS patients relative to PSP patients (C).
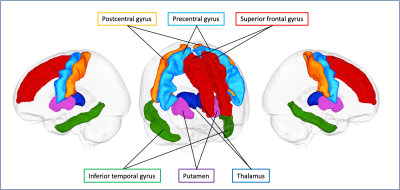
Figure 2. Gray matter regions of interest.
Six gray matter regions, which are described in the previous literature as vulnerable to tau pathology, based on the Desikan–Killiany cortical and subcortical atlas are shown in one representative case.
-
Can Diffusion Kurtosis Imaging and 3D-Arterial Spin Labeling perfusion imaging improve the diagnostic accuracy of Binswanger's Disease?
Xiaoyi He1,2, Weiqiang Dou3, Hansen Schie1, and Junying Wang1,2
1Department of Medical Imaging, Shandong Provincial Qianfishan Hospital, The First Hospital Affiliated with Shandong First Medical University, Jinan, China, 2Shandong First Medical University, Taian, China, 3GE Healthcare, MR Research China, Beijing, China
We proved that the combined DKI and 3D-ASL can be effectively tools exploring pathophysiological mechanisms and performing robust diagnostic accuracy for BD patients.
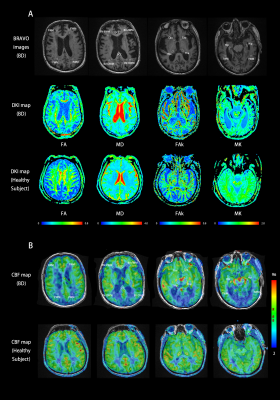
Figure. 1 BRAVO, FA, MD, FAk, MK (A) and CBF (B) maps of BD patients and healthy subjects. 26 kinds of ROIs were drawn along with the area of brain in BD and 18 kinds of ROIs in healthy subjects.
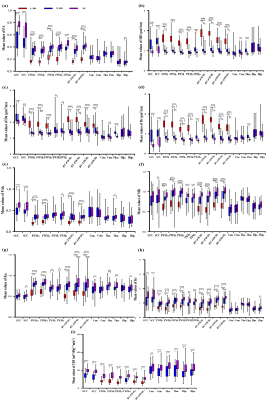
Figure. 2 Comparison of DKI measurements among the three groups and CBF between the different brain regions corresponded in BD and control groups.
Note: L-BD, lesions of BD; N-BD, non-lesions of BD; NC, normal controls; L/R, the left/right-hemispheric side; AV, average of bilateral ROI measurements;GCC/SCC, genu and splenium of the corpus callosum; FWM/PWM/TWM, frontal, parietal, and temporal WM; BV-FWM/BV-OWM, lateral ventricle around frontal and occipital WM; Cau, caudate nucleus; Tha, thalamus; Hip, hippocampus. Significant difference: *p < 0.05; **p <0.001; ***p < 0.0001.
-
Evaluation of Multi-shot DTI Metrics at Non-Compressed Levels for the Diagnosis and Prognosis of Degenerative Cervical Myelopathy (DCM)
Sisi Li1, Ke Wang2, Xiao Han3, Jinchao Wang3, Wen Jiang3, Xiaodong Ma4, Bing Wu5, Yandong Liu3, Wei Liang3, and Hua Guo1
1Center for Biomedical Imaging Research, Beijing, China, 2Electrical Engineering and Computer Sciences, University of California, Berkeley, Berkeley, CA, United States, 3Beijing Jishuitan Hospital, Beijing, China, 4University of Minnesota, Minnesota, Minnesota, MN, United States, 5GE Healthcare, MR Research China, Beijing, China
This work investigate the correlation of DTI metrics with the clinical assessment in different WM or GM tracts. The results indicate the potential prognostic value of DTI metrics at non-compressed C2 level for degenerative cervical myelopathy.
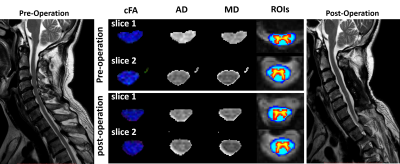
Figure
1. Pre-
and post-surgery DTI quantitative maps of one patient with positive surgical
outcome. Slice No.2 represents a vertebral level without visible compression
while slice No.1 represents a compressed level before surgery. WM ROI (blue) and GM ROI (red-yellow) are automatically registered and labeled by SCT.
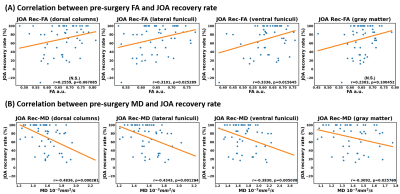
Figure.5
correlation
between pre-surgery (A) FA and (B) MD at C2 level and JOA recovery rate (JOA
Rec) in the following ROIs: dorsal columns (DC), lateral funiculi (LF), ventral
funiculi (VF) and gray matter (GM). The r and P values are marked
in each diagram. Correlation is considered significant if P<0.05.
-
Differentiation of spinal epidural hematoma and infection in vertebral decompression patients using Diffusion-Relaxation Matrix (DRM)
Daichi Murayama1, Takayuki sakai1, Masami Yoneyama2, and Shigehiro Ochi3
1Radiology, Eastern Chiba Medical Center, Chiba, Japan, 2Philips Japan, Tokyo, Japan, 3Eastern Chiba Medical Center, Chiba, Japan
The aim of this study was to differentiate between spinal epidural hematoma, spinal epidural abscess and pyogenic spondylitis based on the ADC and T2 values obtained using Diffusion-Relaxation Matrix (DRM). DRM could be useful for differentiation of spinal epidural hematoma and infection.
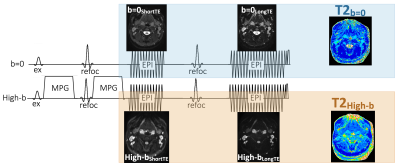
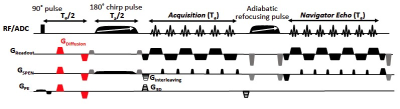
Fig.1 Sequence diagram of diffusion-relaxation matrix (DRM) sequence consists of dual-echo single-shot EPI-DWI without prolongation of acquisition time. Bipolar diffusion gradient was inserted as a pre-pulse of T2-map acquisition. To obtain the dual echo of different TE, this technique uses two 180° refocusing pulses for one 90° excitation pulse.
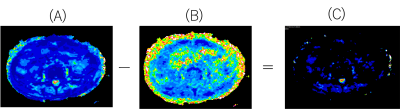
Fig.2 The ΔT2 map(C) was also created by differencing the T2 map : b-1000(A) from the T2 map : b-0(B)
-
Decreased sciatic nerve fractional anisotropy in diabetes and prediabetes associated with lower and upper limb function impairment
Johann ME Jende1, Zoltan Kender1, Christoph Mooshage1, Sabine Heiland1, Peter Nawroth1, Martin Bendszus1, Stefan Kopf1, and Felix T Kurz1
1Heidelberg University Hospital, Heidelberg, Germany
A decrease in sciatic nerve fractional anisotropy in patients with diabetes and prediabetes is associated with lower and upper limb function impairment. The study findings suggest the prevalence of nerve damage at early, subclinical stages of distal polyneuropathy in diabetes.
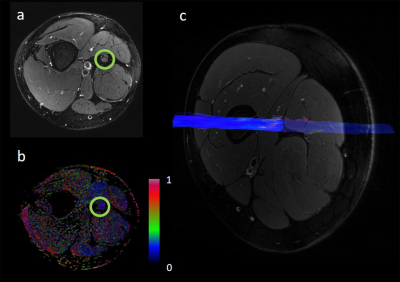
Fig. 1. Sciatic nerve fractional anisotropy. (a) T2-weighted image of the right thigh with encircled sciatic nerve. (b) Corresponding fractional anisotropy color map. (c) Reconstructed fibre track of the right sciatic nerve.